
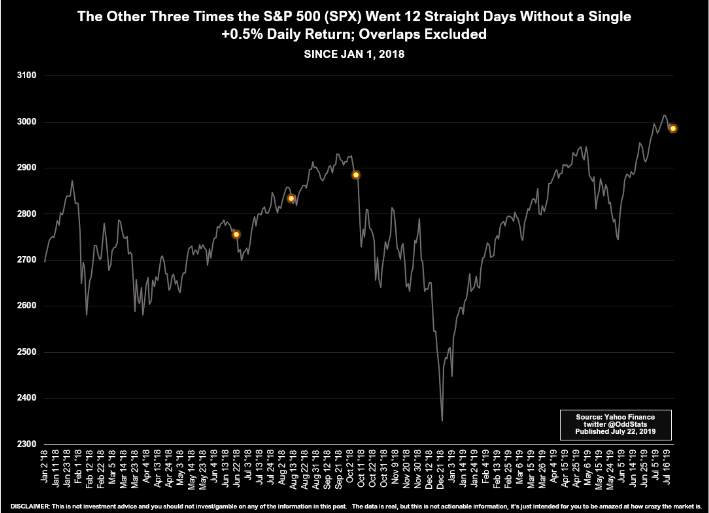
What’s the difference between Monday’s modest rally in the S&P 500 and the nearly .70% or 20 point rally on Tuesday; reiterating and detailing the reasons for U.S. trade delegates traveling to China for trade talks. With Tuesday’s stronger rally, it represented the first trading day the S&P 500 moved .5% or greater in 12 straight trading days. This highlights the complacency in the market in the month of July and the compressed VIX levels.
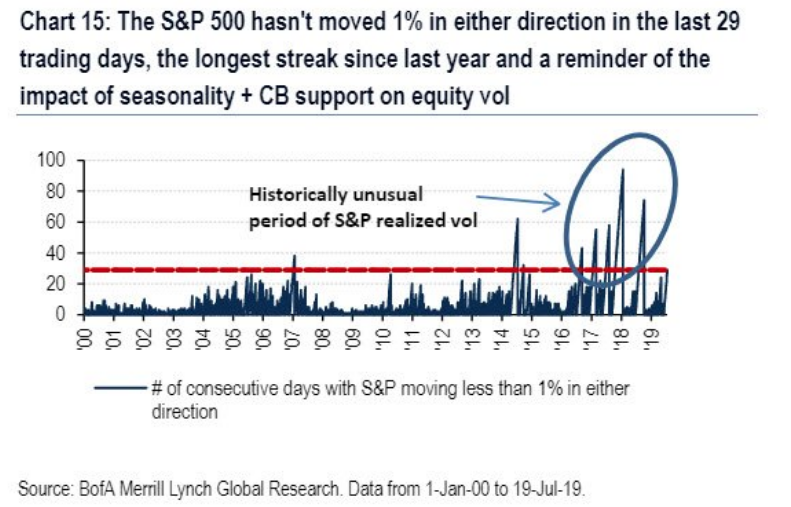
With the market delivering a .68% move on Tuesday, a 1% move is now the target for the benchmark index. With that in mind and after Tuesday’s market move, the S&P 500 hasn’t moved 1% in either direction in 30 trading days. (See chart below)
U.S. officials will travel to China for discussions sometime between Friday, the start of a six-week congressional recess in Washington, and Thursday, August 1. While the talks represent a critical next step after a truce reached between the countries’ leaders in June, a deal is not viewed as near. Having said that, people close to President Donald Trump have signaled that he’d be willing to relax restrictions on China’s Huawei in exchange for purchases of U.S. agricultural products. Longer-term, U.S. officials have suggested they could roll back the tariffs in exchange for Beijing making the deal legally binding.
While earnings do indeed continue to come in better than forecasted, Tuesday was once again a more geopolitical and domestic politically charged day for Wall Street. If it wasn’t the market responding to the upbeat trade headlines during the trading session, it was the market responding to the DOJ announcing broad antitrust reviews of Big Tech, pushing down shares of Alphabet (GOOGL), Facebook (FB) and Amazon (AMZN).

“Without much more information, this sounds more like the politics that the antitrust division has been playing for the last couple of years,” said Larry Downes, a senior industry and innovation fellow at the McDonough School of Business at Georgetown University. “They know antitrust law has not changed in 20 years.”
It was not yet completely clear whether this broader review, which is seeking information and comments from competitors, or “industry participants” and consumers, is separate from or supersedes news early last month that the Big Four in tech were the target of separate investigations by the DOJ and the FTC, which had divvied up the cases between them. The four-paragraph statement by the DOJ is confusingly free of any details, including what companies are actually targeted.
In pursuing antitrust actions against four of the largest public companies in the world, the federal government faces four major challenges.
- Defining a monopoly in the internet age: In past marquee antitrust cases, the road map for a breakup was relatively straightforward. The Standard Oil case, decided by the Supreme Court in 1911, split up the company largely along geographic lines.
- Tech moves quickly, antitrust actions do not: The Justice Department’s antitrust lawsuit against AT&T, and its unsuccessful bid to break up Microsoft, took years to unfold and bled from one presidential administration to another. Indeed, whoever wins the White House in 2020 may be out of office before a potential case against one of the targeted four companies is decided or settled. A two-year FTC probe of Google for violating antitrust and anti-competition statutes in how it arranges its Web search results resulted in no action in 2013.
- Divestiture is hard in the digital age: Charlotte Slaiman, competition policy counsel at consumer advocacy group Public Knowledge, argue that imposing restrictions on how social media companies use data could be a more effective strategy than breaking them up. There is simply little precedent in divesting tech companies, short of blocking mergers, she says.
- Tech companies are formidable targets to pursue: The sheer size and resources of the four companies under scrutiny — collectively, they employ over 900,000 people and rang up nearly $700 billion in sales last year — afford them the luxury of hiring an army of attorneys that dwarf the federal government, setting up a confrontation that could wend its way through court for years, according to Schwartzman. Which leads to the inevitable question: What is likely to happen, if anything?
The news that was released after the closing bell on Tuesday, found the tech sector under pressure and after hours. The sentiment has found its way into the equity futures on Wednesday with all major averages looking to open lower on Wall Street and ahead of what investors will be focused on for the trading day, Robert Mueller’s testimony before Congress. Trust that this will prove to be the event of the day, airing on the major business and world news networks.
Speaking of tech earnings which will also be a highlight after the closing bell Wednesday, Snap (SNAP) shares soared in the after hours on Tuesday and on better than expected results. The company posted a slimmer-than-expected loss for the second quarter while exceeding expectations for user growth and revenue.
- Loss per share: 6 cents vs.10 cents forecast by Refinitiv
- Revenue: $388 million vs. $359.7 million forecast by Refinitiv
- Global daily active users (DAUs): 203 million vs. 192.4 million forecast by FactSet
- ARPU: $1.91 vs. 1.84 forecast by Refinitiv
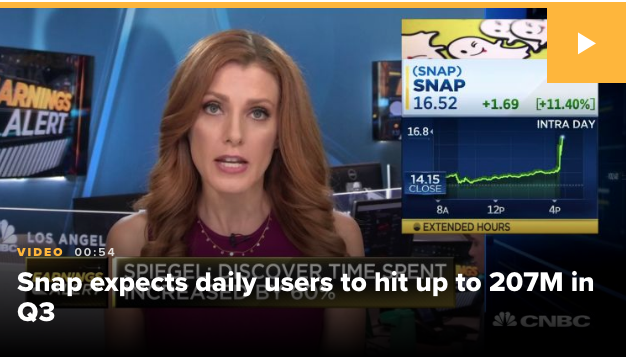
Snap’s user base grew to 203 million daily active users. This was the second quarter in a row of growth for the company, which saw its user base shrink from 191 million daily users in the first quarter of 2018 to 188 million the following quarter.
The company reported revenue of $388 million for the second quarter, up 48% compared to a year prior. Notably, the company reported a gross margin of 46%, a vast increase from the 30% gross margin reported a year prior.
“We continue to make significant progress in driving down our underlying unit costs over time, including the cost to deliver a Snap, the cost to deliver an impression, and other key drivers of infrastructure costs,” said Snap Chief Financial Officer Derek Andersen in his prepared remarks.
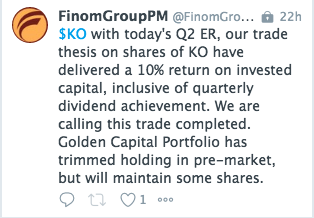
Also on Tuesday, shares of Coca-Cola (KO) reached an all-time high after reporting better than forecasted results and raising full year guidance. Finom Group issued a trade alert in Q1 on shares of KO for the benefit of Premium Members at $49.

Here’s what the company reported for its fiscal second quarter compared with what Wall Street was expecting, based on a survey of analysts by Refinitiv:
- Adjusted earnings per share: 63 cents, adjusted, vs. 61 cents expected
- Revenue: $10 billion vs. $9.99 billion expected
Coca-Cola reported net income of $2.61 billion, or 61 cents per share, up from $2.32 billion, or 54 cents per share, a year earlier. Excluding items, Coke earned 63 cents per share, topping the 61 cents per share expected by analysts surveyed by Refinitiv.
Net sales rose 6% to $10 billion, narrowly beating expectations of $9.99 billion. Coke raised its full-year outlook for revenue and now expects organic revenue growth of 5% rather than 4 percent.
“We think the dollar is towards the end of a strong cycle,” CFO John Murphy said.
Finom Group updated its trade on shares of KO on Tuesday, which indicated the greater than 10% return YTD on invested capital.
Consumer Staples have been on fire over the past 7 months. XLP (Consumer Staples ETF) has rallied nonstop and without the volatility associated with the tech sector or S&P 500 more generally speaking.
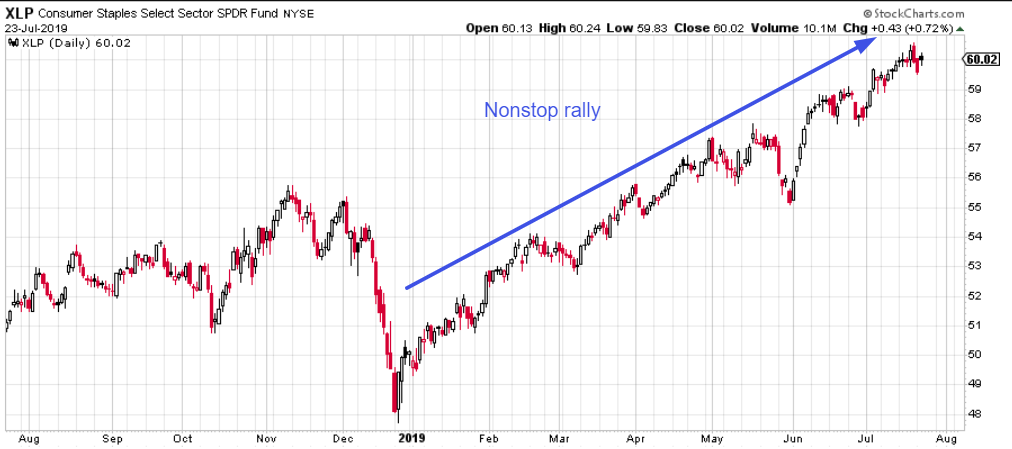
Given the macro backdrop and apparent performance in the XLP year-to-date, some might thing the rally is on the cusp of peetering out. That’s not how Lori Calvasina sees it.
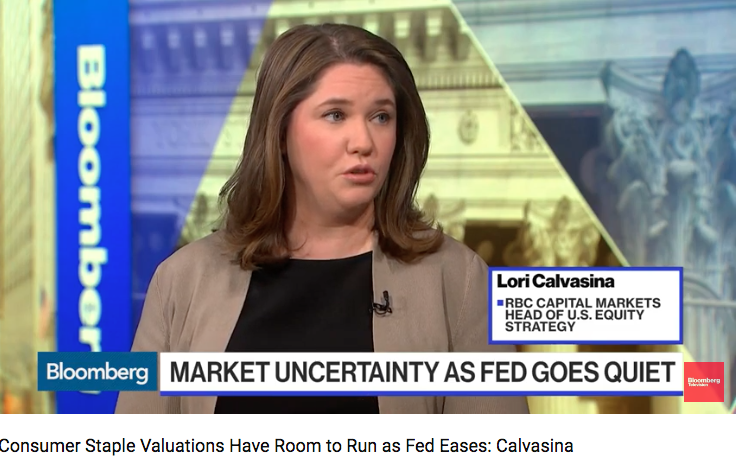
“When the Fed is in easing mode, high dividend yielders tend to outperform well. Lower rates are good for the consumer backdrop. Consumer Staples are expensive on PE, but really cheap on price-to-cash flow.”
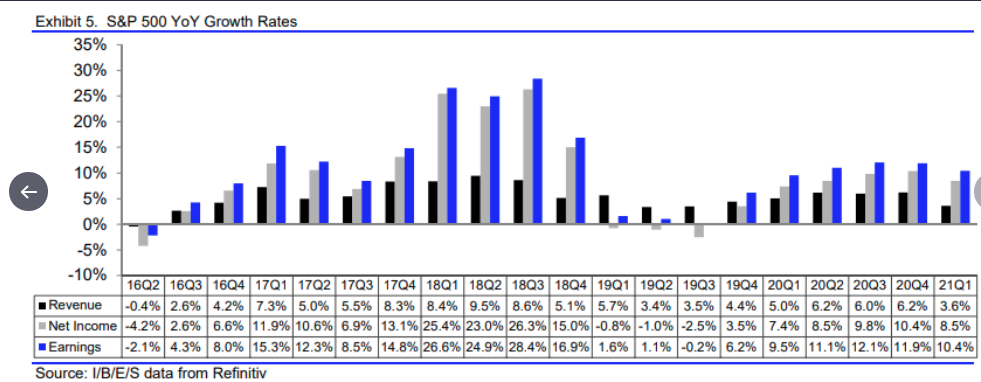
The dire and most infamously heralded earnings recession ahead of Q1 and now Q2 earnings seasons doesn’t seem to be unfolding. At this point in the Q2 earnings season, 104 companies have reported. Some 79% have beat on earnings and 64% on revenues compared to the long-term average of 65% and 60% respectively. (Refinitiv forecasts for Q2 below)
With much of the financial services sector companies having reported and now the cyclicals and technology sectors following suit, the 27 GICS Level 3 Industries (classification by Bespoke Investment Group), were up on the year, with performances ranging from +30% gains for Construction Materials, Consumer Finance, and Building Products to weaker sub-2% gains from Distributors and Diversified Financial Services. Below is a table of the GICS Level 3 Industries price returns by industry.
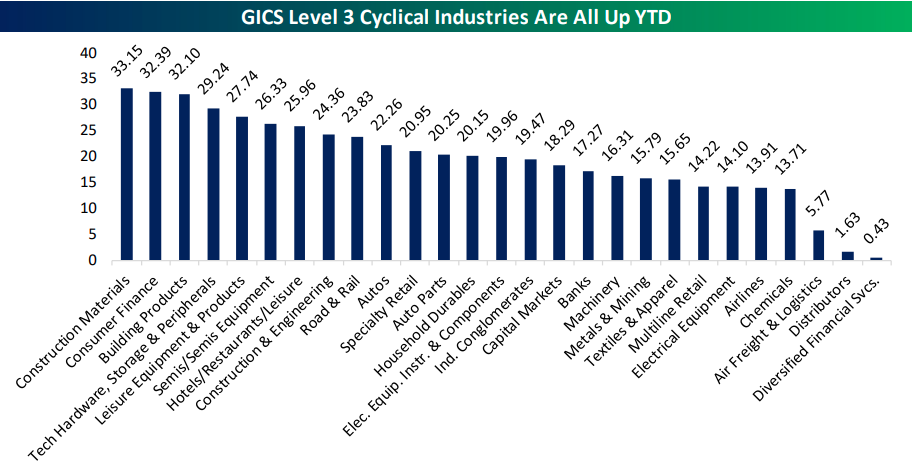
What does it mean and why does it matter as we head through the busiest week for earnings? Since 2004 (full data for all 27 industries starts in that year) there has never been stronger breadth at this part of the calendar. Strong cyclicals breadth is a positive sign for returns the rest of the year. There have been 8 previous years where at least 2/3rds of cyclical industries were up through July 22nd. The market as a whole was up through the end of the year in 7 of those 8 instances.
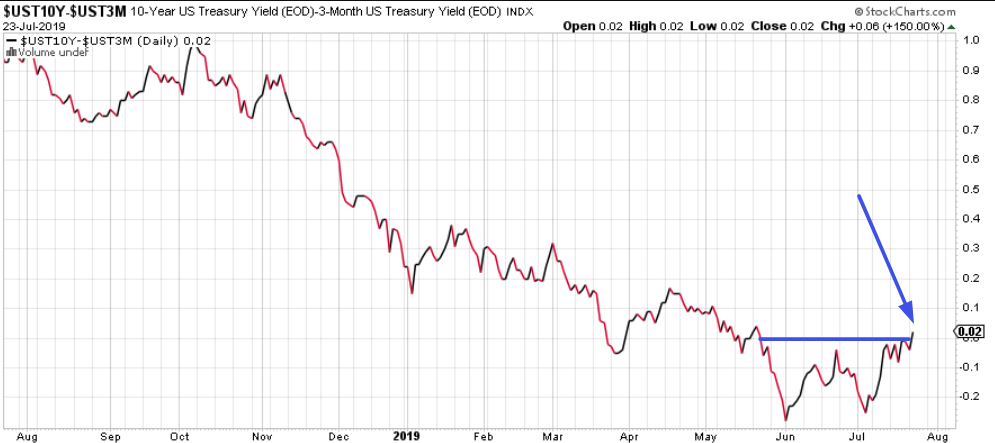
With a more positive sentiment surrounding the Q2 earnings season, that still has some ways to go before completion, investor anxieties may be found easing, even though macro concerns still malign sentiment. One sentiment we are found hearing quite often from investors suggests the yield curve inversion weighs on their bullishness, as the yield curve inverting is dubiously noted to be a recession warning/indicator. With that in mind, the 3-month/10-yr Treasury curve did briefly un-invert for the 2nd time and briefly on Tuesday.
According to a recent study from Troy Bombardia, here’s what happened next to the S&P when the yield curve turned positive for the first time in more than 40 days.
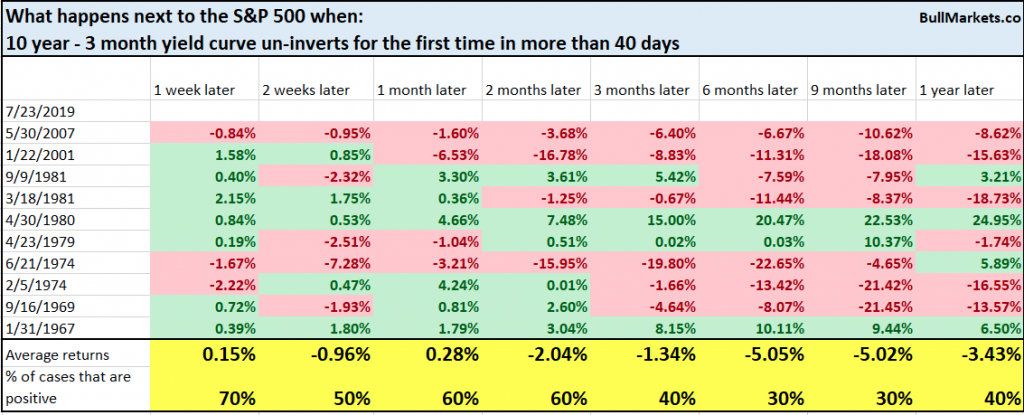
One could argue, based on the table above, the un-inversion of the yield curve is more troubling than the inversion itself. But if we look more closely at the table for analytical review and scrutiny here is what we suggest investors consider more deeply:
- It’s not the yield curve inverting that CAUSES a recession, there’s something within the financial conditions of the economy that prove overtly worrisome and pervade bond market activity.
- In reviewing 2007, one could put most any criterion/variables into a study and it would lead to the inevitable financial crisis that came to be, not just yield curve inversion.
- In 2001, the dot com crash caused the yield curve to invert, not visa versa. The S&P 500 FY results were not a result of the yield curve inversion or the dot com crash, but rather the 9-11 event that drove the economy into a recession. The yield curve inverting could not predict 9-11.
- Prior to 2001, the only qualifying date for this study occurred in 1981 for which most every aspect of the economy and financial system has evolved since then, making all other cases leading up to 1981 that much less comparable for purpose of effective forecasting in the present day.
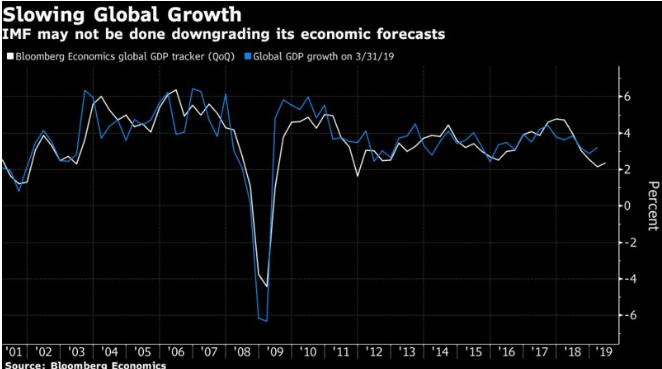
While the yield curve demands investor attention, the global economic situation does continue to also weigh on investor sentiment, as the global trade feuds elongate without a near-term resolution prediction. This sentiment made its way into the latest IMF global economic growth forecast revision. In its quarterly update of its World Economic Outlook, the IMF trimmed the global forecast issued in April by 0.1 percentage point this year and next, with growth expected to hit 3.2 percent in 2019 and 3.5 percent in 2020.
But the report sounded the alarm, saying things could easily go wrong.
“Global growth is sluggish and precarious, but it does not have to be this way because some of this is self-inflicted,” IMF chief economist Gita Gopinath told reporters.
“Dynamism in the global economy is being weighed down by prolonged policy uncertainty as trade tensions remain heightened despite the recent U.S.-China trade truce … and the prospects of a no-deal Brexit have increased,” she said at a briefing in Santiago.
Gopinath warned that the recovery seen next year is “precarious” because “close to 70 percent of the increase relies on an improvement in the growth performance in stressed emerging market and developing economies and is therefore subject to high uncertainty.”
In wrapping up our daily market dispatch for Wednesday, investors will be watching for the release of New home sales data slated to be released at 10:00 a.m. EST. Of course, the economic data will only pail in comparison to the Mueller testimony set to take place in front of the world Wednesday. Regardless of what the testimony bears, it is unlikely to sway equity markets more so than votes ahead of the 2020 Presidential campaign cycle.


