
The number eight is considered to be a lucky number in Chinese and other Asian cultures. Eight is considered a lucky number in Chinese culture because it sounds like the word meaning to generate wealth. Let’s see if the Dow Industrial Average finds a little luck after achieving 8 straight losing trading sessions. On Thursday, the Dow Jones industrial average dropped 196.1 points to 24,461.70. The Dow also posed an 8-day losing streak, its longest since March 2017. The S&P 500 declined 0.6% to 2,749.76 as energy shares fell 1.9 percent.
The Nasdaq composite pulled back 0.9% to 7,712.95, led by declines in Amazon and Alphabet. Amazon shares fell after the Supreme Court ruled that states can force online shoppers to pay sales tax. The Nasdaq reached record highs earlier in the week, but is down 0.4% week to date. Meanwhile, the Dow and S&P 500 are down 2.5% and 1.1%, respectively, for the week.
The latest pullback in equities is largely being blamed on increased or elevated tensions over trade. The U.S. has threatened to impose another $200bn in trade tariffs against China if it fails to negotiate a more balanced and fair trading practice with the United States. But the stance taken by the U.S. is not presently meeting its desired outcome from China.
“China’s commerce ministry accused the United States on Thursday of being “capricious” over bilateral trade issues and warned that the interests of U.S. workers and farmers would ultimately be hurt by Washington’s penchant for brandishing “big sticks”.
While most analysts and veteran investors believe the war of words on trade will ultimately lead to an amicable outcome with little economic impact, the current impact is being felt with compressing equity multiples. David J. Kostin, Goldman’s chief U.S. equity strategist, offered his thoughts on the equity markets in a note to clients.
“The US economy is growing, corporate profits are rising, and stock prices should continue to climb through 2019. However, the appreciation potential will be constrained by tightening monetary policy, a flattening yield curve, rising trade tensions, and the upcoming mid-term Congressional elections.”
Goldman now estimates FY18 to come in at $159 per share, a boost from the $150 original forecast. That implies a 19% increase from 2017, but still lower than that of Thomson Reuters and FactSet estimates. In addition to the profit increase for 2018, Goldman raised its 2019 forecast to $170 from $158, implying 7% growth, and 2020’s from $163 to $178, indicating a 5% earnings gain.
However, Kostin said the rise in profits will not result in a corresponding increase in multiple, or the price investors are willing to pay compared with earnings. The price-to-earnings level will remain at about 17 X. What that basically means is that the S&P 500 would end the year at 2,850, and 3,000 in 2019, or roughly 5% higher than the 2018 target.
“Ongoing policy uncertainty represents a key downside risk for US equity valuations. Many of these events pose limited fundamental risk, but could weigh on risk appetite and valuation.”
Kostin and Goldman’s outlook promotes a rising equity markets on the heels of stronger corporate earnings, but it suggests the risk premium to be curtailed given the macro-uncertainties largely surrounding geopolitical environment. But Goldman supports their bullish and cautiously optimistic market view with the support of corporate buybacks amongst the surge in technology earnings.
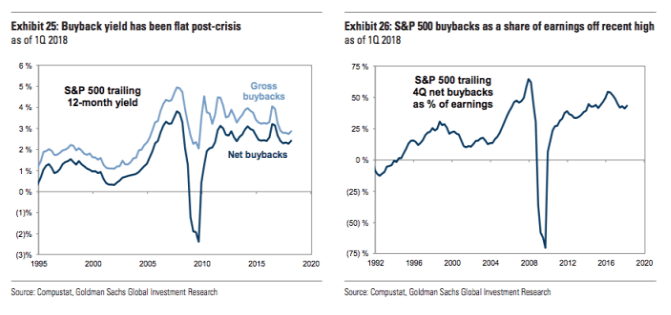
“For much of the post-crisis era, corporations have captured an increasingly large share of profits relative to workers [and] we forecast S&P 500 margins will peak in 2019 but remain roughly flat in 2020 and 2021. Investors have become increasingly focused on whether buybacks are masking the true pace of earnings growth and the S&P 500 buyback yield (i.e., buybacks as a share of market cap) has generally been flat post-crisis.”
Goldman’s outlook is neither overly exuberant or bearish, but rather neutral and as the firm rationalizes the potential for policy errors and a peak in the earnings cycle. The forecast by Goldman somewhat contradicts that of Canaccord Genuity’s Tony Dwyer, whom recently upgraded his price target for the S&P 500 in 2018. Dwyer’s forecast allows for multiple expansion even with the possibility of geopolitical issues abound.
Dwyer on June 4th boosted his estimate for S&P 500 operating earnings per share, leading him to move his 2018 target for the large-cap benchmark to 3,200 from 3,100, which was already one of the most bullish calls on Wall Street. Dwyer said Canaccord raised its 2018 earnings estimate to $160 a share from $155, leading to the 3,200 target based on expectations for a price-to-earnings ratio of 20. That would be more than 11% above the record close of 2,872.87 set on Jan. 26. He also set his target for 2019 at 3,360, based on expectations for a simple nominal growth rate of 5% for operating earnings, which would take them to $168 a share.
“With geopolitical and midterm election worries likely to continue to make for volatile conditions, though such episodes should be viewed as buying opportunities. Throughout this cycle, each intermediate-term correction feels like the fundamental and tactical backdrop is at risk, only to ultimately realize that positive influences that drive our core thesis still exist.”
It’s always a good practice for investors to research and resolve differing analysts views on the markets and the potential for the markets. Bullish, bearish, risk neutral it makes no difference; investors should seek out as much information as possible for which to formulate not only their own opinion, but an overall market thesis. With that being said and after a rather abysmal week for the Dow Jones Industrial Average, equity futures are largely higher in the premarket trade. This comes as the overnight trading action in the Hang Seng largely stabilized with the Shanghai also finishing in positive territory. European equities are also showing signs of stabilizing after selling off yesterday. At the 6:00 a.m. EST hour, the Dow is looking to open higher by nearly 105 points, based on futures.
While recent equity market weakness suggests weakening markets overall, the reality is to the contrary as Bespoke Investment Group’s Paul Hickey suggests. Hickey used a technical indicator called the advance/decline line to show market breadth is positive, a sign that supports expectations of higher stock prices.
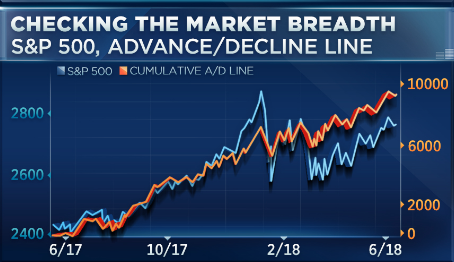
“What you see is that while the S&P 500 remains well off its highs from January, the cumulative A/D line has been making new high after new high. Back since the January peak in the S&P 500, there’s been 14 new highs in the S&P A/D line,” the firm’s co-founder said Wednesday on CNBC’s “Trading Nation.” “That tells us that there’s an underlying trend in the market where investors are acquiring stocks.”
What Hickey also points out is that the equal weighted index supports the notion that it’s “not just the FANG stocks” contributing to the strength in the breadth of the market overall. This is validated when compared to the market cap weighted index, which has performed just as poorly as the equal weighted index.
Friday will hope to find the Dow industrials with better sentiment than over the last 8 trading sessions and in positive territory. After 8th straight daily declines, the index matched a stretch of losses that ended in March 2017. Should the index close lower on Friday, extending the streak to 9 daily losses in a row, it would mark the longest such stretch in just over 40 years. According to the WSJ Market Data Group, the last time the Dow fell for 9 straight trading days was a stretch that ended in February 1978.
Given the composition of Dow stocks and where they derive their company specific sales, the group has been pressured by fears of a trade war erupting. According to FactSet, the Dow derives just 52.8% of its sales from the U.S., meaning more is at risk from rising trade tensions. So let’s see if some of these trade concerns can be put on the backburner for Friday, and offer the Dow a new beginning to end a week of discontent and disconnectedness from its peer indexes.
And with all that being put forth, said, stated and found for wanting rising equity prices near and mid-term, we’ll take a look at what drives equity prices over time in our weekend research report. Oh, it’s earnings folks; earnings drive equity prices over time! Are earnings expected to rise over the next 12 months? Goldman Sachs and Canaccord Genuity believe so!


