It’s not often that the market allows you to hedge before a significant daily move, but that’s exactly what happened on Monday with the market opening flat to higher and before reversing course. In Finom Group’s weekly research report, we mentioned our desire to hedge against a probable move lower for the current reason, mainly due to the following chart of the S&P 500.
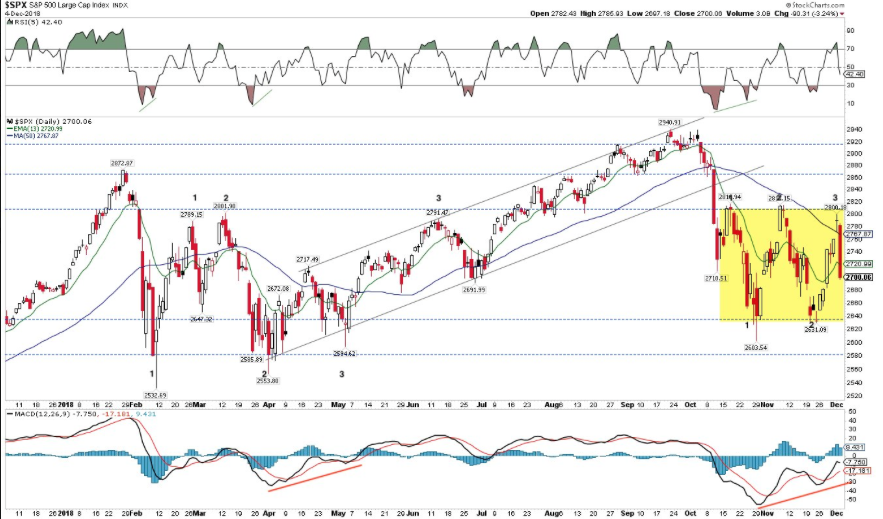
The chart insinuated both a triple short-term top as well as a triple short-term bottom. When finishing a week at the lower end of said box, the box usually breaks to the downside. With what we believe to be an abundance of algorithmic selling aimed at the February closing lows, out short-term thesis identified a greater probability of finding this potential bottom before forming a new base. Additionally and from our research report we offered the following:
** On another note, below 2,600 resides the February-April lows in the 2550-80 area. Be on alert for a fake break, i.e., a break of 2600 that then reverses higher. That’s the kind of move that triggers stops and marks capitulation, something that’s been missing so far during this correction period.
To be very clear, what happened with the market breaking the box on Monday was not a net positive. The February closing low of S&P 500 2,581 was narrowly missed, but it broke the box and entered a potential lower trading range over the near-term. Technically speaking, such breaches to the downside are not signals without their flaws, especially with market volumes being relatively low when compared to the February market sell-off.
As we mentioned atop this daily market dispatch and in our Sunday research report, if one hedged coming into the trading week and further hedged on Monday, those hedges were likely found in the green.
“If you’re not hedged already, there is probably no better time than the present to start considering how to go about hedging your portfolio against risk. We’ll show you why, using simple screen shots in just a moment, but for now let’s briefly discuss the week that was and why we think reducing risk is at the doorstep.”
But on a more interesting point, the market allowed for the opportunity to pullback those hedges/take profits as the S&P 500 reversed its losses and finished higher for the day. As volatility traders, Finom Group hedged its (VXX) short-VOL holdings with long positions in (UVXY). Going long the 1.5X inverse Exchange Traded Fund (UVXY) against the 1X (VXX) inverse Exchange Traded Fund proved a moneymaking hedge with the fortunate intraday moves in the market. Again, the market rarely offers this opportunity. Having said that and considering the breaking of the box, Finom Group will constantly monitor the market for opportunities to position some hedges back into position and until we are found with a more stabilized market that expresses less volatility.
The media continues to push narratives concerning the global economy and geopolitical uncertainties, but even with many of these headwinds either brought to resolution or having minimal impact on domestic corporate earnings, the market has continued a steady decline since October and with light volume. On Monday, headlines broke concerning Qualcomm’s approved injunction of the iPhone in China.

A court in China granted Qualcomm an injunction against Apple iPhone sales. The court has banned the import and sale of nearly all iPhone models in China, according to a statement Monday from Qualcomm. The news sent AAPL shares falling nearly 2.5% in the premarket and at the onset of the trading day. Apple disputed the scope of the ban, saying it only applies to iPhones that run on an older operating system. With Jim Cramer ranting and raving about the headlines, created headlines of his own as he dialed up resources in China to distinguish whether or not iPhones were being sold, Apple filed an appeal to overturn a broad iPhone sales ban in China, the company told CNBC on Monday. Even with the potentially damaging headlines, shares of AAPL reversed course intraday and finish slightly higher on the day.
Although all 3 major indices bounced off their respective lows to finish higher Monday, there remain some negatives for the market, as previously mentioned. An additional negative signal for the market lay within the Financial Select Sector SPDR ETF (XLF).
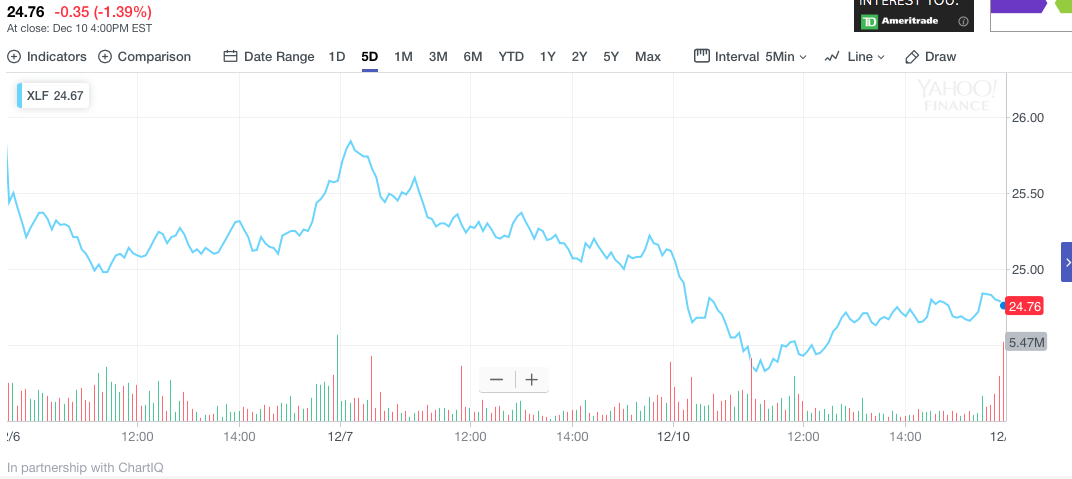
Even with the broad-based market rally Monday, the XLF couldn’t find traction to the upside. After falling nearly $2.50 from its peak on Monday in the previous week, the XLF fell further on Monday and did not participate in the market rebound. The market needs the financials to perform more favorably for the market to find a more sustainable rally through year-end. With the spread/yield curve between 2s and 10s (2-yr. Treasury and 10-yr. Treasury yield) being so flat at just 14 basis points and loan growth proving to slow in the Q3 period, investors have avoided the financial sector. To be fair, the big banks and regional banking institutions have expressed strong revenue and earnings growth in 2018, with still strong guidance being offered. The market has shrugged off favorable performance and guidance in favor of fear of the potential or looming yield curve inversion. Just something to continue to monitor!
Yet another issue for the market on Monday and possibly going forward was the energy sector performance. As it was with the financials, Energy Select Sector SPDR ETF (XLE) failed to follow the broader market’s rebound.
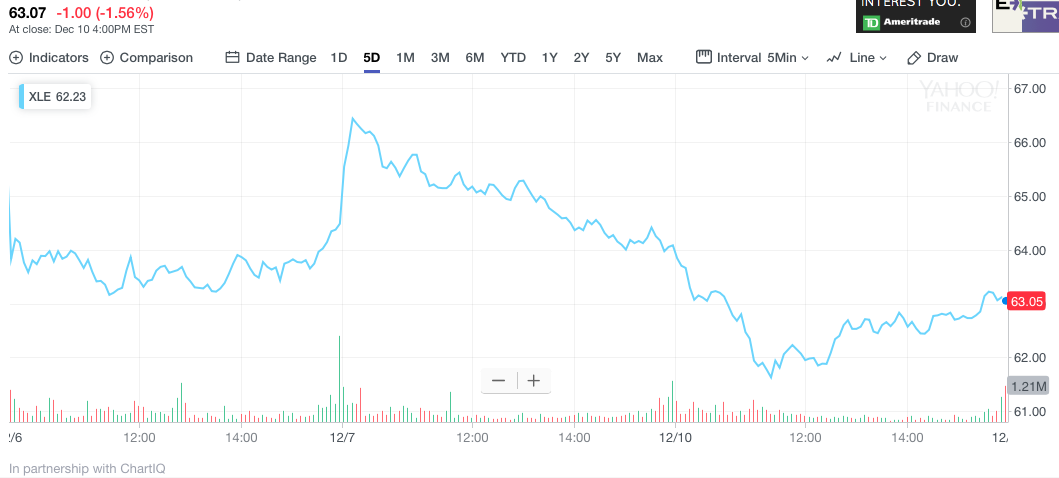
Even with an OPEC cut delivered to speculators late last week, the XLE and crude oil have given up all of its gains from the cut. The market will also need a better performance from the energy sector in order to sustain market levity going forward. With that being said, Craig Johnson, chief market technician at Piper Jaffray, says that after the tumble, the likely path now is up.
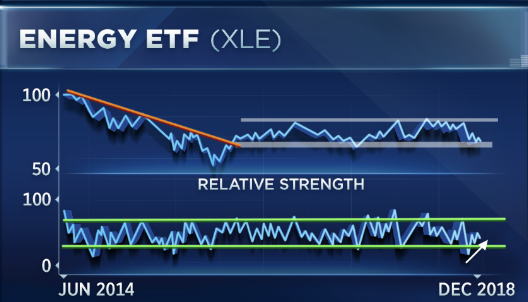
“We’re overweight the energy sector at this point in time for one simple reason: It looks like a lot of the bad news is largely baked in,” Johnson, said on CNBC’s “Trading Nation” on Friday. “When you look at the decline in the oil price that we had seen and when you look at the XLE chart, you saw [the] oil price fall at a much faster pace than what you saw the stocks fall.”
Mark Tepper, founder and president of Strategic Wealth Partners, sees big upside for crude from here.
“With OPEC actually cutting production, we should see oil trade according to demand finally and it could have 20 percent upside from here,” Tepper said on “Trading Nation” on Friday.”
Although the financials and energy sectors underperformed the broader market Monday, tech found favor with all FANG stocks finishing in positive territory. But Monday’s trough in the S&P 500 still demands respect from traders and investors alike.
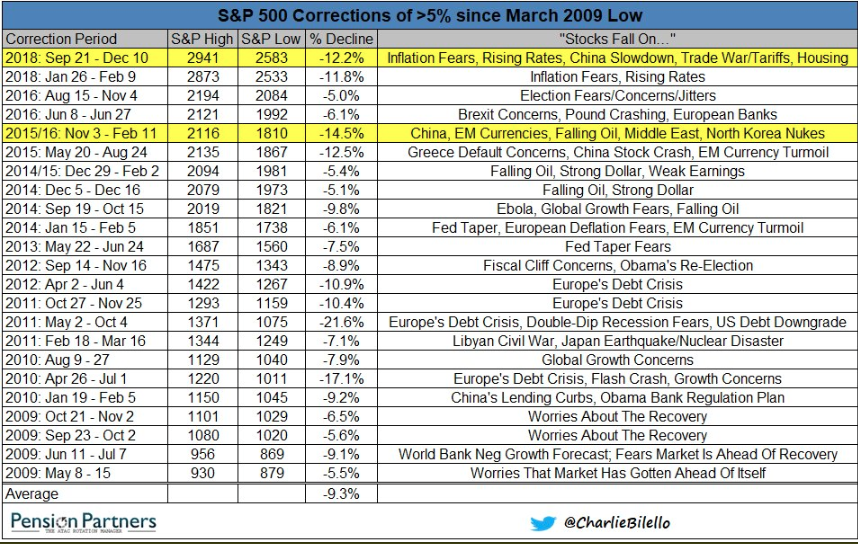
As shown in the table above from Charlie Billelo, at -12.2%, this is now the largest S&P 500 correction since early 2016. Take a look at what was blamed for the correction back then and what is being blamed on the correction of the present. Do some comparisons and analysis on the noted factors. Thinking back to that time period, yes, the bull market was said to have ended and headlines were streaming in daily regarding bond yields, oil prices and corporate debt.
Believe it or not, there’s also more that many will point to as a net negative for the market going forward. Mind you, the market rebounded very close to the February 2,581 closing low and finds equity futures sharply higher on Tuesday. Nonetheless, we can’t deny that the S&P 500 expressed a death cross recently and the MACD(12,26,9) monthly made a bearish cross at the end of November.
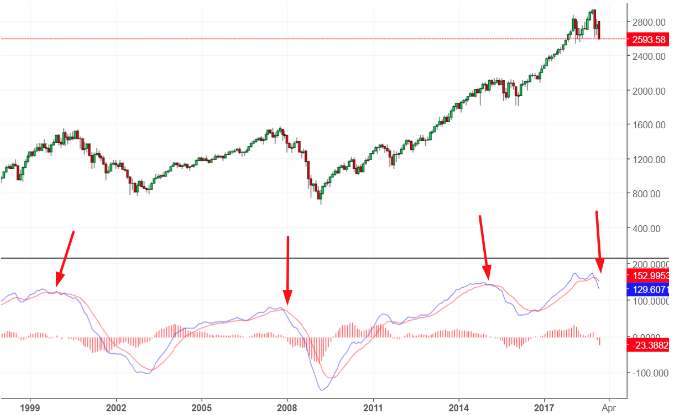
Of course, the permabears use such a technical expression to suggest this is long-term bearish for the stock market. The following historic table suggests otherwise. Always a good idea to do some fact-finding. Here’s what happened next to the S&P 500 when its MACD(12,26,9) monthly histogram crossed below zero. (Table provided by Troy Bombardia)
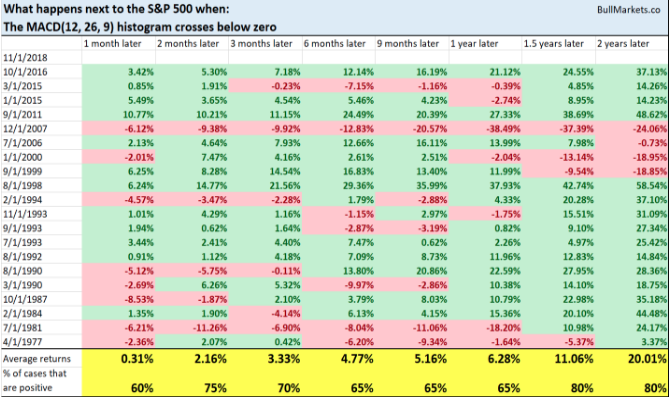
As one can see from the table above, this isn’t consistently bearish for the stock market on any time frame. Average returns are positive across every time frame in the table, including the last time the MACD made a bearish cross in 2016.
With the technical picture pretty much painted to this point, the economic fundamentals remain strong domestically. After the Nonfarm Payrolls report delivered growth of 155,000 jobs in the month of November, Monday’s release of the Job Openings and Labor Turnover survey was delivered. The number of job openings in the U.S. rose slightly in October to just over 7 million and clung close to a record high, signaling that companies are still seeking to hire more workers to keep up with rising sales.
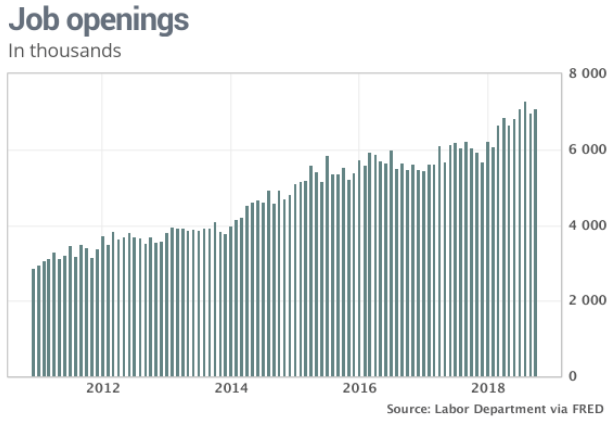
The amount of openings was more than 1 million higher than the same period a year ago, a 16.8% increase. The labor pool, though, continues to shrink, with the current unemployed level down 449,000 from October 2017, a 6.9% decline. November saw another decline, to 5.98 million; JOLTS numbers only extend through October.
The number of hires was also strong at just shy of 6 million, coming within 14,000 of the series high set in August. Hires rose 3.4% over the previous month and 5.2% from the same month a year ago. Those voluntarily leaving jobs, a key indicator of worker confidence, declined by 50,000 to 3.51 million. The quits rate as a percentage of the workforce nudged lower from 2.3%, but it was still higher than the 2.2% of a year ago.
The biggest issue or headwind for the market going forward remains sentiment surrounding corporate earnings for 2019. Analysts are forced to model for potentially more tariff impact and a U.S. Dollar that remains strong. In other words, the uncertainty over trade continues to weigh on market sentiment even through the trade truce announcement. Some details on further talk broke over overnight concerning future trade negotiations between the U.S. and China.
China and the United States discussed the road map for the next stage of their trade talks on Tuesday, during a telephone call between Chinese Vice Premier Liu He and U.S. Treasury Secretary Steven Mnuchin and Trade Representative Robert Lighthizer, according to Reuters. China’s commerce ministry said in a statement Liu had spoken to Mnuchin and Lighthizer on Tuesday morning, Beijing time, on a pre-arranged telephone call. A U.S. Treasury spokesman confirmed that the call with Liu took place.

“Both sides exchanged views on putting into effect the consensus reached by the two countries’ leaders at their meeting, and pushing forward the timetable and roadmap for the next stage of economic and trade consultations work,” the ministry said.”
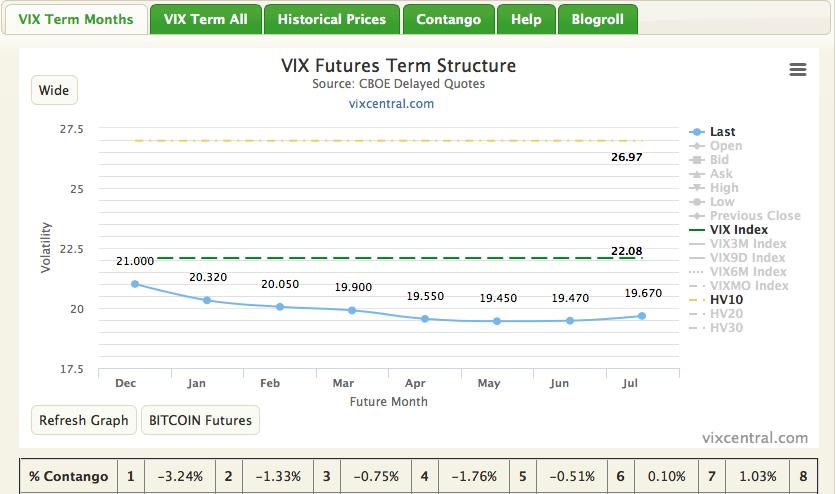
As we round out this daily market dispatch, it’s a good idea to keep in perspective the S&P weekly expected move. For the week, the S&P 500 is expected to move $80. On Monday alone, just Monday, the S&P 500 moved in a range of $64/points. For the remainder of the week, the S&P 500 is expected to move some $63. See what we’re getting at here. It’s a traders market right now and found with great intraday swings and volatility. Remember, when they say expect more volatility, that doesn’t always mean expect a higher and sustained higher VIX. We witnessed strong volatility in the market yesterday, but when it was all said and done the VIX actually finished lower.
The VIX is a measure of implied volatility over a 30-day period. But if we look at historic volatility over the last 10 days, otherwise known as HV10/realized volatility (yellow line indicating HV10 = 26.97%), we see the actual market daily movement is much higher than implied volatility or the VIX (green line indicating VIX =22.08%). So you will hear it time and time again, the market is volatile, but this doesn’t mean the VIX is wildly higher and remaining elevated.