
With bearish sentiment kicking off the first week of September trading turning to positive sentiment on Tuesday, U.S. equity futures are attempting to carry forward positive momentum on Wednesday. All three major averages finished higher on Tuesday with the tech-heavy Nasdaq proving to be the outperformer, gaining .61% or 48 points ahead of the heavily anticipated Apple Inc. (AAPL) event.

According to numerous reports, Apple will announce 3 new iPhones based on the iPhone X design on Wednesday. Starting this week, it is widely expected that Apple will unveil all iPhones that will look like the iPhone X. According to a June report obtained by MacRumors and written by Ming-Chi Kuo, an analyst at TF International Securities who is almost always accurate with his Apple gadget predictions, the successor to the iPhone X will start between $800 and $900 instead of $1,000. There will also be a larger version of the phone, the so-called iPhone Xs Max, that will start between $900 and $1,000. And the new entry-level model with a cheaper, 6.1-inch LCD screen, will cost between $600 and $700.
With Apple largely expected to capture the bulk of investor attention on Wednesday, economic data remains a more broad focus for the week. Yesterday’s reading on small business sentiment demonstrated support for a continued strengthening of the U.S. economy. The optimism of small-business owners in the U.S. rose in August to an all-time high and their chief lobbying group credits tax cuts and a regulatory rollback by the Trump White House.
The National Federation of Independent Business said its small-business optimism index rose 0.9 points to a 108.8, eclipsing the previous record of 108 some 35 years ago. The figures are seasonally adjusted.
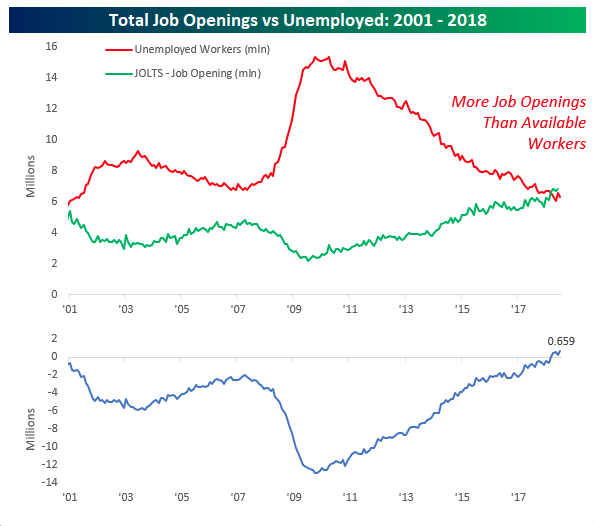
In addition to the record level highs in the NFIB report on Tuesday, the JOLTS survey also supported continued strength in the labor market. Job Openings and Labor Turnover Survey from the BLS came in significantly stronger than expected as the number of job openings came in at 6.939 million versus estimates for a level of 6.675 million. In each of the JOLTS reports covering 2018 so far, all seven of them have come in better than expected and beating expectations by an average of 219K!
The chart below, from Bespoke Investment Group, updates the spread between the number of Job openings in the U.S. to the number of unemployed. Back in March the number of job openings exceeded the number of unemployed for the first time since the data for the JOLTS survey begins in 2001. Since then, the gap between job openings and available workers has continued to widen. Through July, which is the most recent available data for the JOLTS survey, the gap stood at a record 659K.
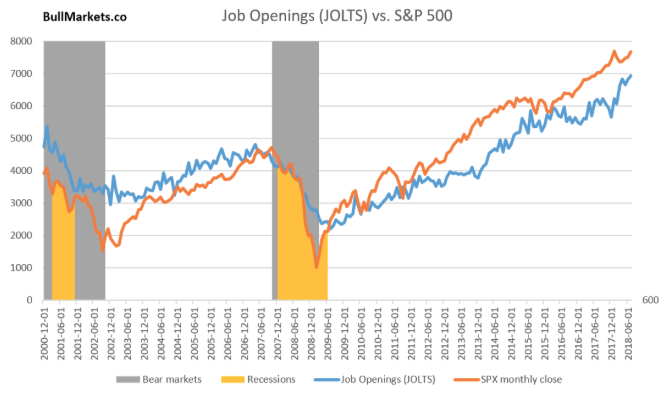
In terms of leading economic indicators, the JOLTS survey provides such evidence that the economy is doing very well. JOLTS is also a leading indicator for the stock market. This chart demonstrates the positive correlation between JOLTS and the S&P 500. In other words, as the JOLTS survey goes, the S&P 500 historically follows.
The strong economic data releases yesterday provided U.S. equities further divergence from emerging market equity trends. In terms of equity market performance, the U.S. is seemingly on an island of its own. Additionally, U.S. equity market volatility, as gauged by the VIX, has come down sharply in the first couple of trading sessions this week. The VIX enters Wednesday’s trading session just above 13 and after beginning the week just under 15. Coming into the trading week, all signs were pointing to a further increase in volatility:
- VVIX at or above 100
- SKEW in the 145-150 range
- Spike in CBOE Index put/call ratio
- VIX breaks above lower Bollinger band
Within Finom Group’s latest research report, we denoted the following CoT net VIX Futures interest, which denoted the increase in short positions for the week. (From Hedgeopia.com)

Moreover, the graphic depicted above from hedgopia.com offered the following analysis concerning the VIX.
“On the weekly chart, the VIX (14.88) just developed a potentially bullish crossover. The last time there was one such crossover was in January.”
As stated previously, all signs were pointing to a further increase in volatility to come. Having said that, twice now, it’s always crucial to understand the fundamental fact that technical analysis on the VIX or VIX complex is generally found futile and an erroneous exercise. So while we want to recognize what the VIX chart is expressing, we don’t want to draw future conclusions as investors. Here is what we offered to our subscribers in the weekly research report in this regard, below:
“In general, charting volatility to any degree or with efficacy is not advisable. The VIX and the volatility complex of instruments/tools are derivatives. Some are derivatives to the 9th degree. As such they are dependent and reactionary, thus making technical analysis less effective than traditional asset classes and/or markets. Nonetheless, seasonality factors and historical median readings can be useful with respect to near-term probability forecasting.”
In addition to the verbiage noted above, the VIX can be defined as a stochastic process. To put a trend line, fib or oscillator on a stochastic process… well how does one find logic in such an exercise we ask? Every time we see someone using technical anlaysis on the VIX or VIX-ETPs on Twitter or some social media sight it reminds us of the movie The Sandlot. “You’re killing me Smalls!” Moving on…
Certainly volatility rises and falls over time, but the relatively low levels of volatility that have persisted over the last couple of years has been somewhat disconcerting and baffling to many investors. What we suggest to the masses is one of the primary causations underlying the relatively low levels of median volatility since 2016 has been correlations. The following chart defines and validates this notion as it depicts the average sectors 30-day correlation with the S&P 500.
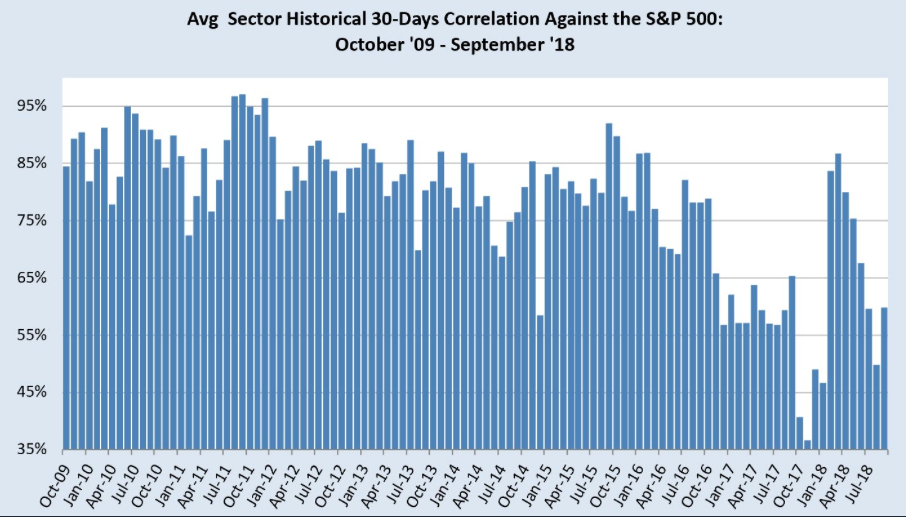
From 2009 to 2016, correlations were stubbornly high. Market sectors within the broader market index moved in a more correlated fashion. But since 2016, correlations have broken down to a more significant degree. Low correlations tend to underline lower levels of volatility. What we can also see in the chart above is that when sectors more closely correlate to the broader index, volatility can rise to extremes and in a rapid fashion, as expressed during the February-March market correction.
In closing out this discussion on market volatility and the VIX, investors are usually best found following the dynamics of market volatility, but avoiding predicting such market volatility near-term. Anything and everything can ignite market volatility, but the only certainty about market volatility is that complacency actually reigns supreme in the market place over time. As such, for volatility traders, successfully trading the volatility complex is best done through careful position sizing, macro-economic understandings and thesis as well as trend analysis. In a recent YouTube video, Finom Group’s Seth Golden discusses the importance of position sizing as a means of successful investing and trading.
Concluding our daily market dispatch, the news keeps getting better and better with regards to the U.S. economy and it has been flowing through to corporate earnings. With U.S. equity markets at or near all-time record level highs, this might beg to question, “Who is left to buy U.S. equities?” Knowing that corporate buybacks are slated to eclipse $1trn (estimated by Goldman Sachs) in 2018, who else is left? The answer, historically, may prove to be foreign buyers.
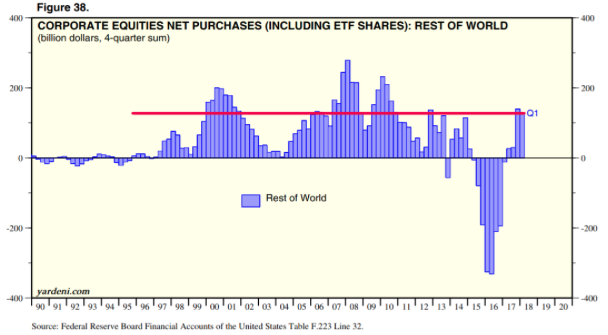
As anyone can see from the chart above (from Troy Bombardia of bullmarkets.co), foreign buyers are just starting to turn bullish on the U.S. stock market. Fitting with our previous statement that the U.S. equity market has greatly diverged from emerging equity market performance since May, one can deduce that foreign buyers will increase their net U.S. equity market exposure for the balance of 2018. Additionally, the chart may also depict that foreign buyer euphoria is a contrarian indicator, and one that suggests a U.S. equity market peak or nearing its peak, if 1999 and 2008 are any guide.


