
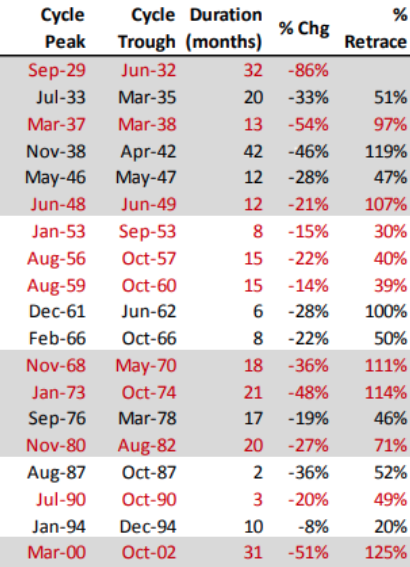
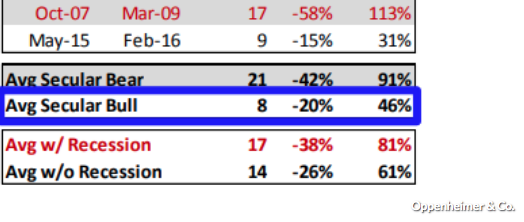
Is optimism creeping back into the market? Are investors signaling that it is “all clear”? Look, I get it, the market has rallied significantly off of the S&P (500) daily closing low of 2,351 and now looks to be stabilizing. Gaining stability, however, is a process that usually consisted of a low-level retest. Take a look at the following table from Odd Stats. Since we are not currently in a recession and a recession isn’t forecast for the 2019 calendar year by any sell-side analysts, the table is inclusive of years where the market expressed material drawdowns outside of a recession.
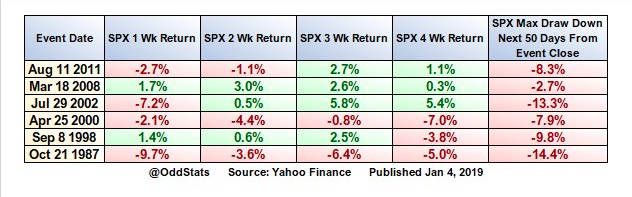
The table above highlights the non-recession post crash environments (1987, 1998, 2011), and how ultimately each has seen big reflex thrust, but with a retest. We don’t know how the 2018 technical bear market will resolve itself, but in each of the previous non-recessionary bear markets, a retest of the lows occurred before a march higher. Human nature is such that it relies on historic precedence for modeling of the future. It’s why at Finom Group we continue to suggest that investors should not be of the opinion that the market is “all clear”.
I know, you’re probably sick of seeing the following chart that we characterized as the S&P 500 Box, but it’s important to keep this chart in mind as we move forward in early 2019.
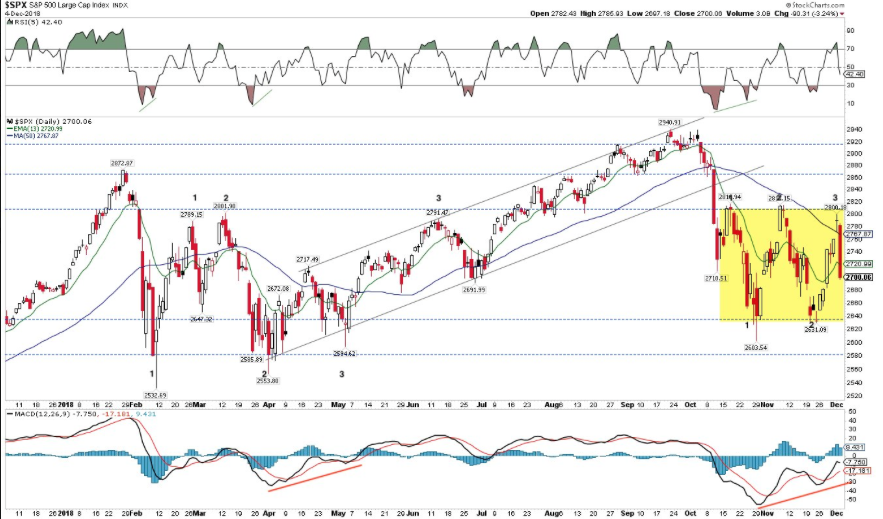
Given the S&P 500 Box chart above we have suggested that the probability for the S&P 500 to gravitate upward to the 2,575-2,581 levels before retesting the event lows was rather high. The range/level noted was the prior February intraday closing low and where the market broke down and outside of the box in December 2018. This range/level now serves as a gravity point for the S&P 500 and RESISTANCE! That’s simply how technical market moves work and are defined. Regardless of the economic and corporate fundamentals, the technical-driven bear market also requires technical attention and due diligence. With that being said we now offer an updated S&P 500 Box chart as follows:
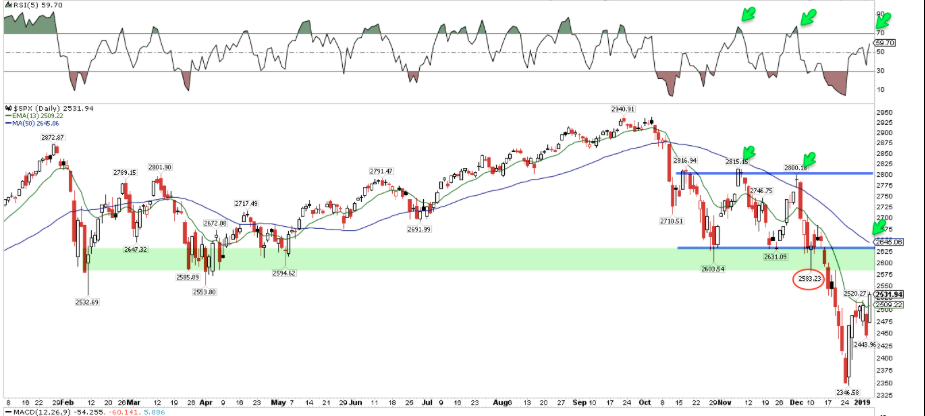
As we discussed in December 2018, SPX appeared to be basing within a two-month range (blue lines in the chart). An intraday reversal on December 10 (red circle) looked like a false break of support (which we also warned about), but this reversal failed 4 days later and SPX crashed down 10% over the next 7 days.
The area of that failure is now (2,575-2,581) 1% above Monday’s close (green highlight). The 50-dma (blue MA) is at the top of this range; it’s also served as resistance since the September high (green arrows). There are a lot of fund/portfolio manager eyes on this chart; expectations are that prior support becomes resistance and the rally at least stalls (or outright fails) there. Again, this is simply the way technical bear markets run their course, as they also ultimately resolve to move higher over time and before achieving new all-time highs. Should a retest of the lows not take place and the resistance level depicted become breached with a SPX close above that level on a weekly basis that move higher would be very noteworthy for bulls and extremely worrisome for bears.
The reality is that when SPX drops 15-20% or more (as it had in 2018), it has a strong tendency to retest those lows in the weeks/months ahead. Since 1980, there have been at least 10 of these examples and all but 2 formed a base at the low (i.e., a low retest) before moving higher (green arrow-2009).

The two exceptions (1982 and 2009) are hard to compare to the present state of SPX as SPX fell 27% and 57% over 21 and 17 months, respectively. Momentum normally takes time to be reversed and the current drop is barely 3 months old.
I don’t desire to dwell on the 2018 induced bear market, trust me, but the fact is we are still contending with it and the more we rationalize it’s characteristics the better we can potentially position going forward. 2018 will likely be remembered as a year like 1987 and 1962: These years also had large drops outside the context of an economic recession. These are once in 20-30 year outcomes (from JPM).

Moreover, we’ve discussed periodically how poor market sentiment has become and has been through the technical bear market. Citigroup’s panic/euphoria model dropped into panic territory this week.
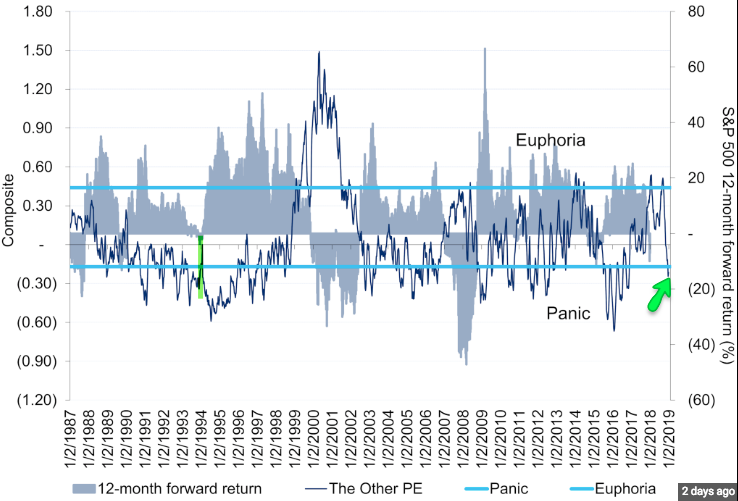
This may not mean much about near term market moves, but 12-month forward returns for SPX average +18% with a 97% win rate.
Again, while I don’t necessarily think the market is out of the “woods” yet, we may very well have witnessed the capitulatory move investors desired to see on Christmas Eve 2018. Why do I suggest this? The VIX spiked to 36 on Christmas Eve, matching the spikes near the lows in SPX that followed every major sell off since 2010.
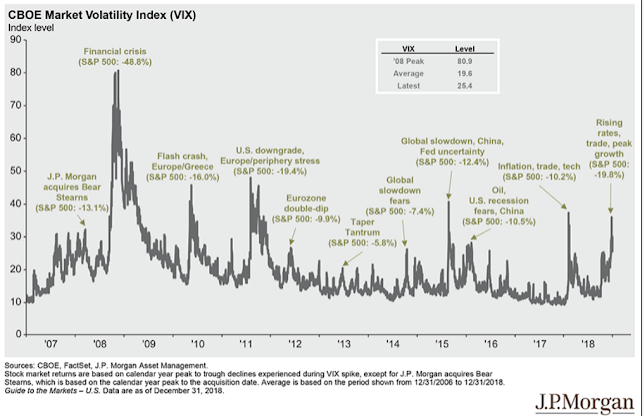
The VIX achieving 35-36 on Christmas Eve signaled heightened or extreme levels of fear in the market that didn’t show in October or November of 2018, even as the market continued lower. So while I remain of the opinion that an SPX-low retest is highly probable, that is more a procedural expected move that is unlikely to result with the same degree of volatility achieved in late December 2018.
In Finom Group’s weekly research reports we denote a few headwinds for the market in 2019. One such headwind we recently outlined was the strength of the U.S. Dollar Index (DXY). The strength of the USD pressures sales and earnings from U.S. corporations doing business and or capturing sales overseas. The USD comp itself is a tough comp for these multinationals in the first half of 2019 as shown in the chart below of the USD.
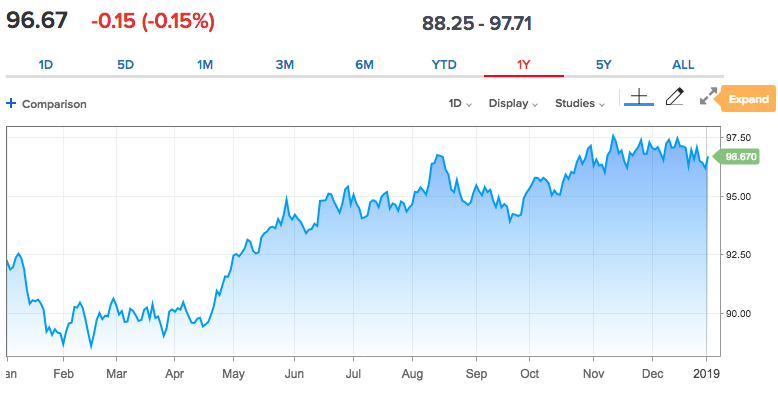
In the first half of 2018, the USD Index was averaging roughly $90, significantly lower than where the USD enters the first half of 2019. With the Fed now on the sidelines, pausing rate hikes, this has the potential to put downward pressure on the USD Index.
Goldman Sachs believes as Finom Group believes that the USD has on the verge of collapsing soon enough. On January 6, 2019, the firm offered a short call on the USD Index.
“Combined with net softer U.S. data for December, we think a more data-dependent Fed creates space for further dollar downside,” the strategists led by Zach Pandl wrote. “We are therefore recommending short DXY (or a basket with approximately these weights), with an initial target of 93.0 and stop of 97.5.”
The USD Index hasn’t been below 93, Goldman’s target level, since May 2018, as the currency strengthened on the back of robust American economic data. The stop of 97.5 is the peak level it reached in November 2018.
With the current technical bear market looking to recapture basic correction territory near-term, I can’t help but to identify the forward 12-month PE ratio as being historically cheap.
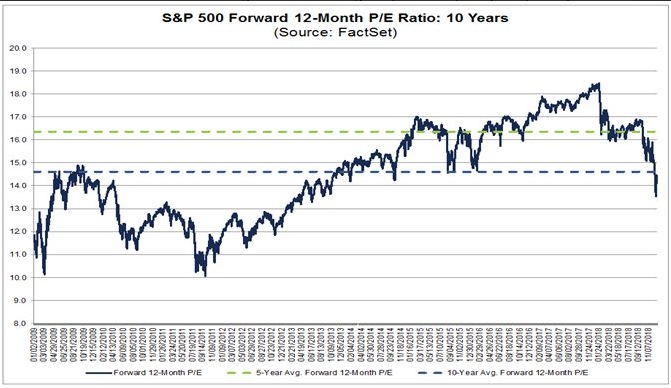
The forward 12-month P/E ratio for the S&P 500 is 14.1. This P/E ratio is below the 5-year average (16.4) and below the 10-year average (14.6), cheap! Yes it can always get cheaper, but in keeping with the mantra that we are not in an economic recession and not finding sell-side analysts with negative corporate earnings growth forecasts, what’s the probability of the market getting that much cheaper? You decide!
I want investors and traders to understand and plan for the potential of the market to do both, retest the lows and trend higher in the months to come. Both are dependent on corporate earnings and macro-policy. Earnings season will kick-off next week and investors will have greater clarity on FY19 earnings forecasts come that time. But even if we plan for flat YOY earnings growth, as mentioned previously, the market is historically cheap. As such, the probability is still in favor of a modest move higher for the markets in the mid-term. Ask yourself whether or not you have cash available to trade for such an outcome.
Moreover, many sell-side analysts insist the market will trend higher in 2019, as it is extremely rare for the S&P 500 to express 2 consecutive years of declines. The last time the S&P was down two or more consecutive years on a total return basis (including dividends) was way back in 2000 to 2003, when it was down three consecutive years, according to data from the Stern School at NYU. There have only been four instances since 1929 when the S&P declined two or more years in a row. In the worst case, the S&P was down four consecutive years, from 1929 to 1932. The S&P was down three consecutive years twice: 1939 to 1941, and 2000 to 2002. It was down two consecutive years only once: 1973 and 1974. It’s clear from the statistical occurrences of consecutive annual declines that the modern era doesn’t find the probability of another S&P 500 down year very likely.
Here is what some analysts are advising and/or suggesting to clients about the path forward for the S&P 500:
“We expect a bear market rally to develop over the coming weeks, and we expect a new bull market to develop over the coming months to quarters,” said Ari Wald, a technical analyst at Oppenheimer & Co.”
Wald believes the recent spate of weakness is the cyclical bear market waking up in the midst of a secular bull market and suggested that the selling pressure will soon work itself out.
Tobias Levkovich, chief U.S. equity strategist at Citi, who trimmed his 2019 target for the S&P 500 to 2,850 from 3,000, believes this is a good time to jump back into the market, in part given that stocks have the potential to rise 16% over the next 12 months on valuations alone.
“Nothing is guaranteed, but the data suggest that we should be buying into current weakness,” he said.”
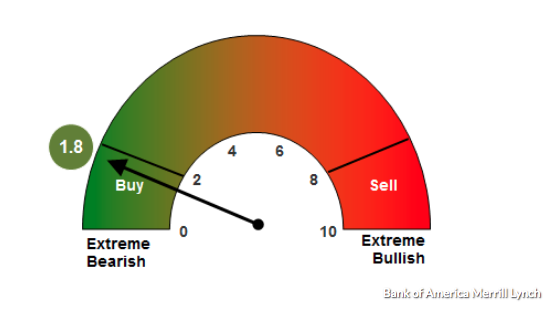
Bank of America Merrill Lynch suggests that besides valuation, there are other reasons to regain bullish sentiment on the market. The bank’s Bull & Bear Indicator fell to 1.8, indicating “extreme bear,” triggering a buy signal for risky assets like stocks for the first time since June 2016 when markets were battered by Brexit headlines.
Additionally, Tommy Ricketts, investment strategist at Bank of America Merrill Lynch, suggests that when central banks, especially the Federal Reserve, are unnerved enough by the financial markets to abandon their hawkish stance, this tends to be a positive for markets.
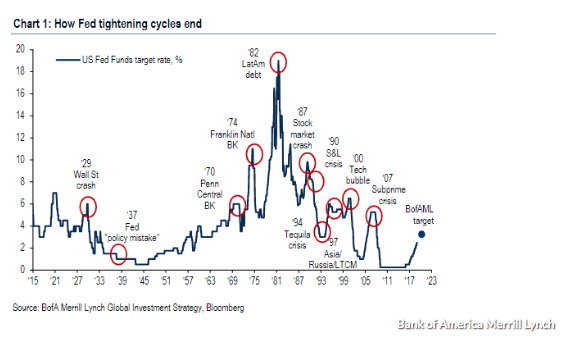
As we already know, the Fed has tilted in favor of pausing rate hikes near-term, turning increasingly dovish from its previous hawkish stance.
“Markets require a dovish pause at the very least,” he said.
Closing out this morning’s daily market dispatch I hope investors and traders maintain a watchful eye and plan for the probabilities of the market performance near and mid-term. The market remains with risk-off sentiment and characteristics, but is leaning toward risk-neutrality. Given the aforementioned depiction of the market, trading with defined risk takes precedence in my opinion. Please post your comments to this daily market dispatch in the space provided below. Additionally, our latest State of the Market video will be available Friday, hosted and presented by Wayne Nelson.
Join finomgroup.com today and subscribe to our daily/weekly trade alerts which posted a 90%+ success hit rate in 2018. Below is a screen shot of some of our latest trade alerts that performed fashionably profitable.


