
Markets can prove difficult to understand, making it that much more difficult to create a strategy for extrapolating profits over time. With the election front of mind for a great many market participants, Finom Group encourages investors to recognize that no matter the outcome of the election, an outcome will be achieved. More importantly, however, no matter the outcome of the election, markets are likely to move higher over the next Presidential term if not any Presidential term/s. The following chart also encourages investors to recognize that the winner of the election, be it Trump or Biden, is of little consequence.
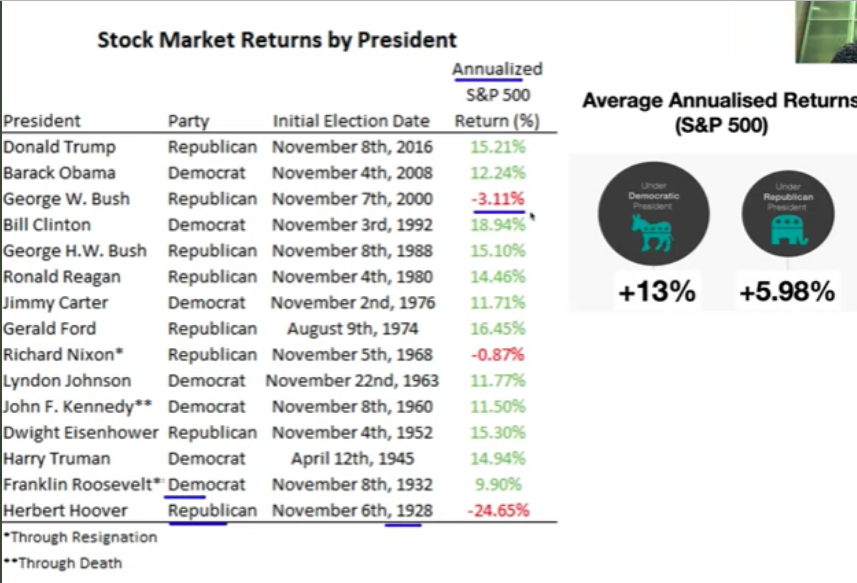
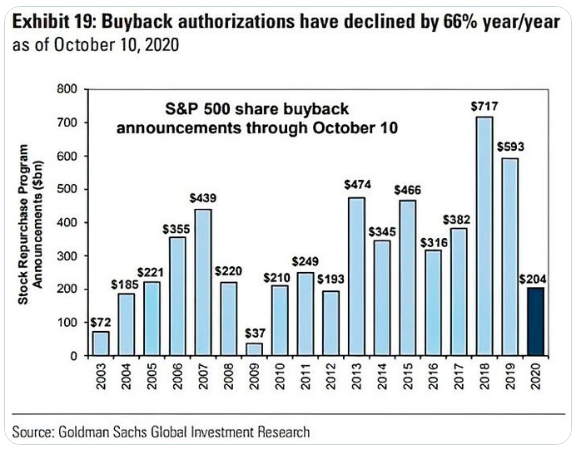
More often than not, in fact 70%+ of the time, markets move higher and it has little-nothing to do with who is the President. Presidents come and go while the market largely moves higher as a byproduct of liquidity and earnings increasing. “Yea but earnings are only increasing because companies are buying back their own stock”. That’s an often used “push back” as to why earnings have moved higher in past years, but that certainly isn’t the case in 2020. Buyback authorizations have declined by 66% year-over-year in 2020. This comes after a rather robust 2-year period that kicked-off with the 2017 Tax Act, which effectively lowered the corporate tax rate from 28% to 21 percent.
Don’t let the reason/s for which earnings are rising be the enemy of your portfolio. Recognize that the market isn’t always going to do what you want it to do, let alone how you want it to be done. Most importantly, don’t lose sight of how the market historically performs, as it proposes the probabilities of how it will likely perform in the future. That is what the following chart outlines with stronger details:
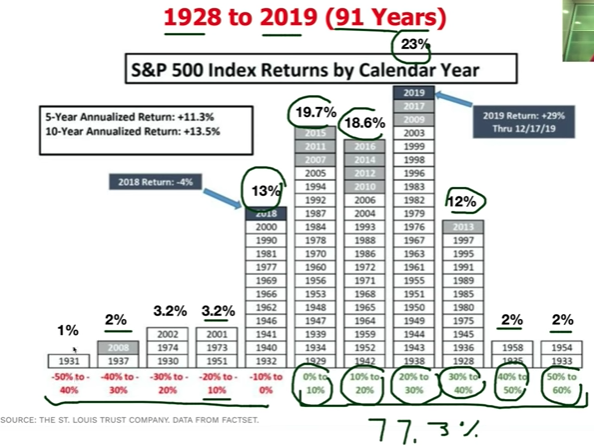
What we see from the chart is highlighted in green at the bottom and with the numerical percentage rate of 77.3 percent. It represents the percentage of time that the market is higher on an annual basis. That’s the side of the market’s trade you want to align for and with a longer time horizon in focus. The longer the duration your capital is aligned with the historic trend of markets, the greater your probabilities of extrapolating a profit. Additionally, although the market does have setbacks, don’t let those setbacks discourage your investing participation or allow it to alter your understanding of the long-term probabilities.
2020 is one of those rare years where the market has declined more than 30% intra-year, but not YoY thus far. Such as market decline, as shown in the chart above, has only occurred 2% of all market years since 1928. That is how anomalistic 2020 has been. Already, however, much of that which had been lost in the February to March time frame has been recaptured and then some. This is a byproduct of the cooperation between monetary and fiscal policies that were implemented and have been ongoing since March.
As the Q4 2020 period carries forward in 2020, markets will grapple with a litany of issues, headlines, unprecedented circumstances and uncertainties. Some will position for the probability to profit from any near-term weakness in the market while others will lean into weakness with the intent to “buy the dip”. The latter exercise tends to be the more disciplined and advantaged participation as it demands little more than capital allocation at lesser valuations. To profit from downside, entries and exit prices are critical, especially in markets with low liquidity.
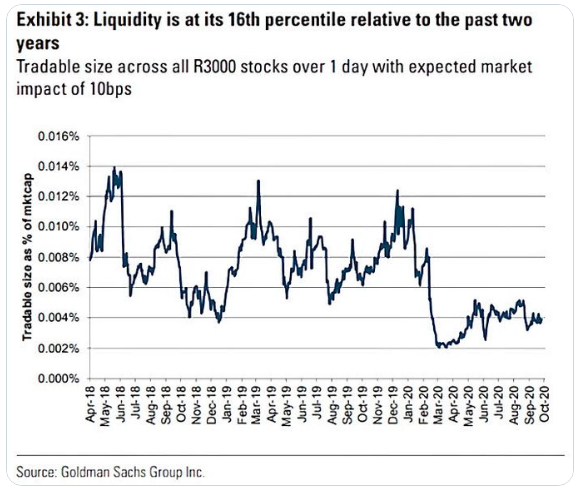
U.S. equity market liquidity has improved since the March lows, but remains below average levels and as indicated in the Goldman Sachs’ chart above. We could easily take this chart back 10 years and it would identify the same path of market liquidity, from the upper left-hand corner to the lower right-hand corner. Liquidity has been persistently downward trending for nearly a decade.
Also, as we travel through the 4th quarter, earnings season will hit its heaviest earnings release period of the calendar this coming trading week. It will be highlighted by mega-cap Information Technology sector earnings releases. Some of the biggest companies in the market will report on Thursday, after the closing bell.

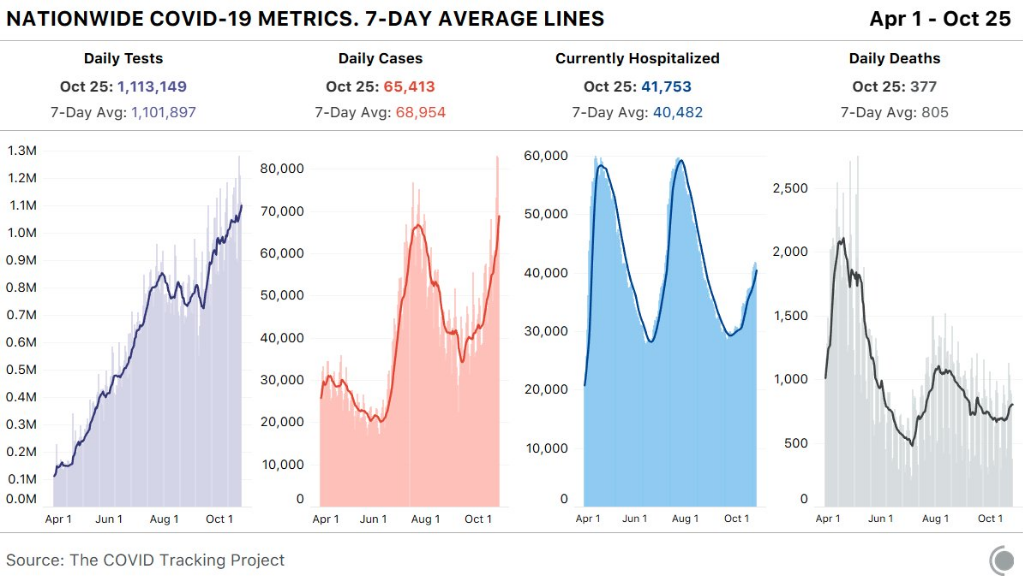
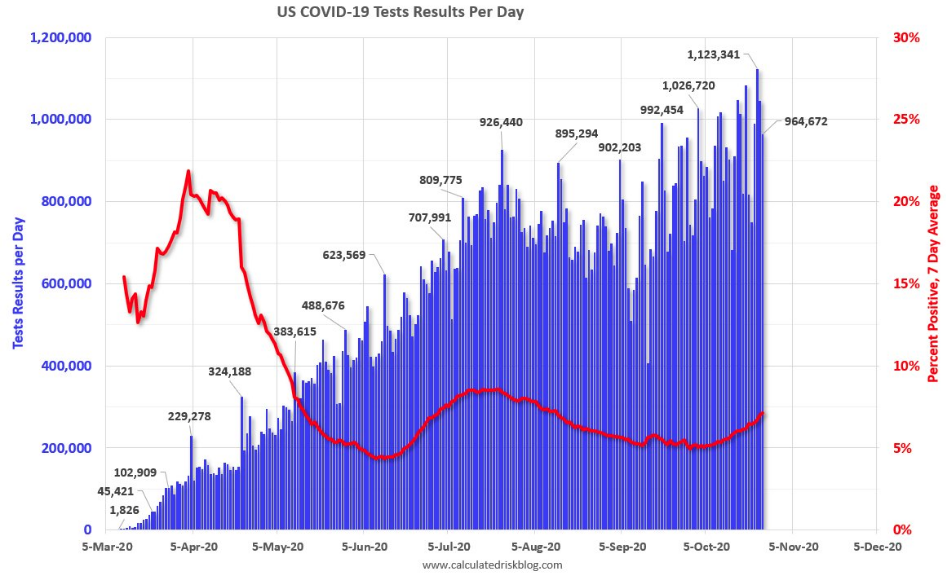
Although the graphic offers Alphabet (GOOGL) as reporting after the closing bell Monday, most brokerage platforms show the company will report results on Thursday with the likes of Amazon (AMZN), Apple (AAPL) and Facebook (FB). The Information Technology sector will be in focus this week and will play a significant role in the markets’ trajectory both near and longer-term. Such an earnings schedule probably couldn’t come at a more pressing time as the sector has weakened of late and the near-term macro-market focus proves a headwind for investor sentiment. Aside from earnings season, investors have become increasingly concerned with the election and the Covid-19 infection rate that has ticked higher in Europe and the United States. More on that in a bit…
As noted above, the relative strength of the Information Technology sector has proven relatively weaker than the overall market of late. The tweet, with Information Technology sector ETF (XLK) relative to the S&P 500 index ETF (SPY) does identify Techs relative weakness.
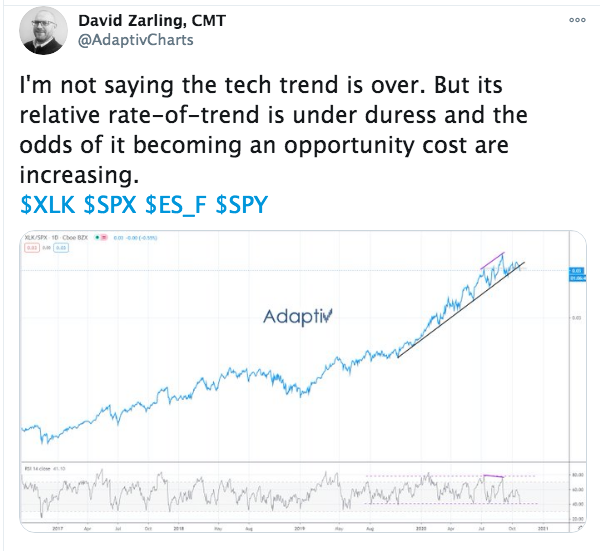
As we can see from the chart, the ratio has broken below a key, longer-term trend line of support. Is this bearish in and of itself? It may seem that way at initial glance, but another question that better identifies the chart analysis would be, “Is it bullish?” I think few would suggest it is bullish, and as such a game plan can be created based on that premise.
There are a few points we’d like to make about the chart above and the long-term trend strength of the Information Technology sector. We’ll start with the first and probably most important point of them all:
Technology Sector (XLK) Point #1
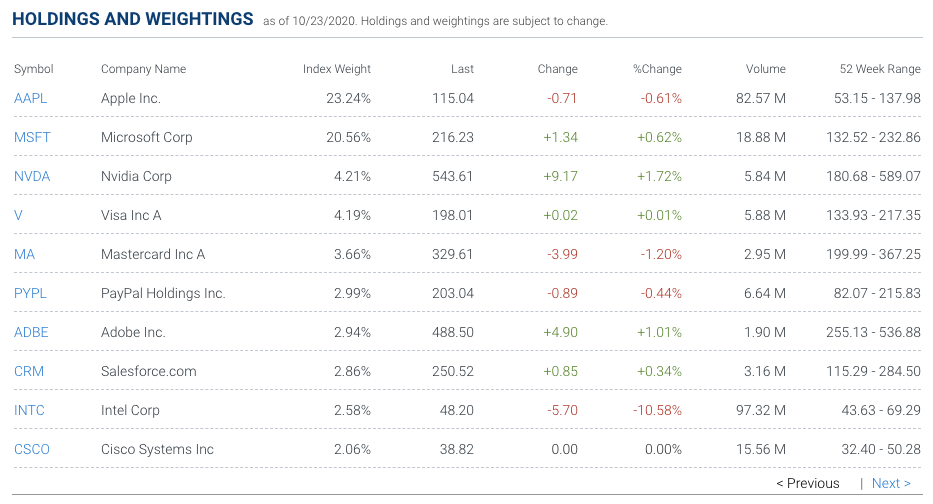
- Almost 44% of the XLK consists of just 2 stocks, Microsoft (MSFT) and Apple.
As Microsoft and Apple go, the cap-weight XLK is likely to follow and unless a majority of the XLK is able to offset the 2 most heavily weighted stocks in the sector ETF. That is rarely the case, from a probabilities perspective, but it is a possibility most obviously. As an investor, it often proves beneficial to lean into the greatest probability.
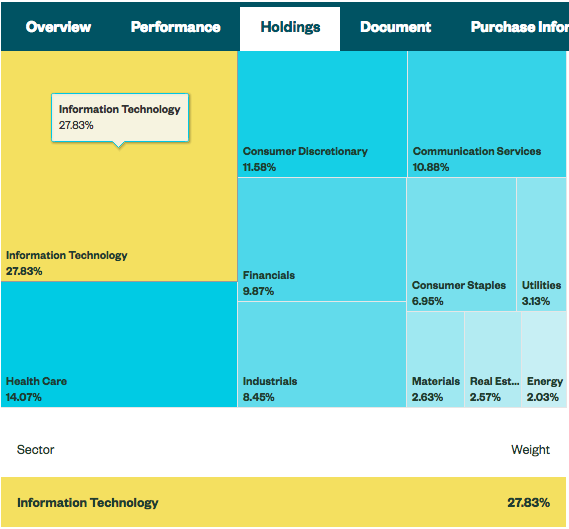
Moreover, given the cap-weighting heavily influences the strength or weakness of the Information Technology sector’s overall performance, the good news is that Microsoft and Apple have both enjoyed strong earnings performances for many years in the past. Many investors conflate the likes of GOOGL, FB and AMZN within the Information Technology sector although they are not in the sector. Nonetheless and given that this week all the aforementioned companies will report results, we are forced to recognize that their combined market cap will move the S&P 500 (SPX). These 5 companies named and combined now account for 17.4% of the total market capitalization of the S&P 500 index, which is only behind the Technology sector’s weight in the index at 28% and above the other 15 sectors, including Finance at ~10 percent.
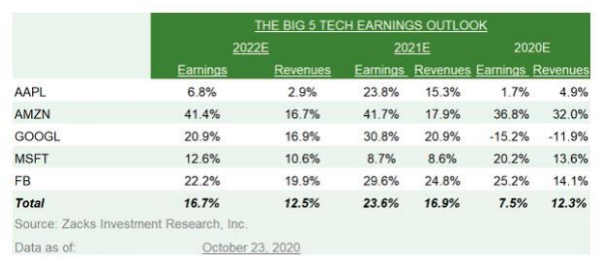
As these 5 stocks go, it is likely the market will follow. But again, the earnings strength of the “Big 5” is rather strong and projected to sustain its strength, as shown in the table below:
So what if the Information Technology sector wasn’t “cap-weighted”? What are those smaller market-cap companies doing, how have they been performing? That is where the good news resides for investors. We can analyze the Information Technology sector through an equal-weight lens just the same; there is an ETF that does just that very thing. The Invesco Equal-Weight Technology Sector ETF (RYT) allows investors to neutralize the size of a company within the Information Technology sector to better understand the strength or weakness of the whole sector, without the impact of market cap.
The following chart compares the 1-month RYT (blue) vs. the XLK (green). As we can see from the chart, RYT has outperformed XLK by more than 2 percentage points during the time period.
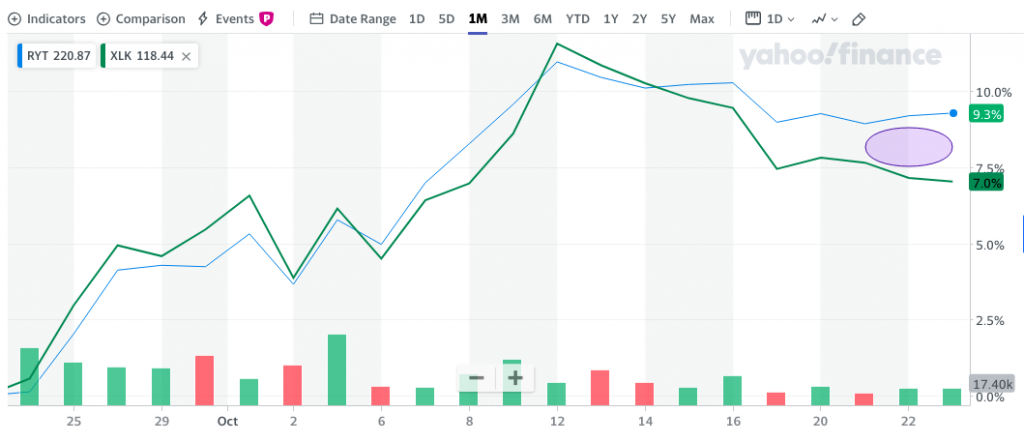
If you’re bullish on the market, this is the ideal long-term depiction of the Information Technology sector that one desires to see most. It doesn’t tell us whether or not the equal-weight RYT will hold the market up if the XLK falters under a scenario where the mega-cap tech names falter, but it does give an investor confidence that should weakness prevail, it will likely find dip buyers with a longer-term horizon. Those investors recognize that the confluence of macro-market issues and uncertainties will be resolved. By that time, the mega-caps that may have faltered will also have likely bottomed and uncertainties have found greater clarity. Again, this is why buying the dip is an easier participation for investors to act upon near-term. By the time the market has clarity for investors to react to, it has already made its move. Investors are better served by focusing more on the next 50-60% move and less on the next 10-15% move.
Another key segment or sub-sector of the Technology sector is the Semiconductor segment. Semis, as they are otherwise known, have enjoyed a strong year-to-date performance. Despite the turbulent, overall market performance in 2020, Semis have appreciated by over 27 percent. We’ll use the iShares PHLX Semiconductor ETF (SOXX) to represent the Semis performance below and with the 20-DMA (pink line) highlighted:
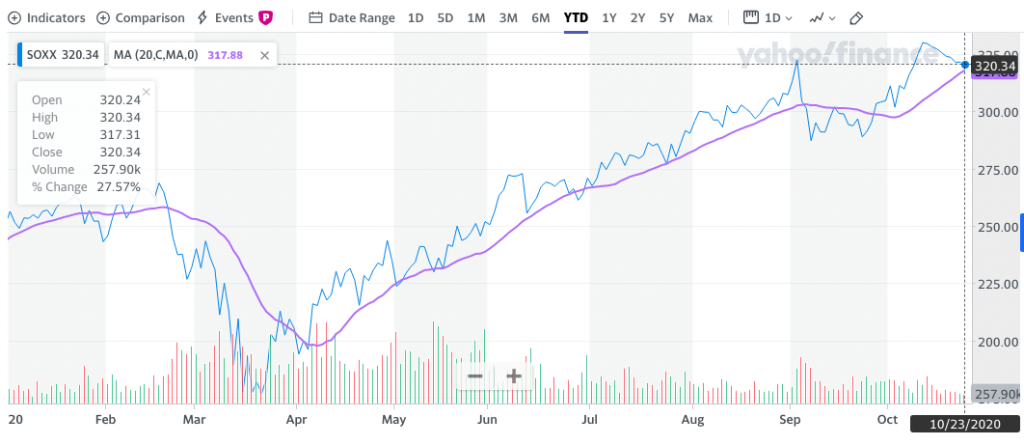
It’s clear from the chart above of the SOXX that the previous, inverse head-n-shoulders technical pattern resolved with new all-time highs for the ETF. Longer-term, that is good news. Nonetheless we can certainly recognize that the 20-DMA remains a level of support and magnet for the index near-term for which it may prove to weaken and seek for support. While that may sound bearish, longer-term we will view the weakness as opportunity as outlined in the historic data.
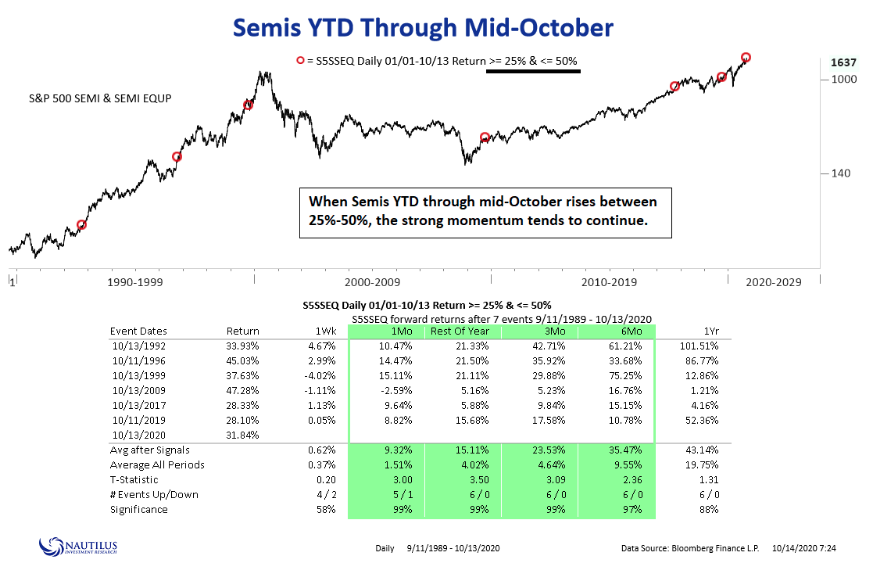
- The Semiconductor index is currently up more than 27% year-to-date. Nautilus Research points out that when this index has been up 25-50% through mid-October, the strong momentum has typically pushed the index even higher in the following months.
- **Looking at the forward returns following the past 6 occurrences, the index was higher 1-month, 3-months, and 6-months later, 99% of the time. Boom, mic drop!!
- The only exception was in 2009 when it fell 2.59% one month after the signal.
- As you might know, Semiconductors are found in almost every electronic device. Due to their widespread use, this industry group is a leading indicator for both the stock market and the economy.
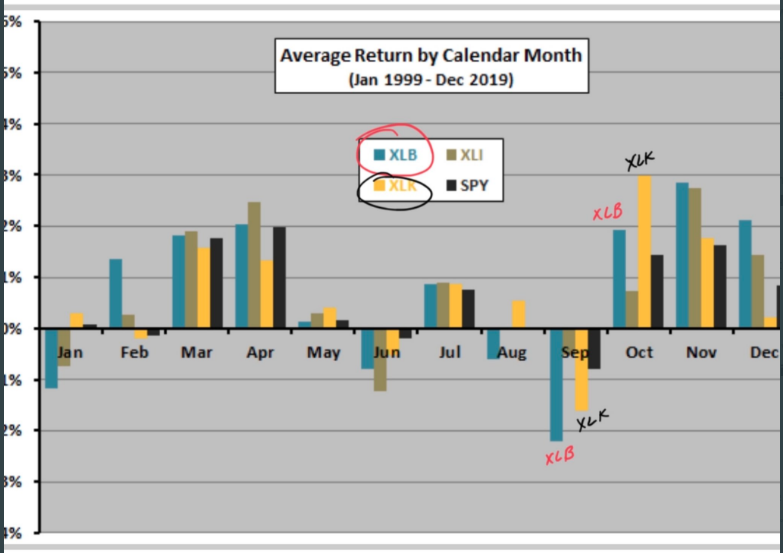
- If you planted tech seeds in Sept. (bought the dip)…October harvest is the best month for technology stocks.
- The chart above identifies the average return for various sectors within the S&P 500 including the Technology sector ETF (XLK).
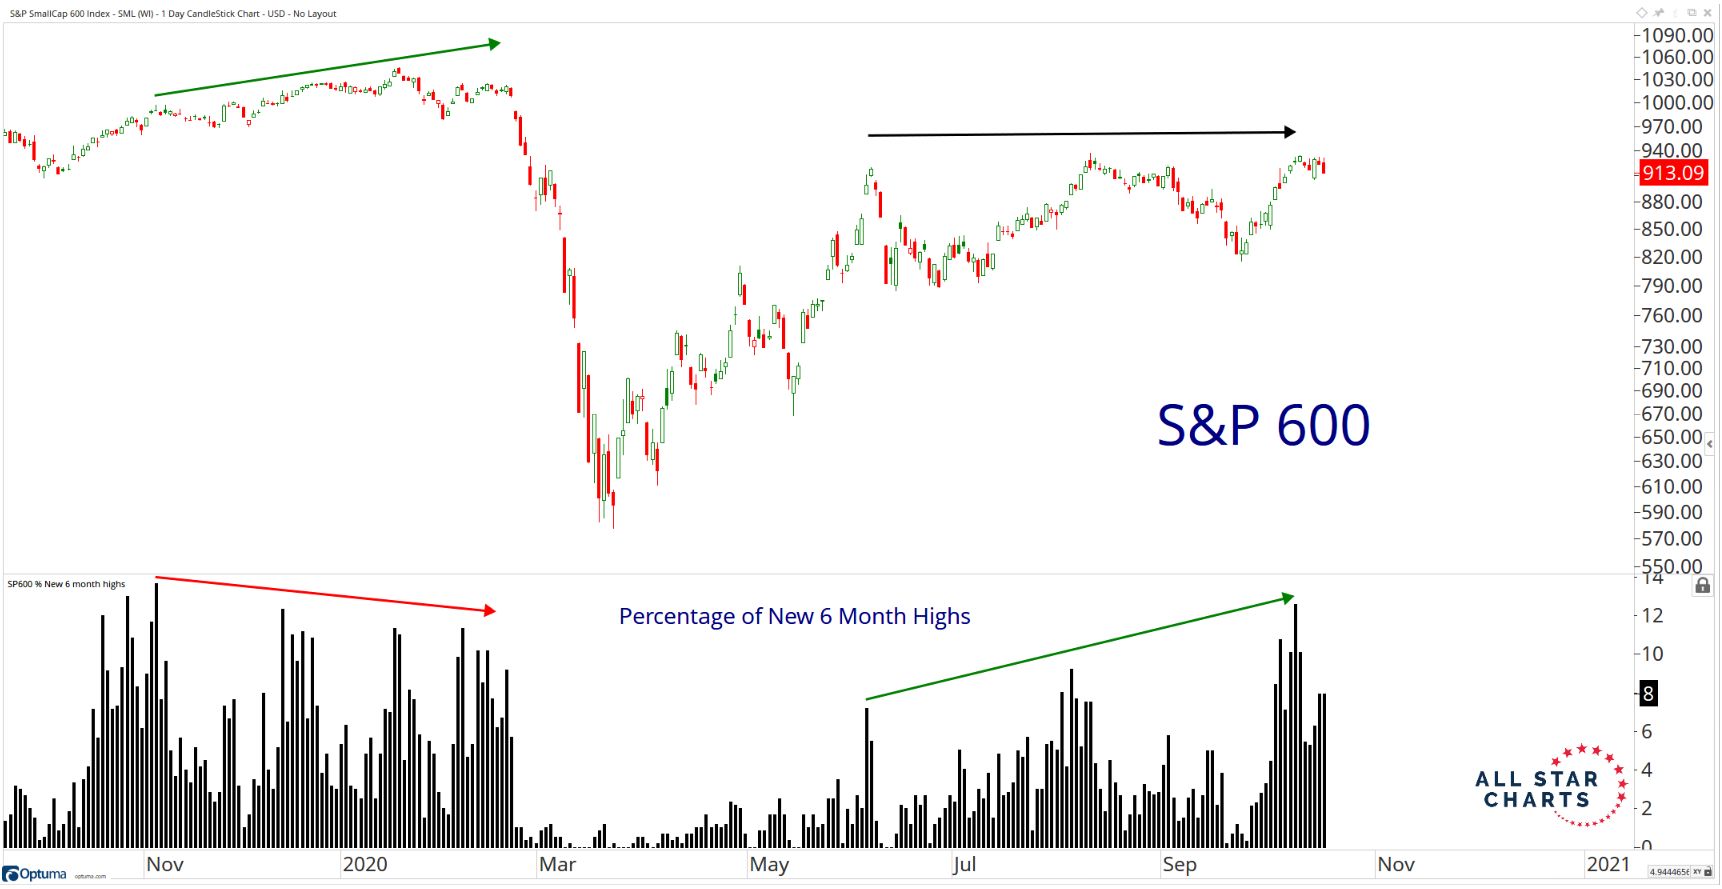
As the Information Technology sector goes, for the foreseeable future and given its weighting within the S&P 500, more than likely the market will travel a similar path. There are many breadth indicators that have identified strength underlying the major averages/indices. Of late we are now seeing an expansion in new highs over the shorter-term as well. Considering the indexes have moved more or less sideways since June, we have to view this increasing participation as a positive. (All Star Charts)
In a heavy earnings week that will highlight Information Technology and Communication Services earnings, investors should game plan for potential stocks to buy on the dip. We committed to this exercise as the Financial sector earnings season unfolded and to the benefit of Finom Group Premium and MasterMind Option members by trading long shares of J.P. Morgan (JPM).
The daily candlestick chart of the Regional Banking ETF (KRE) over the past year is highlighted below.
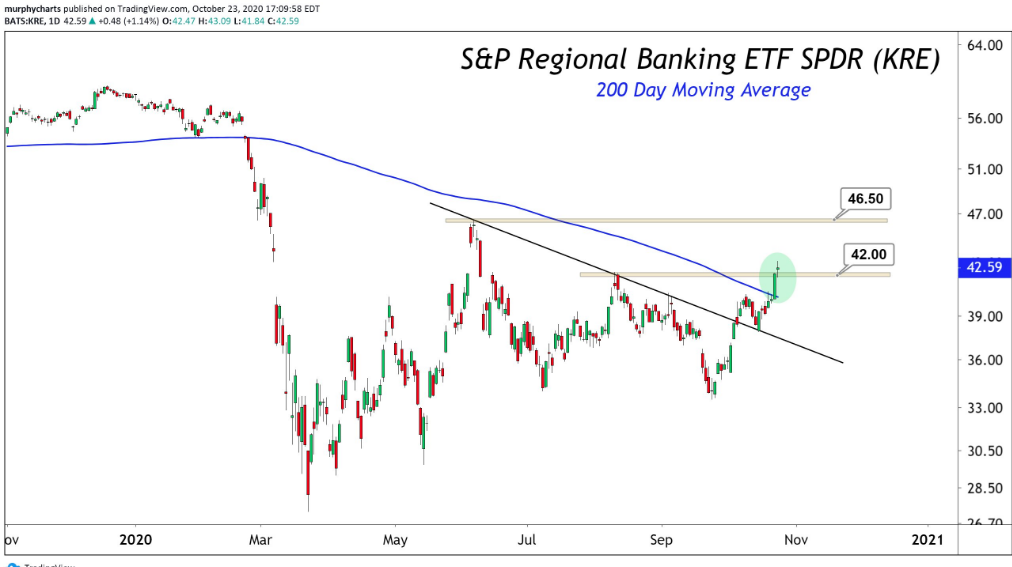
Regional Banks broke above their 200-day moving average this week for the first time since the crash began in February. $KRE is up more than 19% in October, putting it on track for its best month since 2016. This is happening as the US 10yr-2yr Treasury yield spread steepens to its widest level in more than two years. This yield spread is often thought of as a barometer for Banks’ profitability. Regional Banks make the majority of their profits from lending. When the 10yr-2yr yield spread steepens, Banks can make more money on loans. If the spread continues to steepen, it would be a tailwind for Regional Banks. Any improvements from Regional Banks would be a bullish development for risk assets and the broader market.
We don’t dismiss the probability that earnings for Q3 have largely been baked into the S&P 500 price thus far, as the index is a forward discounting mechanism. Having said that, we do find guidance to be a critical dissemination during the Q3 earnings season as it will lend itself toward discounting future earnings potential.
In Finom Group’s Research Report 2 weeks ago, we offered the following commentary on earnings expectations for the Q3 2020 period.
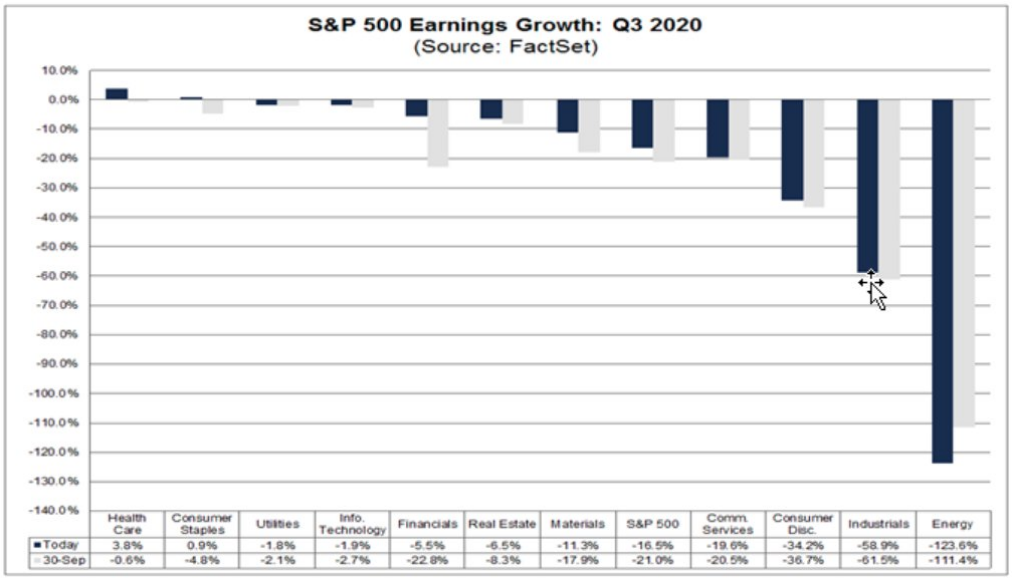
“With big-money center banks and financials releasing Q3 2020 earnings and sales results this past week, S&P 500 EPS tracking/estimates have risen substantially for the quarter. I’ve modeled the beats to be quite strong and they are coming in as assumed. Additionally, I did anticipate more upward revisions by the tracking firms and still anticipate Q3 2020 EPS to fall roughly ~15% when all results are delivered for the quarter. If anything, I may be found with an upward revision to my Q3 2020 EPS model after the week of October 30. Now, let’s recall FactSet’s most recent tracking for Q3 2020 EPS as offered in last week’s Research Report:
“FactSet has further, positively revised its EPS tracking model to reflect a YoY decline in earnings in Q3 2020 of (-20.5%). We still believe the estimates are too low and will continue to be revised higher as the earnings season period kicks into high gear this coming week.“
Since then, FactSet has upwardly revised their Q3 2020 EPS model to reflect a YoY decline of -16.5 percent. That’s 4% in just 2 weeks folks, that’s a huge revision!
Consensus analysts’ estimates for 2020 and FY2021 EPS have also moved higher in recent weeks. Yardeni Research blogs the updated results intermittently and as they are found revised by analysts throughout the year. Consensus analysts’ estimates still find FY2021 EPS below that of 2019 (the all-time highs EPS level of $168.38), but Finom Group is of the opinion the estimates will prove too low, as history suggests.
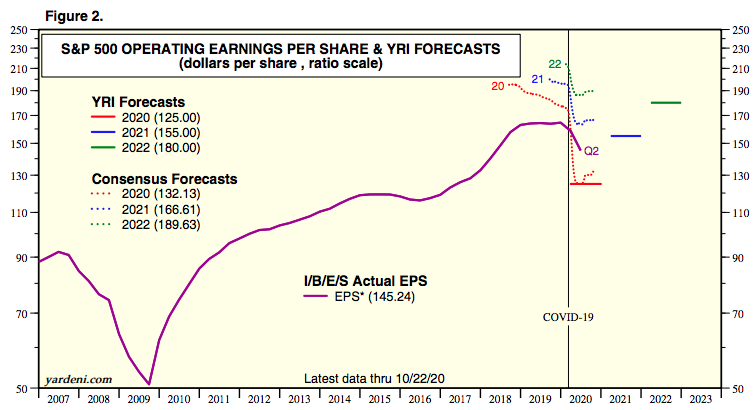
Finom Group is of the opinion that FY2021 EPS is likely to see strong growth and with EPS in the range of $172-$176 per share, barring any exogenous events. This is the big picture takeaway for investors with longer-term time horizons and a carefully highlighted warning for the permabears whom are likely more focused on the epidemic headlines and the election. Don’t get us wrong, the epidemic headlines are concerning, but unlikely sustained for negative sentiment even as the infection and hospitalization rates continue to rise.
With only 8 days left until the election and earnings season kicking into a higher gear, stay vigilant and keep your eyes on the prize, which lay well beyond 2020 investors. Well beyond 2020. Formulate your game plan… and execute!


