
To reiterate, the VIX is above 16 and as such investors/traders should expect to see 1% daily moves in the S&P 500 (SPX)… at least. Tuesday found equities moving down, then up, then back down and closing at the lows of the trading session into the closing bell. So what changed on Tuesday to find equities under pressure once again and in contrast to the risk-on appetite Monday? We could look at bond yields to suggest that bond yield pressures have been tightly corresponding with equity pressure of late, but there was a significant equity market reversal in the early morning, with all 3 major averages in the green at one point? It doesn’t seem fitting, with this in mind to determine then that yields drove equity risk appetite, or lack thereof. So what was it we ask again?
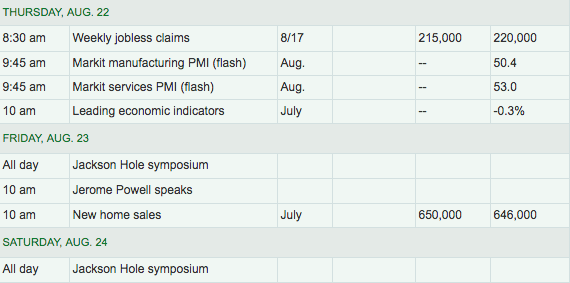
The reality is that nothing really changed from Monday to Tuesday. The market is still in this “in between” period. There’s just enough risk appetite out there from keeping the S&P 500 from moving significantly lower, but there remains just enough fear to keep the S&P 500 from moving up and through its 50-DMA. So in between it is as they say and as investors await the FOMC minutes on Wednesday, New Home sales on Friday and the all-too heavily anticipated Jackson Hole summit. Speaking of Jackson Hole, here are some fun facts and sentiment on the event as offered from Morgan Stanley recently:
- Since 2003, the 2s10s UST yield curve flattened 75% of the time during the three days (Tues-Thurs) leading up to the Fed Chair’s speech on Friday at Jackson Hole
- The 10-yr. Treasury yield moves were mixed with a slight negative skew, up 43% of the time (this number decreases to 32% when looking back to 1995, however).
- Small caps outperformed large caps (SPX-RTY spread negative) 67% of the time.
- S&P 500 absolute moves are a toss-up, up 50% of the time with average returns of +34bps and median of -2bps.
- HYG was up 80% of the time (calculated using its full history back to 2007).
While the investing community awaits Jackson Hole headlines, which are surely to present themselves over the weekend, nothing has changed in the way of the economic data and expectations of rate cuts. We deduce that there are 3 primary drivers of the markets presently: the state of the trade war, central bank accommodative policies and sentiment. While I would like to presume that economic data is also to be included as a market driver, to a goodly degree, central bank policies will supersede the data given it’s proposed nature of course correcting the data, so…
The market is awaiting a catalyst to move higher or lower, such a catalyst could present itself by way of the Jackson Hole event, but we wouldn’t be holding our breadth. Ultimately, the market will find its truest trend from earnings. Earnings will once again surpass analysts expectations on the whole for the reporting season. A total of 468 S&P 500 firms, or 94% of the S&P 500 index have reported so far this quarter. If all remaining companies report earnings in line with estimates, EPS will be up 3.0% from last year’s Q2. On July 1st, a 0.3% increase was expected. Speaking of earnings season…
While the whole of the Q2 2019 earnings results will produce another modest YoY growth performance, the retail sector is proving no less bifurcated than past quarters and years. The department store retailers continue to underperform despite the great many initiatives enacted. No matter what they do within their 4-wall operating businesses, the ever growing shift toward e-commerce shopping continues to syphon business out of traditional brick and mortar department store sales. Kohl’s (KSS) was just the latest to report results that highlight the aforementioned trend and the toll it continues to take on the Kohl’s business.
Here’s how Kohl’s performed compared with what Wall Street was expecting, according to Refinitiv consensus estimates:
- Adjusted earnings per share: $1.55, vs. $1.53 estimated
- Net sales: $4.43 billion, vs. $4.2 billion estimated
- Same store sales: down 2.9%, vs. down 2.5% estimated
So a slight earnings beat, slight sales beat and same-store-sales (SSS) miss that is bigger than most would appreciate seeing. But where it really gets ugly is when we look at the YoY revenue picture. At $4.43bn in sales, this marks a 3% decline vs. the same period a year ago. Additionally, it’s not just that sales are falling, but they are falling with gross margins contracting meaningfully again. Even worse, Kohl’s expects gross margins to contract further in the fiscal year. This was the same picture painted by Macy’s (M) only a week ago, as the peer retailer lowered its fully year guidance.
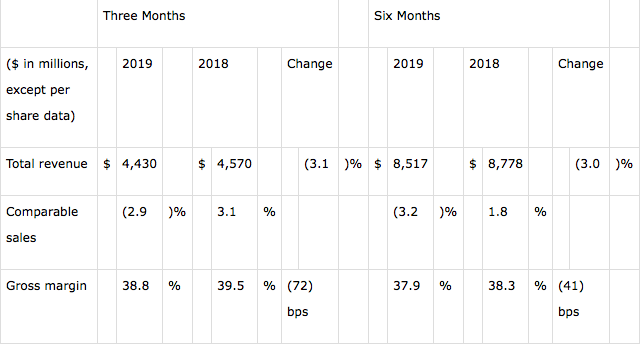
Within Kohl’s updated guidance for gross margins, the retailer said it expects gross margins to fall 35-45 basis points vs. a prior forecast for a 20-30 bps decline. Additionally, Chief Executive Michelle Gass said in a statement that same-store sales turned positive during the last six weeks of the quarter with 1% growth.
“We are confident that our upcoming brand launches, program expansions, and increased traffic from Amazon returns program will incrementally contribute to our performance during the balance of the year and beyond.”
Finom Group is not of the opinion that the Amazon partnership will be incrementally or sustainably positive for Kohl’s metric’s longer-term. While it does add a layer of increased accommodation for Amazon shoppers and Prime members, it likely does little to boost overall sales for Kohl’s. We would expect a modest boost in foot traffic from the partnership, but it doesn’t change the assortment at Kohl’s and therefore it likely won’t increase purchase activity to the degree some may be anticipating. It’s not a negative, but it’s not meaningful enough to offset the e-commerce trends that have solidified over the last decade.
Markets are poised to reverse Tuesday’s losses and with investors now awaiting results from Target (TGT). The company is coming off a strong first quarter that helped shares rise in the first half of 2019. Rival company Walmart (WMT) reported earnings last Thursday and led the stock market rebound.
Consensus estimates call for the company’s bottom line to increase 9.52% to $1.61 per share on the back of a sales climb of 3.12% to $18.33 billion. Comparable store sales are forecasted to increase 2.83%. The total number of operating stores is expected to jump to 1,858.
Looking ahead to fiscal 2019, consensus estimates are anticipating earnings to grow 9.83% to $5.92 per share while revenue rallies 3.64% to $78.1 billion. TGT has beaten estimates twice in the past four reported quarter for an average EPS surprise of 2.55 percent. (Golden Capital Portfolio owns shares of TGT, recently reduced weighting at $88.58)
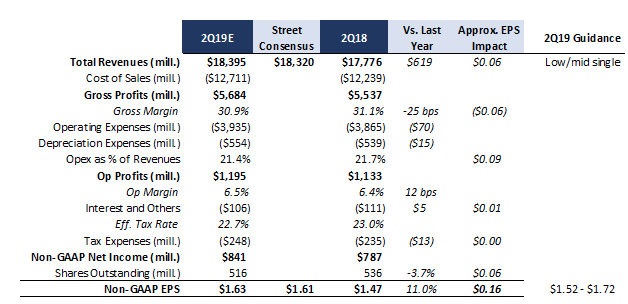
If first quarter trends can serve as reference, Target is likely to experience strong, high double-digit growth in digital sales enabled by the company’s new fulfillment initiatives that include Shipt, same-day pickup and curbside service. I will be surprised to see any reference to foot traffic having deteriorated much, given resilient consumer activity – i.e. high employment, moderate wage growth, and overall positive consumer sentiment.
Awaiting the market open on Wednesday and with the FOMC minutes due out at 2:00 p.m. EST, the sentiment on Wall Street for risk assets is mixed. But J.P. Morgan’s quant guru Marko Kolanovich is of the belief that the market is heading higher.
“Despite fundamental risks, recent equity and bond moves were mostly technically-driven. More than half of equity moves were driven by systematic rather than fundamental trading.”
Finom Group has been discussing the tight correlation between equity and bond market activity of late. In the Finom Group Trading Room we monitor the movement in yields and presciently forecasted that the inversion of the 2s/10s yields would likely find equity market algorithms sparked. Last week Wednesday, that’s exactly what took place once the yield curve inverted. Kolanovich discussed this event from last week in his recent notes to clients.
The strategist estimated Wednesday’s massive stock sell-off resulted from $75 billion in algorithmic selling. About half of it came from index option delta and gamma hedging, 20% from trend-following strategies, 15% from volatility targeting strategies and the remaining 15% from other products, Kolanovic said. And he said more than half of the move in interest rates, including the inversion of the yield curve, was caused by “technical drivers” like hedging by banks.
The strategist said stocks have more room to run this month and could gain another 2% next week.
“Even after the stock market recovered some of the losses from last week, we could still see equity inflows and outperformance into month-end. Our model suggests that these flows could drive a further ~1.5%-2% outperformance for equities next week.”
In addition to discussing his expectations for equity markets near-term, the quant team denotes the bond market rally underpinnings.
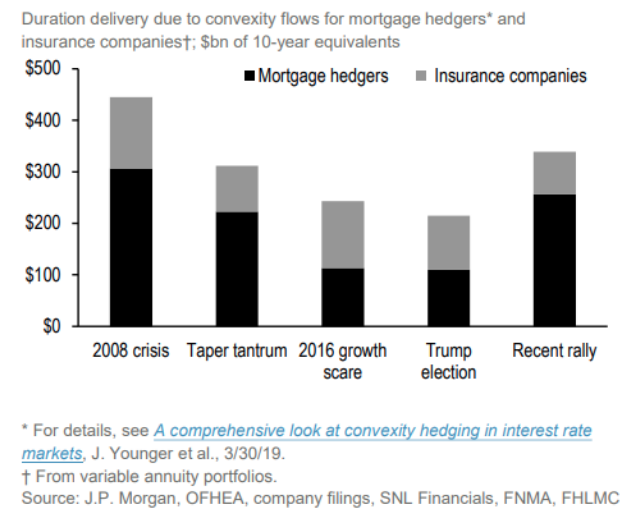
“The value of long-term bond yields as an economic signal has been somewhat distorted by technical drivers such as so-called convexity hedging, a powerful driver of the bond market’s rally this year.”
To hedge against the risk of diminished incomes from home loans, investors of mortgage-backed securities bought Treasurys with extended maturities, pushing yields lower in a vicious circle of bond buying. J.P. Morgan estimates that inflows into long-term government bonds from convexity hedging this year amounted to around $400 billion. Thin liquidity conditions over the summer have also helped supercharge the bond market rally.
Who else is bullish on the market near-term and believes another run at SPX-3,000 is ahead? Mark Sebastian, founder of OptionPit.com discusses his reasoning behind why the equity market has misunderstood and misrepresented the issues surrounding the yield curve inversion. He denotes and distinguishes why the yield curve inversion this go around is different than most others.
“If you don’t understand history you’re doomed to repeat. If you’re married to history, you’re living in the past. There are major differences between this yield curve inversion than like any other in the past. Recession fears are overblown and played–out! I think through the Labor Day holiday the S&P takes another run at 3,000.”
A master of market volatility, Sebastian also believes market volatility is likely to move lower near-term, not unlike others whom are positioning for such a decline in the VIX.
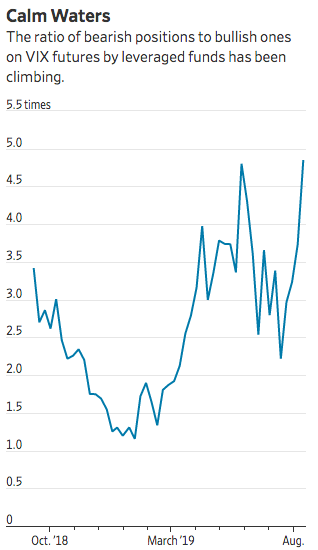
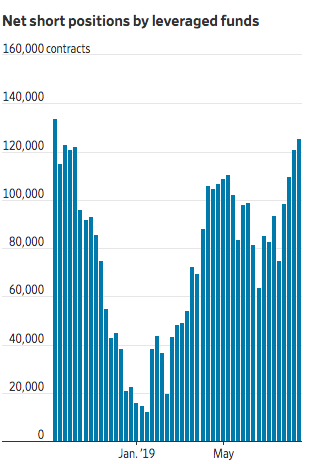
Leveraged funds like hedge funds recently increased bearish wagers on futures linked to the VIX to the highest level since September, Commodity Futures Trading Commission data as of Aug. 13 show. There are almost five bearish contracts outstanding for every bullish one held by leveraged funds, the data show.
Matt Thompson, a managing partner at Thompson Capital Management, said that he is positioned for volatility to fall and for stocks to rise, at least in the near term. He said he has bet against volatility through VIX futures and bought S&P 500 futures that would profit from a stock rally.
Investors have also grown accustomed to a rapid decline in volatility after brief jumps. Betting on volatility to recede once the VIX rises above 20 has historically been profitable, Mr. Thompson said.
Mr. Thompson said that recent trade news alongside the prospect of interest-rate cuts has made him more optimistic that stocks could rise in the short term, as they did Monday. President Trump recently said that the U.S. would delay some tariffs on goods from China from Sept. 1 to later this year.
“It seems like the trade stuff’s coming off the boil a little bit.”
Despite the positioning note within the Volatility complex, not everyone agrees with Matt Thompson. Anastasia Titarchuk says a summer bout of stock-market volatility is likely here to stay unless there’s a resolution soon of the trade tussle between the U.S. and China.

“That’s why it’s hard to see this volatility go away anytime soon. Sino-American tensions may not just be a passing phase of geopolitical gyrations. We don’t expect a quick resolution of the tariff question. That part of volatility will stay with us for some time…at least through the end of the calendar year.”
Lastly, but certainly not least with their latest take and forecast for the markets going forward is Tony Dwyer of Canaccord Genuity. Dwyer has accurately maintained a bullish stance for the S&P 500 in 2019, also accurately predicting each pullback phase on the year, suggesting that each pullback should be viewed as a buying opportunity for longer-term investors.
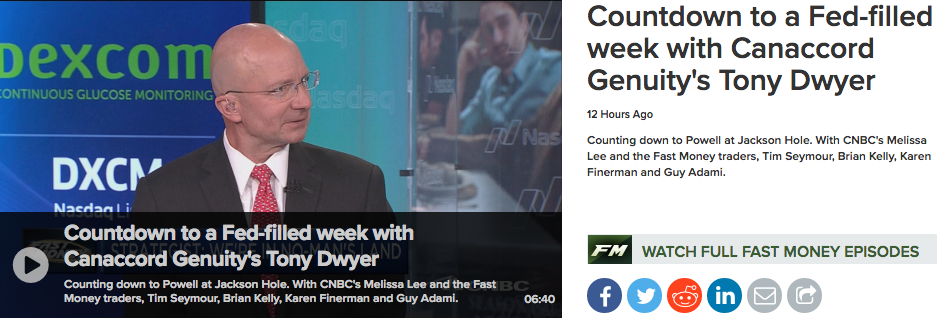
In Dwyer’s latest guest appearance on CNBC’s Fast Money program, the strategist discusses his bullish outlook and rationale supporting a continuation of the economic expansion.
“The Fed needs to cut rates with long-end rates below the Fed Fund rate. We think the Fed needs to get aggressively more accommodative. The Fed needs to issue some kind of monster accommodative message during the press conference that finds the long bond yields going up. The last press conference didn’t find the markets convinced that the Fed was serious and the long-end of the yield curve kept going down.”
There in lay the problem for the Fed going forward and unless it gets it’s messaging right. The bad news is that Fed Chairman Jerome Powell is prone and has a history of mixed and poor policy messaging. It happened at the July meeting again, that his message was perceived as not being convincingly dovish enough for the long-end of the yield curve to lift. The good news is that the bar is set pretty low with respect to messaging at this point. It doesn’t discount the need for the market to extrapolate a clear, dovish message, but the bar is set rather low at this point.
It’s a tough situation for the Fed to be in presently. The economy is humming along, albeit at a slower pace than in 2018 and the consumer is also relatively strong. Inflation is quite low and most yields are below the FFR. While the yield curve has inverted, un-inverted and remains below the FFR, recessionary conditions are present and don’t appear to be in the forecast over the next 6 months at least. San Francisco Fed President Mary Daly mirrored this sentiment in remarks offered Tuesday.
“When I look at the data coming in, I see solid domestic momentum that points to a continued economic expansion,” Daly said, in written answers to questions on the Quora website.
Daly said that there are “considerable headwinds” facing the economy and she was worried that they are contributing to a fear that a downturn is right around the corner.
“So one thing I’m looking closely at is whether the mood gets so out of sync with the data that the fear of recession becomes a self-fulfilling prophecy.”
With all of that being said, Existing Home sales will await investors Wednesday ahead of the market open and prior to the release of the FOMC meeting minutes from July. The consensus is for 5.39 million SAAR, up from 5.27 million in June. Housing economist Tom Lawler estimates the NAR will report sales of 5.40 million SAAR and that inventory will be down 1.6% year-over-year. The remainder of the week has limited although relevant economic data. We can’t dismiss the fact that unless the data is materially weak, it will not move markets more so than what is taking place in trade or Fed headlines and/or the bond market.
It may seem as though these are trying time for the macro-fundamental traders, but it is important to juxtapose that sentiment with a long-term outlook that suggests buying the dip is still prudent. It’s not often easy to maintain a level traders psyche during periods of unusual market moves and increased volatility. A long-term outlook, however, can improve the appetite for risk and subsequent rewards in the future from such risk taking, within reason.
Finom Group exercised its continued belief that the current pullback in the markets and pickup in volatility is nothing more than a buying and short-VOL opportunity. During the course of the trading day Tuesday, we offered and completed 2 short-VOL trades. One of those trades is depicted below:
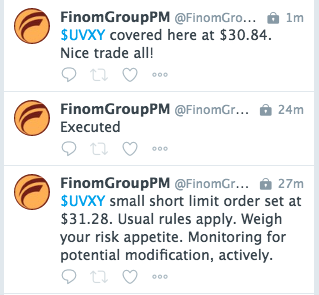
And towards the end of the trading day, with volatility rising again, we took another trading position in shares of UVXY. The market is a breeding ground for opportunity, but it demands a cognitive, long-term approach and macro-fundamental thesis.
The theme of today’s Daily Market dispatch begs traders to ask themselves the question, “What’s changed’? Up 250 points one day, down 170 points on the Dow the next day. But what changed? As traders/investors, tuning out market noise is one of the best things investors/traders can do. For example, don’t get sidetracked by the media’s constant stories of gloom and doom, and don’t get caught up in euphoric moments either. Does that mean tuning out everything? No! Market conditions do change, and ignoring those changes can be a mistake. Hopefully you’re not making your market decision today based on conditions that existed 35 years ago or even a year ago.
Moreover, the market cycle changes and so do does the length of each market cycle. This is currently in one of the longest running bull markets in the history of the U.S. stock market. Are you adjusting your trades and trading activity accordingly? What a world!


