
Try as it may, the major averages couldn’t escape the clutches of Boeing (BA) once again on Tuesday. The most heavily, price-weighted stock on the Dow Jones Industrial Average (DJIA) meandered in and out of positive territory on Tuesday, but gave way into the closing bell, dragging down the Dow.
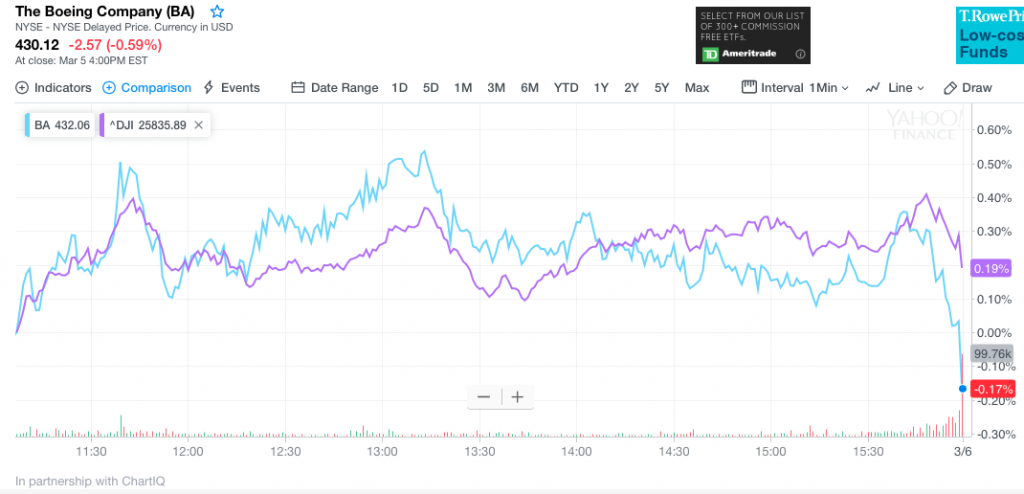
The S&P 500 (SPX) and Nasdaq (NDX) followed, but it was clearly a day whereby the market traded in a very tight range after falling sharply on Monday. Headlines were minimal Tuesday and economic data actually served the bulls more favorably ahead of Wednesday’s ADP employment report. With that, we encourage readers to review our daily, Technical Market Recap with Wayne Nelson of Finom Group.
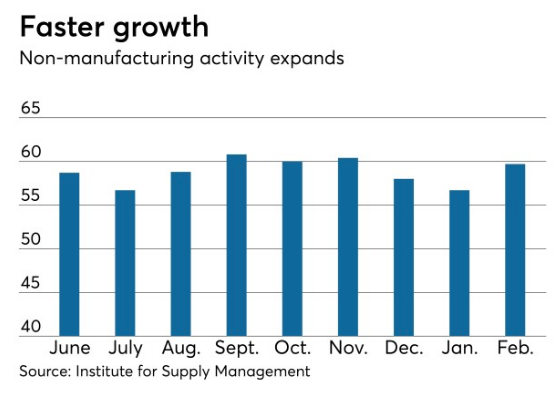
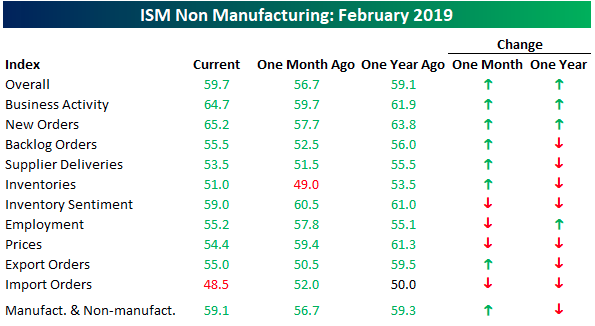
The U.S. services sector expanded at a faster pace in February as the non-manufacturing index climbed to 59.7 from 56.7 in January, on a seasonally adjusted basis, the Institute for Supply Management reported Tuesday. New Orders component of February’s ISM Services report hit its highest level since August 2005 and had its 3rd largest increase on record.
The business activity/production index rose to 64.7 from 59.7, the new orders index was at 65.2, up from 57.7; backlog of orders increased to 55.5 from 52.5; new export orders soared to 55.0 from 50.5; inventories gained to 51.0 from 49.0; inventory sentiment slid to 59.0 from 60.5; the supplier deliveries index rose to 53.5 from 51.5; and imports fell to 48.5 from 52.0.
“We are anxiously awaiting decisions in the next couple of weeks on the fate of the proposed tariffs on China. High Chinese commitments to agriculture output will put cost pressure on food and restaurant margins.” (Accommodation & Food Services) “The beginning of the year is generally our slowest time of year in the health-care industry. [Activity] will gradually pick up until April, then be steady until the fourth quarter, when there will be a large increase.”
New Home sales data also proved favorable for the bulls on Tuesday. New-home sales ran at a seasonally adjusted annual 621,000 rate in December, the Commerce Department said Tuesday. That was 2.4% lower than a year ago, but up 3.7% from the November 2018 period.
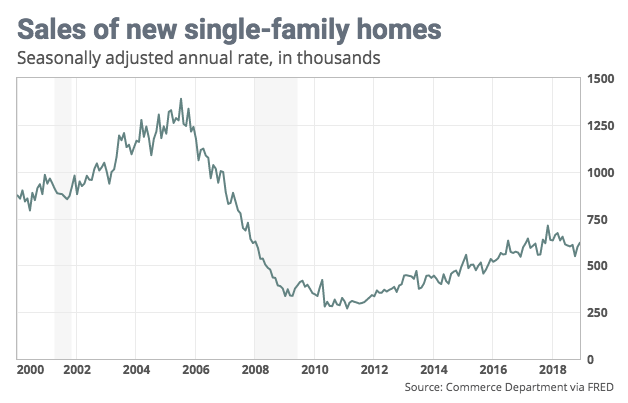
At the current pace of selling, it would take 6.6 months to exhaust available supply, a bit more inventory than is generally considered a marker of a balanced market. Sales were just 1.5% higher than in 2017.
“Ian Shepherdson, chief economist for Pantheon Macro, was rosier. “Sales are recovering from the 549K low in October, when activity likely was depressed by Hurricane Michael,” he said. “The increase in mortgage applications last fall is starting to work through the numbers, and we expect further increases in sales – with an even-money chance of new cycle highs – in the spring. New home sales are doing much better than existing home sales because most new sales are outside the northeast, where the SALT deduction limits have caused havoc.”
The remainder of the trading week offers a great deal of economic data. Wednesday’s release of private sector employment data precedes the more heavily watched Nonfarm Payroll report on Friday.
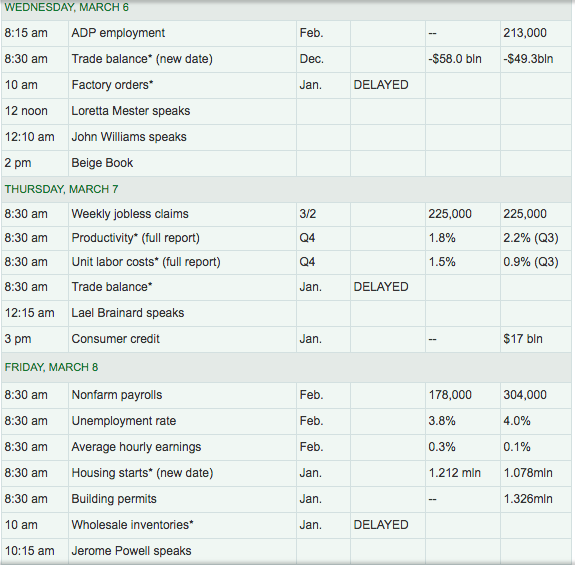
The Fed’s Beige Book will also be released Wednesday afternoon and heralds a speech by Federal Reserve Chairman Jerome Powell on Friday. The Fed remains in the spotlight as market participants weigh the “Fed pause” period and look toward the probability of a late 2019 rate hike.
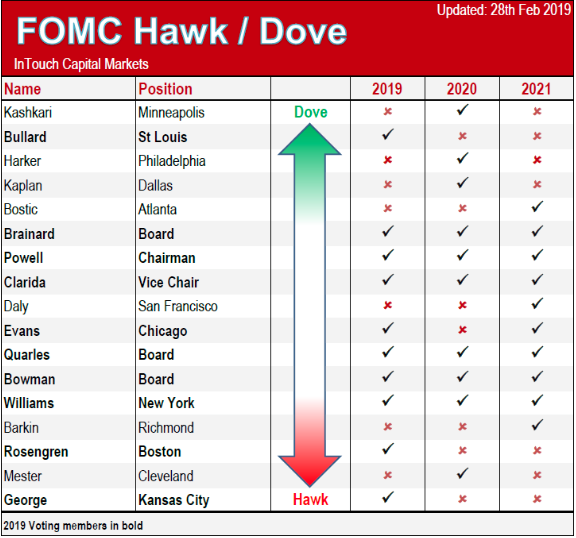
Considered a Fed “hawk”, Boston Federal Reserve President Eric Rosengren has been urging continued interest-rates hikes. As one can see from the table of Fed Presidents below, Rosengren is a voting member in 2019, but not in the following 2 years.
However, Rosengren changed his hawkish tone when he recently said that he supported a “patient” policy approach that could last for “several” meetings of the Fed’s interest-rate setting committee.
Rosengren said his earlier concerns that the economy might overheat “seem somewhat less pressing at this juncture.” Some financial stability risks “have been reduced,” he said. Investor “ebullience” has been tempered by the recent financial market volatility, he added.
Rosengren said he forecast a growth rate this year somewhat above 2% without much risk of higher inflation. Inflation has “so far” been quite well behaved, despite rising wage pressures, he said. Rosengren said there seemed to be heightened risks to his outlook that included the dip in the December retail sales data that might indicate the economy may be slowing a bit faster than policymakers anticipated,” he said.
The sideways action in the markets lately resembles and highlights an exhausted rally.
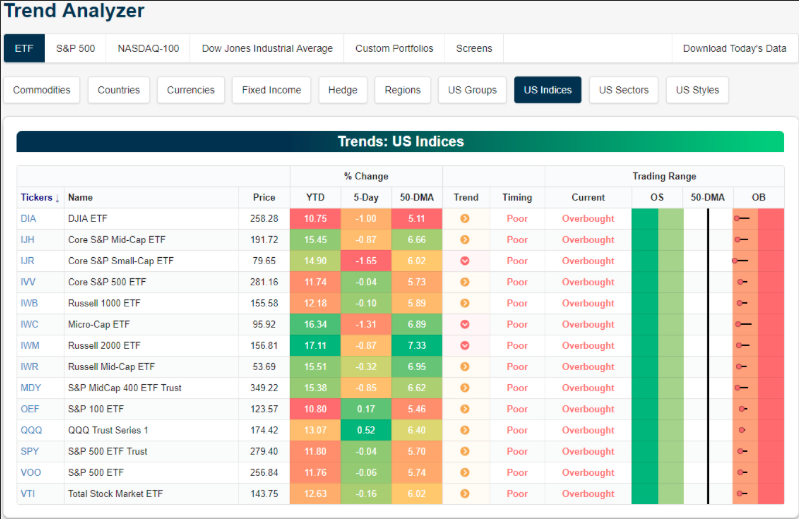
As we can see from the Bespoke Investment Group Trend Analyzer, All but 3 U.S. index ETFs have moved from downtrends to sideways trends. We’ve also seen downside mean reversion over the last week that is working off of overbought levels.
In addition to the indicator/table above, the S&P 500’s 10-Day A/D line typically oscillates between positive and negative territory on what is usually a week-over- week basis or at least every couple of weeks to weeks. Lately, though, it has been all positive. Through Monday’s close, the 10-Day A/D had been positive for 39 straight trading days. That’s over eight weeks in calendar days!
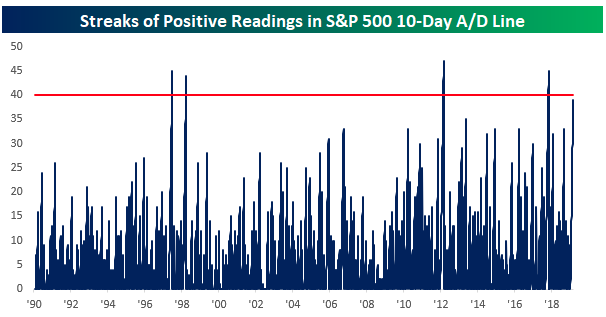
These kinds of periods of consistent positive breadth don’t typically happen very often. Going back to 1990, there have only been four other periods where the 10-day A/D line was positive for longer than it has been now.
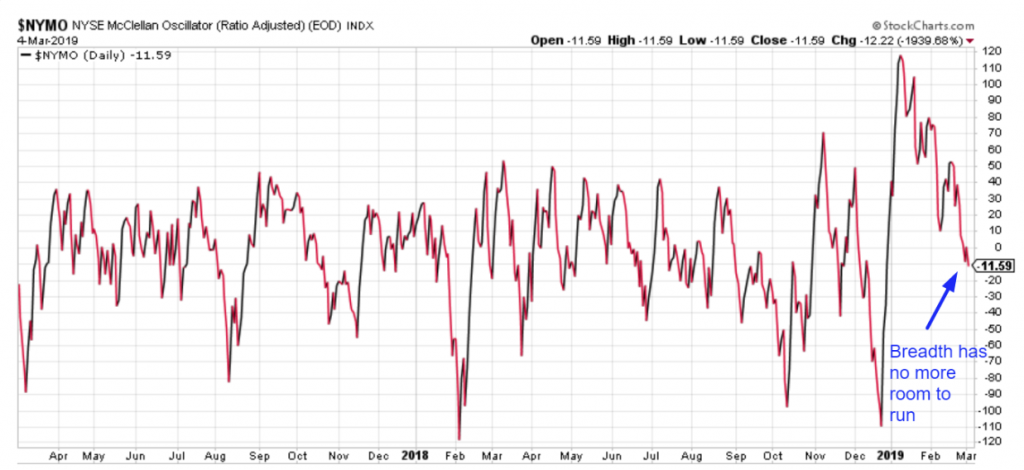
Moreover, when we review the NYSE McClellan Oscillator we can see that breadth is finally weakening.
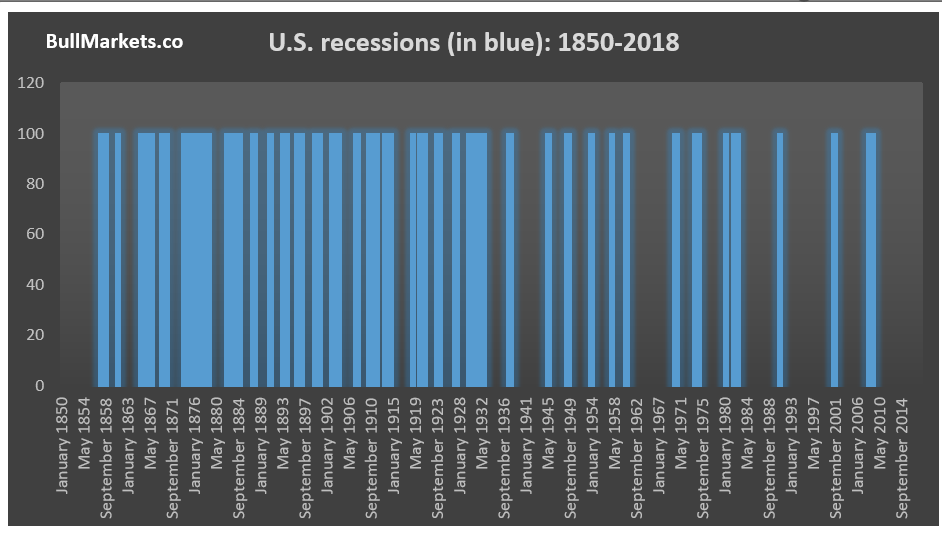
March 5th was a banner day for the markets as it represented the 10-year anniversary of the bull market, depending on when one believes it began. One of the most oft-cited arguments for why this bull market and economic expansion will end is because it has gone on for “too long”. Of course that’s a nonsensical argument because economic expansions have become longer and longer over the past 100 years and just like a bear market, a bull market doesn’t come with an expiration date. Some have even suggested that the latest actions by the Federal Reserve may serve to elongated the expansion and bull market cycles.
One thing is for certain with regards to extended bull markets; earnings growth becomes more and more difficult to accumulate. The tax stimulus legislature from 2018 served to jolt earnings higher in 2018, but have now created a headwind for comps in 2019. Additionally, when we look at a chart of the S&P 500 over the last year, we can see how investors have become uncertain of future earnings.
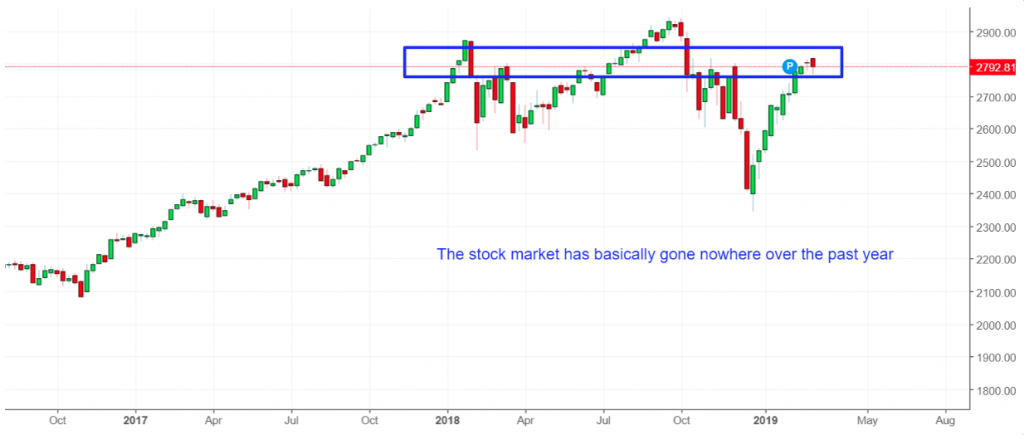
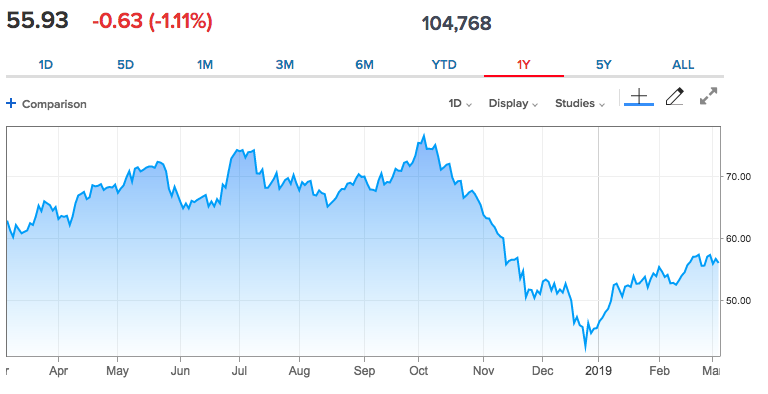
The S&P 500 has gone basically nowhere over the last year. Earnings growth is expected to decline in Q1 2019, but we won’t start seeing results until late April. Some of the issues weighing on earnings go beyond YOY comparisons and point toward crude oil prices impacting the heavily weighted earnings sector as well as the strong U.S. Dollar. While crude prices have certainly stabilized and moved appreciably higher in 2019, they still remain below levels seen in the first half of 2018.
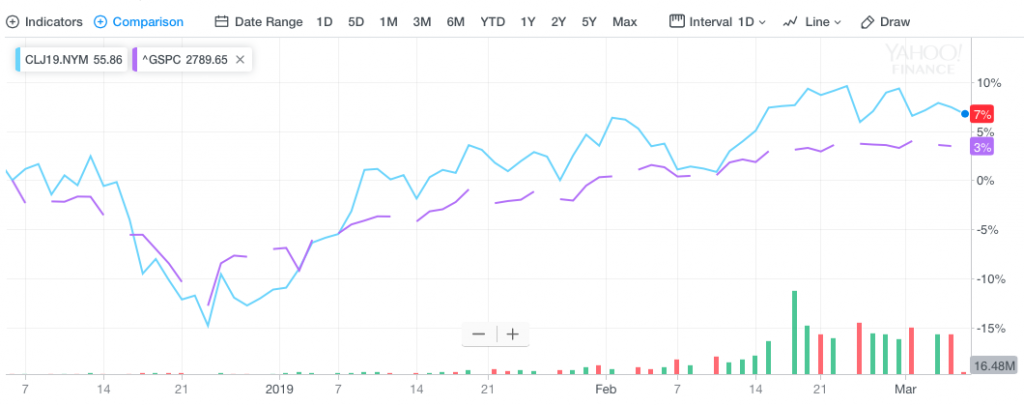
We can also see in the chart below, just how correlated Crude Oil prices and the S&P 500 trend.
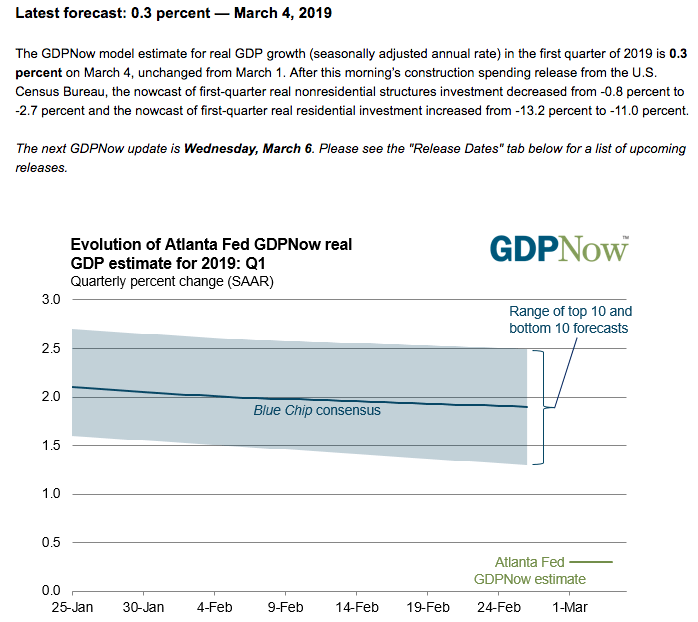
As we continue to monitor the economic data and with the backdrop of earnings set to decline in Q1 2019, the overall expectations for Q1 GDP remain pressured. A quick look at the latest Atlanta Fed GDPNow forecast shows that the institutions forecast continues to be lowered after the most recent construction spending data.
In closing out our daily market dispatch we can’t help but to recognize the rather strong earnings report from both Kohl’s (KSS) and Target Corporation (TGT). For the purpose of brevity, we’ll focus on Target’s reporting cycle and guidance issuance. Here’s what Target reported for the fiscal fourth quarter ended Feb. 2 compared with what analysts were expecting, based on average estimates compiled by Refinitiv:
- Earnings per share, adjusted: $1.53 vs. $1.52 expected
- Revenue: $22.98 billion vs. $22.96 billion expected
- Same-store sales: up 5.3 percent vs. growth of 5.1 percent expected
On an unadjusted basis, net income fell 26.5 percent to $799 million, or $1.52 a share, during its fiscal fourth quarter ended Feb. 2 from $1.1 billion, or $1.99 a share, the period the previous year, which included one less week. Revenue was about flat at $23 billion.
Sales at Target stores open for at least 12 months were up 5.3%, with bricks-and-mortar store sales growing 2.9%, while online sales were up 31 percent. That was better than expected growth of 5.1 percent. The company said its e-commerce business contributed 2.4 percentage points to overall same-store sales growth during the quarter. For the year, total same-store sales increased 5 percent, the strongest growth since 2005. Target’s e-commerce sales climbed 36 percent in 2018.
Looking to fiscal 2019, Target says it anticipates a low-to-mid single-digit increase in same-store sales, and a mid-single digit increase in net income. It’s calling for adjusted earnings of between $5.75 and $6.05 per share. Analysts had been expecting earnings per share of $5.61.
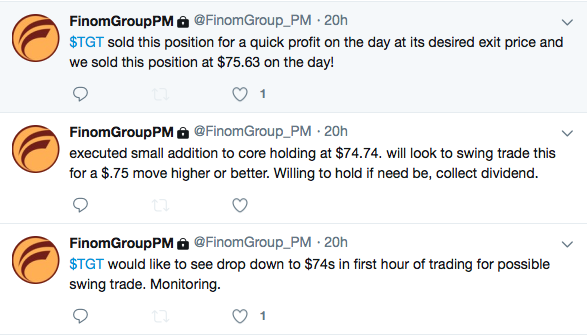
Target appears to be operating on all cylinders and has invested billions to grow the business during the economic expansion and what proved a strong 2018 consumer spending environment. Finom Group took advantage of the minor morning dip in the share-price, from pre-market highs, to issue a trade alert in the name.
In the 6:00 a.m. EST hour, equity futures are modestly lower, somewhat following their European index counterparts. Don’t forget, we’ll here from the European Central Bank on Thursday.
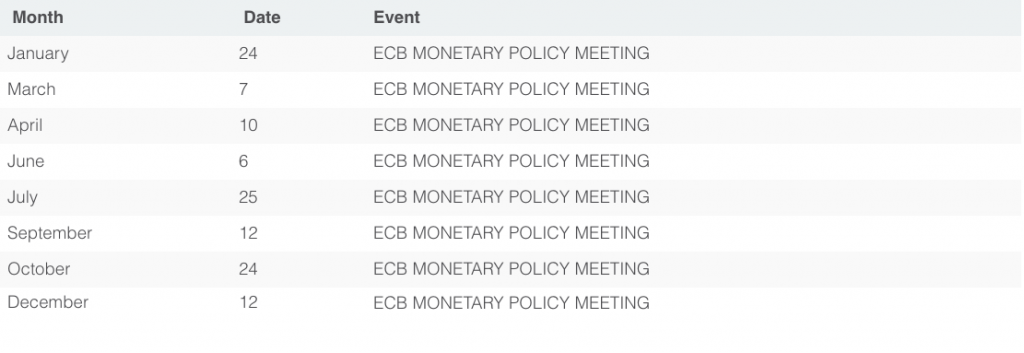
The central bank’s governing council meeting on March 7 will consider whether the eurozone’s economic slowdown will worsen. That will determine the policy steps the ECB might take, or the ones it might hint at taking in the future.
ECB insiders say the main step under consideration is a new long-term liquidity facility for eurozone banks. The “targeted long-term refinancing operations” (TLTRO) the ECB launched in 2014 and 2016 provided banks with four-year loans at low interest rates, on condition that they increased their lending. The latest of these loans mature next year. Some of the eurozone’s most challenged banks (think Italy) need a similar facility badly.


