
Welcome to this week’s State of the Markets with Wayne Nelson and Seth Golden. Please click the following link to review the SOTM video. In this week’s episode we discuss October markets. Our dialogue this week aims to rationalize the numerous headlines while recognizing the impact on financial markets. We focus on a recent report from Morgan Stanley that suggests the economy has moved ever-closer to a recession. Additionally, we tackle issues related to the latest retail sales and shipping data. Please review the supporting graphics and bullet points that accompany our State of the Markets video!
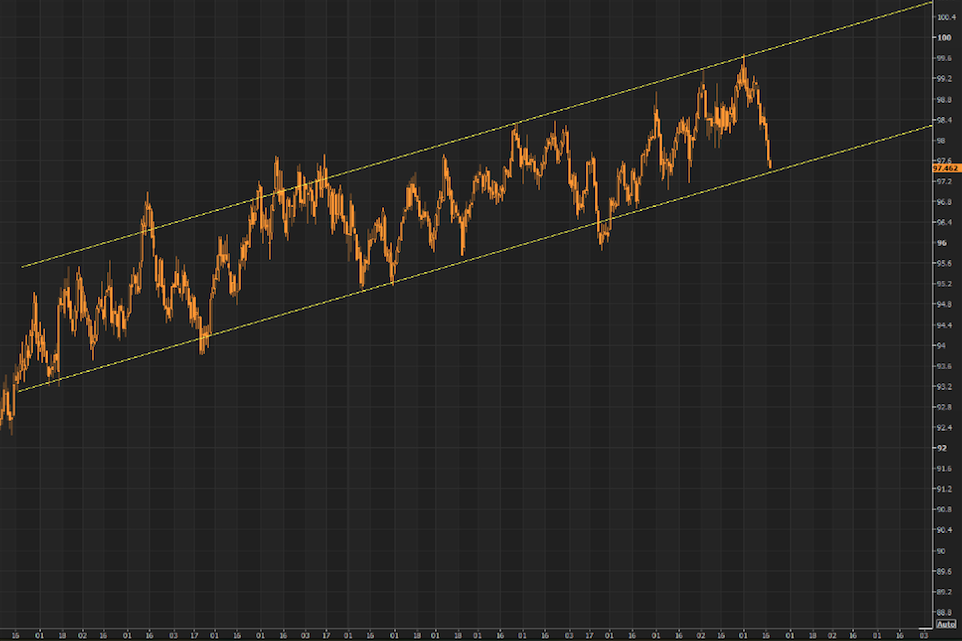
- U.S. Dollar index has broken through the long-term trend line Friday and portends well should global growth trough and bounce in 2020.
- Manufacturing has contracted 9 other times since 1948. The S&P 500’s one-year return averaged +12.0% and was positive 8 of those 9 times, with risk of -4.7% return compared to reward of +12.7 percent.

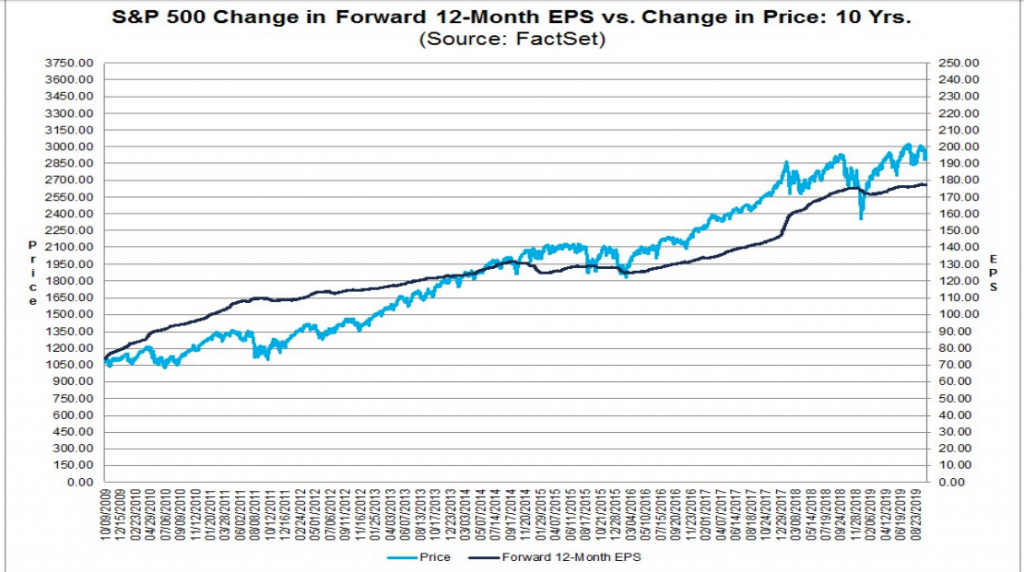
“The S&P 500’s robust 20% gain so far this year belies softening U.S. economic fundamentals and market weakness in non-U.S. equities, as well as U.S. small caps, cyclicals and value stocks. Large-cap U.S. growth stocks, which dominate the broader benchmark index for U.S. equities, account for the bulk of the gains.
Confidence in U.S. large-cap growth stocks rests on two key pillars: a belief that policies around trade and interest rates will be a net benefit for U.S. companies and faith in the strength of U.S. consumer spending, despite lackluster global trade, business spending and manufacturing.
Now, cracks in those pillars are starting to show. Below are three recent developments that make me think the odds of recession are growing:
- The slowdown in manufacturing activity seems to be spreading to services industries. We learned in early September that the Institute for Supply Management’s manufacturing index had fallen to the lowest level in more than a decade. Only 17% of industries showed growth. Investors may shrug this off, arguing that the manufacturing sector—though it makes up about 40% of the S&P 500’s market capitalization and profits—is no longer a significant part of the overall U.S. economy, which is dominated by service industries. However, the ISM services sector index also declined in September to the lowest level in five years, a drop that was twice as steep as what economists had forecast.
- Consumer confidence seems to be flagging, and vulnerability in the labor market is emerging. I’ve written recently about why U.S. consumers are essential for market health. The Conference Board reading on consumer confidence in future expectations in September registered sharp declines, in part because of a drop in survey respondents noting that jobs are plentiful. The labor market is usually the key to consumer confidence remaining healthy. The September non-farm payrolls report showed 136,000 new jobs created, less than expected and with slower wage gains.
- More Fed rate cuts are likely, but will they work? Markets are pricing in as many as three more interest rate cuts this year as the Federal Reserve aims to stimulate the economy by encouraging more borrowing and spending. Some stock investors continue to cheer that path. However, rapid Fed rate cuts often precede corporate profit weakness. Even more worrisome, if rates get low enough, the effect could be to encourage more saving and less spending among consumers—the opposite of stimulus.
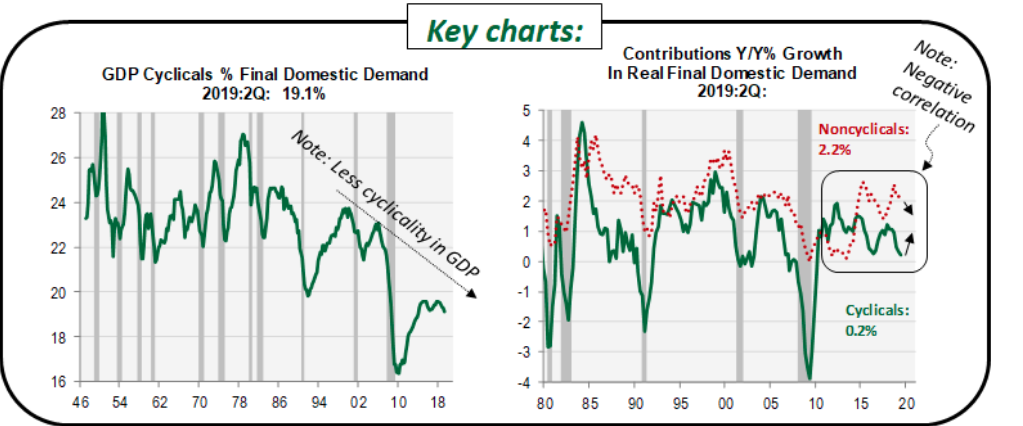
- For the second time this expansion, weak cyclicals have failed to take down the broader economy. Cyclical sectors are a much smaller share of the economy or S&P than they used to be in the past.
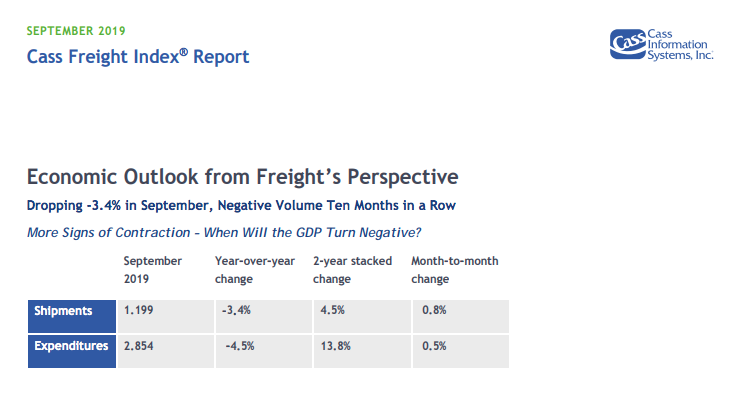
- Started in 1995, the Cass Freight Index measures both volumes and expenditures. The company uses data derived from $28 billion of domestic freight modes across all major industry verticals and from a wide array of shipping companies, large and small.
- “With the -3.4% drop in September, following the -3.0% in August, -5.9% drop in July, -5.3% drop in June, and the 6.0% drop in May, we repeat our message from the previous four months: the shipments index has gone from ‘warning of a potential slowdown’ to ‘signaling an economic contraction’.”
- More pointedly: “we see a growing risk that GDP will go negative by year’s end”.
- Finally: “The weakness in spot market pricing for many transportation services, especially trucking, is consistent with the negative Cass Shipments Index and, along with airfreight and railroad volume data, strengthens our concerns about the economy and the risk of ongoing trade policy disputes.”
- “We acknowledge that all of these negative percentages are against extremely tough comparisons, and the Cass Shipments Index has gone negative before without being followed by a negative GDP,” the report said. “However, weakness in demand is being seen across most modes of transportation, both domestically and internationally, with many experiencing increases in the rates of decline.”
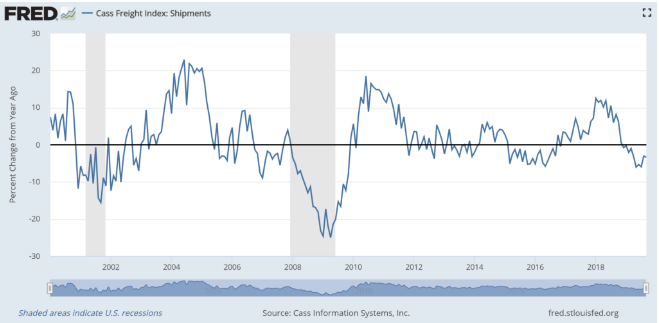
- The peaks occur early (2010) to mid cycle (2004). Recessions (the gray bars) see lower levels commensurate with the size of the contraction (worse in 2009 than 2001).
- But things get very choppy later in a cycle. The fast slide from +14% in September 2000 to -12% comps in December was an excellent signal something was amiss. But the 2005 – 2008 experience, where the index bounced between +9% (June 2006) and -9% (January 2007) was not as clear a harbinger of the 2008-2009 recession. And that was a big one, of course.
- More recently, the index has been noisier than usual. For example, the Cass Freight Index was negative every month from March 2015 to September 2016. It then bounced strongly in the first half of 2018. Some of this was likely due to inventory stocking ahead of tariffs, and the comps have been hard ever since.
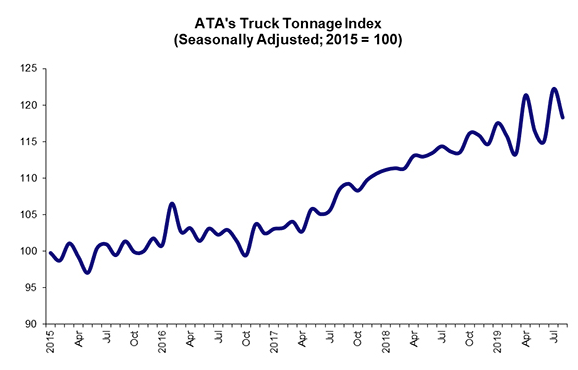
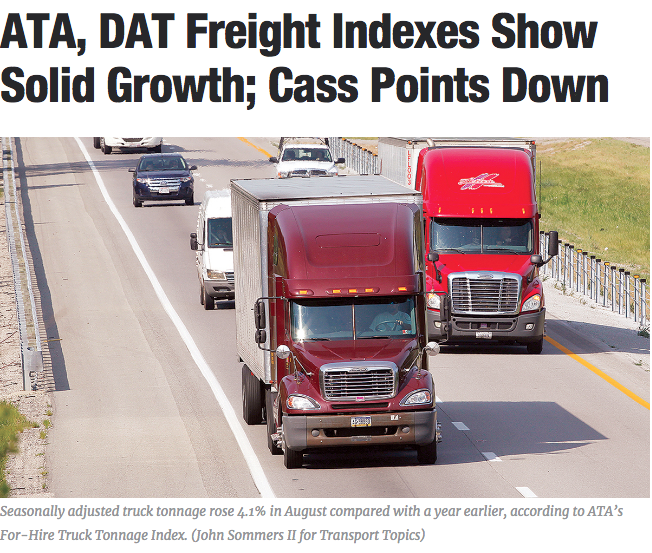
- Two of the three major monthly freight indexes showed positive trends in August, leading economists to downplay fears the trucking industry is heading into a downturn leading up to the holiday shipping season.
- Freight indexes for American Trucking Associations and DAT Solutions showed steady growth, while Cass Freight Systems’ index was down.
- Seasonally adjusted truck tonnage rose 4.1% in August compared with a year earlier, according to ATA’s For-Hire Truck Tonnage Index.
- The change in tonnage actually hauled by fleets before any seasonal adjustment equaled 125.1 in August, 2.2% above the July level of 122.3.
- “It is important to note that ATA’s tonnage data is dominated by contract freight, which is performing significantly better than the plunge in spot market freight this year.”
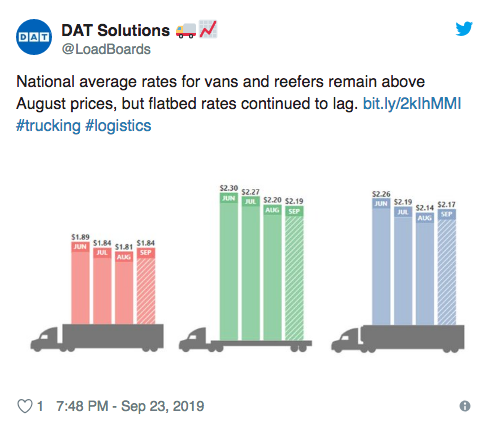
- DAT, of Beaverton, Ore., uses three indexes to measure freight volume, monitoring levels for vans, flatbeds and refrigerated trailers. That company’s numbers are showing no signs of an economic slowdown.
- The August 2019 van index rose 7.9% year-over-year, to 198 from 184 a year ago.
- The reefer index climbed 6%, to 155 from 146. The flatbed index also jumped 7.7% to 216 compared with 200 the year before. The index baseline of 100 equals the number of loads moved in January 2015, as recorded in DAT RateView, a database of rates paid on an average of 3 million loads per month.
- DAT Market Analyst Peggy Dorf said August is often the top month of the year for spot market volume, with truckload demand boosted by the start of a new school year. Plus, supply chains traditionally kick into high gear for Labor Day sales and Halloween. And many shippers in the Atlantic rushed freight ahead of Hurricane Dorian, which struck the Southeast coast in early September.
- “The economy has certainly been a hot topic as of late,” Dorf said. “August gave us a lot to be optimistic about as we head into the fall shipping season.”
- She added that while the stronger volumes have yet to push truckload prices higher, there are early signs that rates are turning a corner.
- “Spot market rates seem to have found the bottom in August and are poised for a rebound,” Dorf said. “Even if there’s disagreement over the economic outlook, one thing is certain — truckload capacity is still in high demand.”
- DAT Solutions operates North America’s largest load board marketplace and has a database of $65 billion in trucking rates.
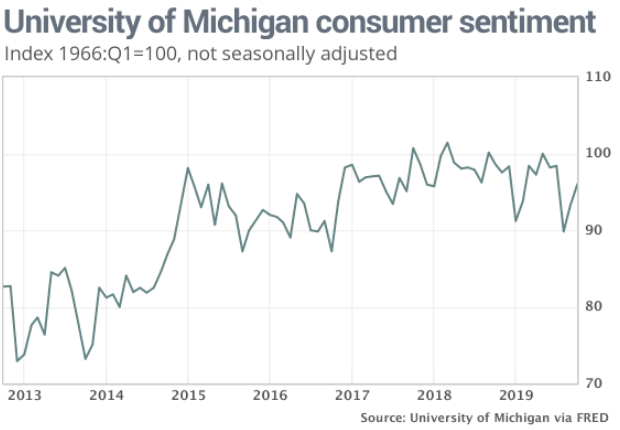
- Expectations for real, or inflation-adjusted, income gains rose the “most favorable level in two decades,” said Richard Curtin, chief economist for the survey.
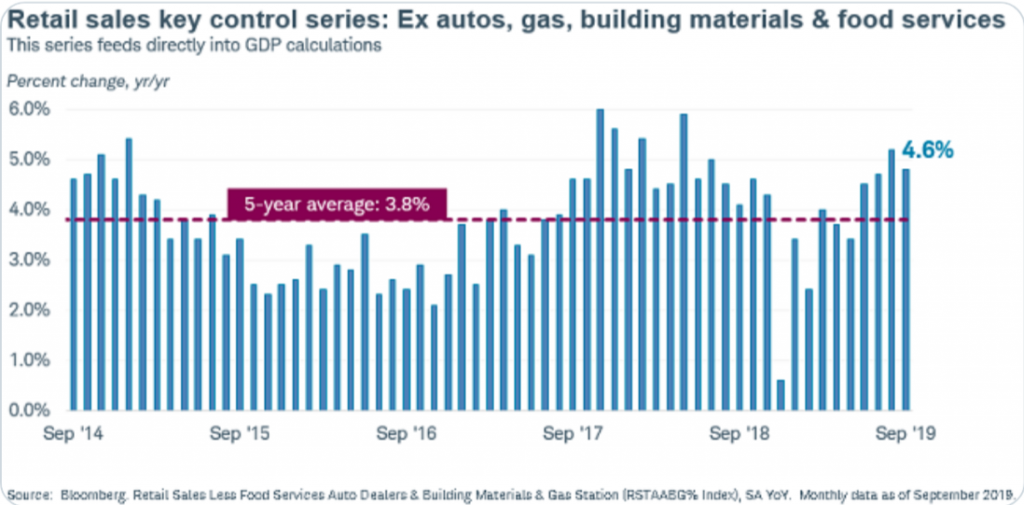
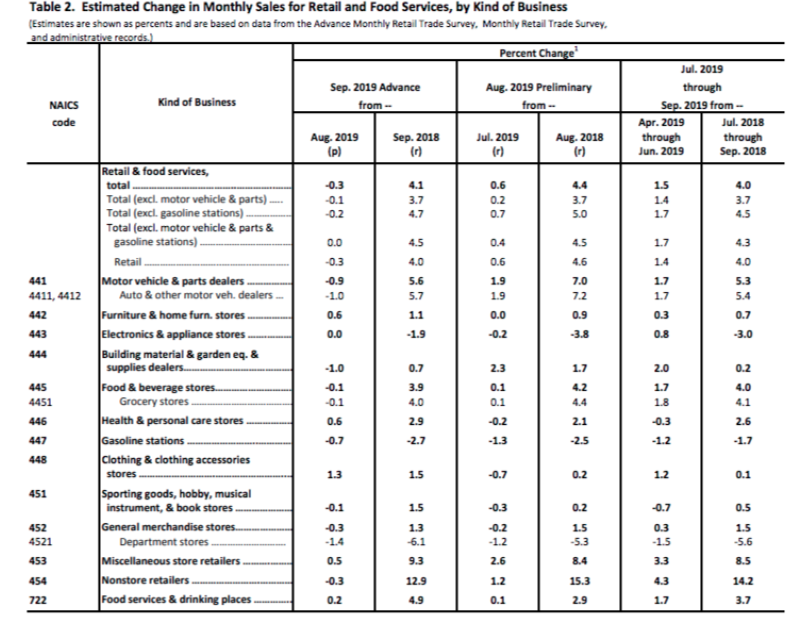
- Pretty much as I expected, weaker September retail sales as nothing is happening in September, but upward revision to August & YOY accelerated growth to 4%.
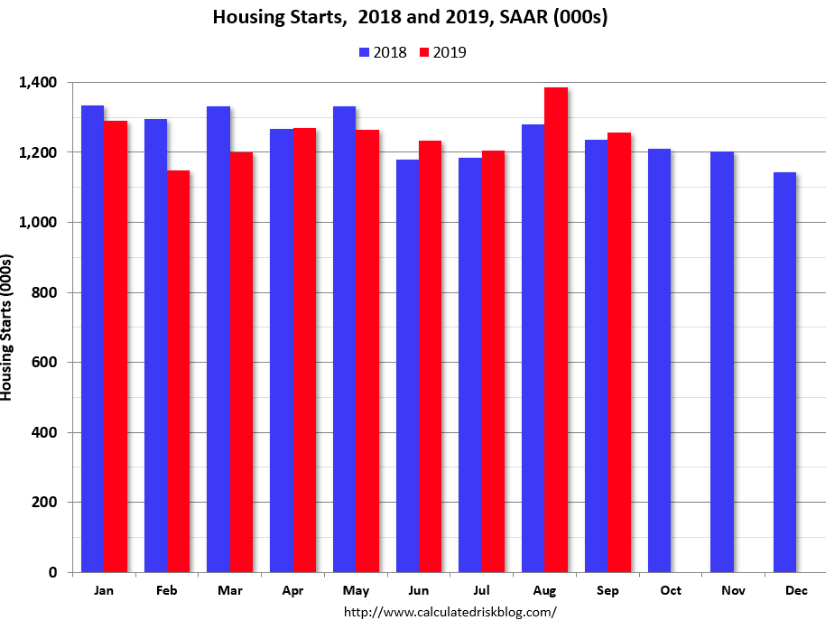
- The Housing Starts report showed starts were down 9.4% in September compared to August, and starts were up 1.6% year-over-year compared to September 2018.
- Single family starts were up 4.3% year-over-year, and multi-family starts were down 5.8% YoY. Much of the weakness this month was in the volatile multi-family sector. Last year, in 2018, starts were strong early in the year, and then fell off in the 2nd half – so the Q4 comparisons will be easier.
- If we take a closer look at both Housing Starts and Building Permits, the 12-month average has actually started to tick higher again. That’s an important trend because going back to the mid-1960s, there has never been a period where we saw rising levels of starts heading into a recession.
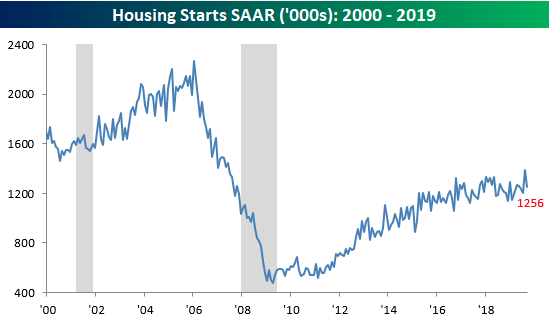
- As shown in the top chart, every prior U.S. economic recession has historically been preceded by a downturn in the 12-month average of Housing Starts. In some cases, the peak in starts came well before the recession started and in others, it was within a year. Looking closely at the chart, while the 12-month average most recently peaked back in September 2018, it hasn’t yet shown signs of rolling over as it did leading up to prior recessions.
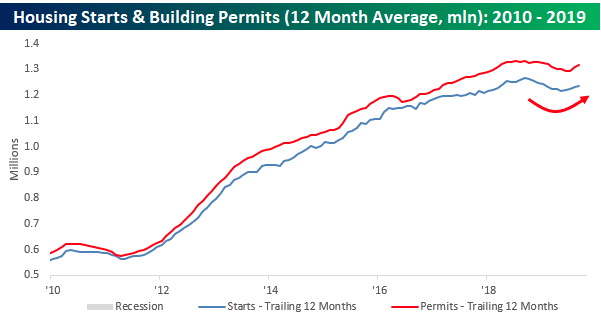
- If we take a closer look at both Housing Starts and Building Permits, the 12-month average has actually started to tick higher again. That’s an important trend because going back to the mid-1960s, there has never been a period where we saw rising levels of starts heading into a recession.

- It’s hard to imagine an imminent recession when homebuilder sentiment has had its largest 10-month increase in over 6 years.
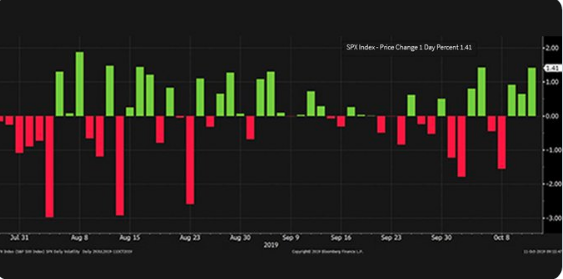
- Halfway through October, 6 of 9 trading days yielded one-day changes greater than one percent, on brand with October as a historically volatile month. Learn how October 2019 compares to past years in the Inside Volatility Trading newsletter.
- Historically, October has the highest average VIX Index value, with a reading of 21.73. Thus far, October 2019 is living up to the historical hype. There has been a noticeable increase in the amount of protection that market participants are seeking.
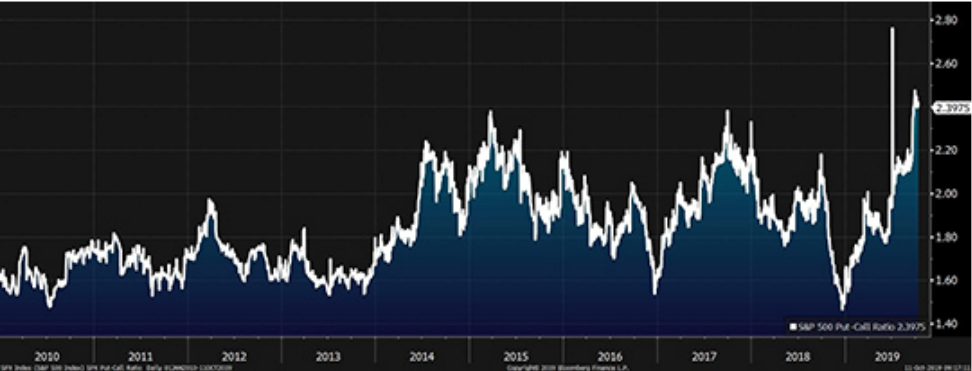
- As of October 11, the SPX put-to-call open interest ratio, with a current reading of 2.40, is the second highest reading in the last 10 years. It is only eclipsed by a reading of 2.76, which was recorded on July 5, 2019.


