

Research Report Excerpt #1
With this front of mind, I would suggest that investors not dwell on this past week’s retreat in the markets, even if Friday’s market action culminated with the lows of the week. One week, one day… that does not make a month or a year. While Friday’s retreat in the major averages was the largest in several months, for a single day, saying stocks “plunged” Friday is also like saying a healthy person is knocking on death’s door because they coughed. This chart of Value vs. Growth helps to make this very point:
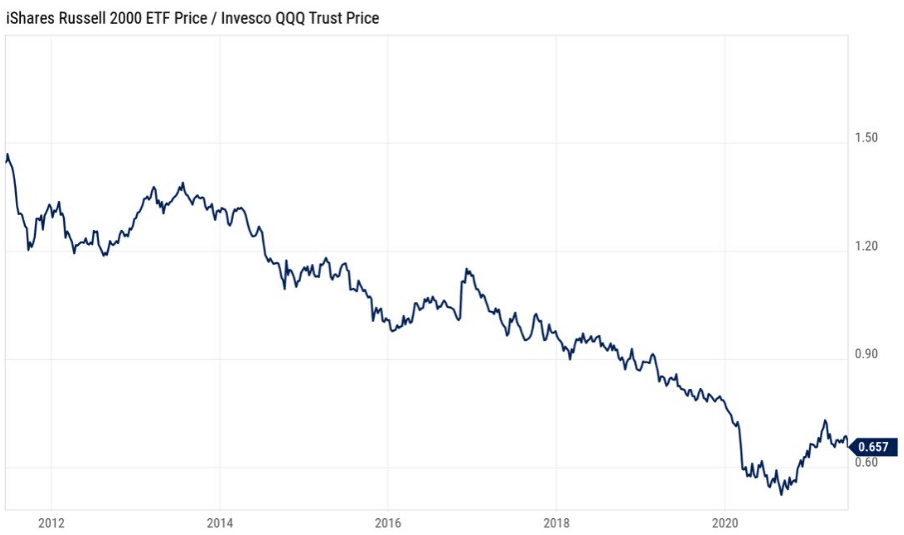
The chart o f the Russell 2000’s Value ETF vs. Invesco’s QQQ Growth ETF identifies the exaggerations of strategists and the media about the performance of Value:Growth of late, just like many investors will exaggerate this past week’s market “plunge”. For traders and investors, it’s all about perspective and more so the preparation. So when I say the following, PLEASE, DON’T MISS THIS:
Research Report Excerpt #2
Having and maintaining appropriate market expectations are a critical component for long-term investing/trading success. We came into this past trading week expecting weakness, and weakness we got. Additionally, we continued to ANTICIPATE strength amongst Nasdaq, Growth, and Technology areas of the markets and that is also what we got.
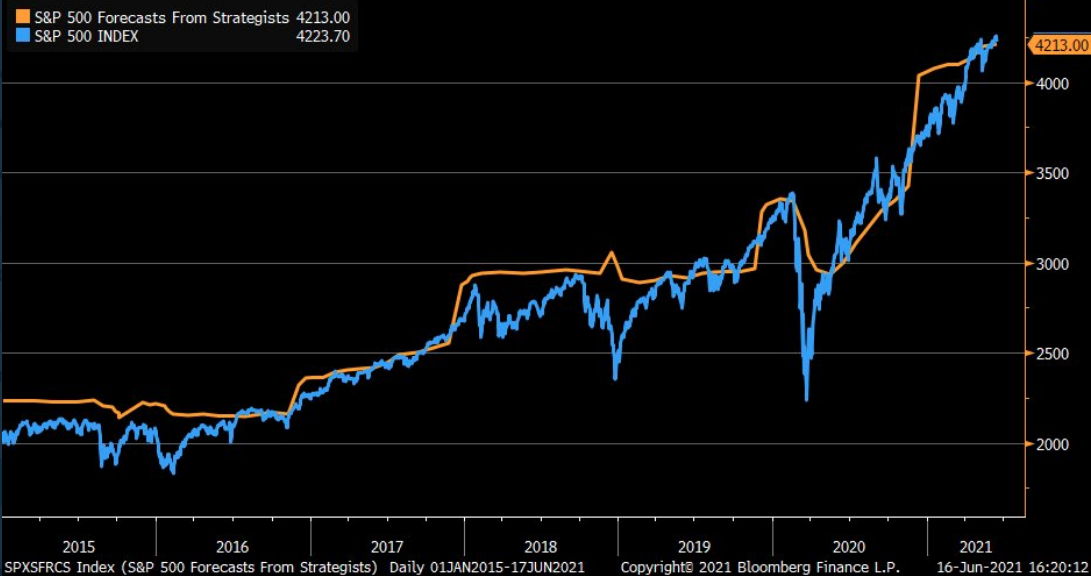
Speaking of expectations, coming into 2021, Finom Group’s 2021 S&P 500 price target was 4,325.

We remain comfortable and confident in this price target objective, regardless of where the “street” currently resides with their consensus target of 4,213 and rising, as shown in the S&P 500 Forecast From Strategists chart below:
Research Report Excerpt #3
The 20-day low breadth indicator is basically a trading month indicator. If we cut that down by half and look at the percentage of S&P 500 stocks trading at 10-day lows, that has risen to nearly 70% of stocks.
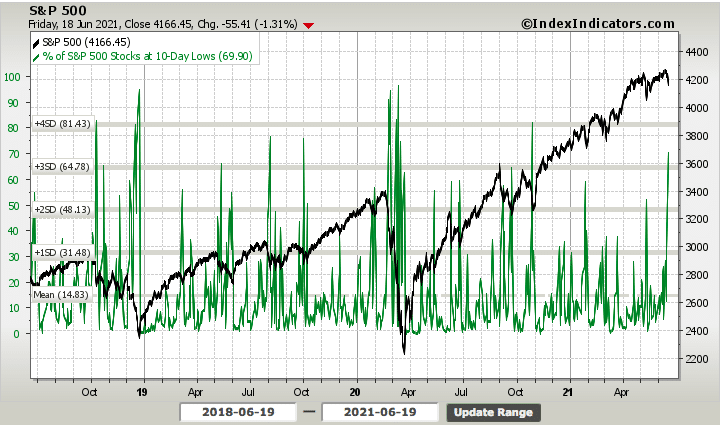
In bull markets, when we achieve these types of levels, it usually signals a near-term wash-out in the index whereby traders and investors alike are found buying the dip and putting in a corrective bottom.
Research Report Excerpt #4
So there’s a bigger point I wish to make here that ties in our seasonality focus (June) and the NYSE/SPX relationship. The S&P 500 made a new all-time high this week, and shortly after both the NYSE and the S&P 500 A/D lines also made new all-time highs. That’s the confirmation we look for, in order to validate all-time highs, through the A/D lines. If the S&P 500 is making all-time highs without new all-time high A/D lines (SPX/NYSE both), we could have a problem down the road.
We’ve looked at new all-time highs for the S&P 500 in the month of June going all the way back to 1929. Here is what we’ve found related to our study:
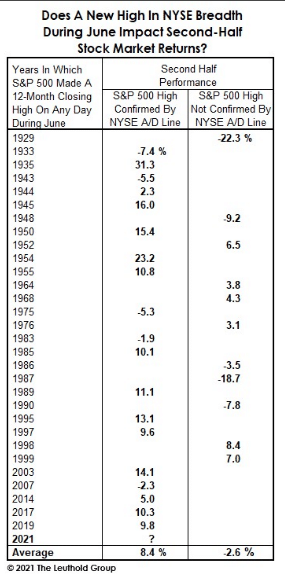
New S&P 500 highs in June are a bullish sign for the second half of the year IF they are confirmed by the NYSE Advance/Decline Line. Monday’s new high qualifies as bullish, given that it was indeed confirmed by NYSE A/D line highs. The average return in the second half of the year is 8.4%, with the lowest return being a drop of roughly -5 percent. So if you were looking for another quantitative reason to remain optimistic about the back half of 2021… you may have just encountered it folks!
Research Report Excerpt #5
In what is still a red-hot housing market, Housing starts bounced 3.6% to 1.57 million in May, a little below expectations. Total starts, were up 50.3% year-over-year compared to May 2020. That follows the 12.1% drop in April to 1.51 million and the 19.2% jump to 1.72 million in March. Single-family starts rebounded 4.2% to 1.09 million after the 16% plunge to 1.05 million. Multifamily starts rose 2.4% to 0.47 million after dipping 1.5% to 0.46 million in April.
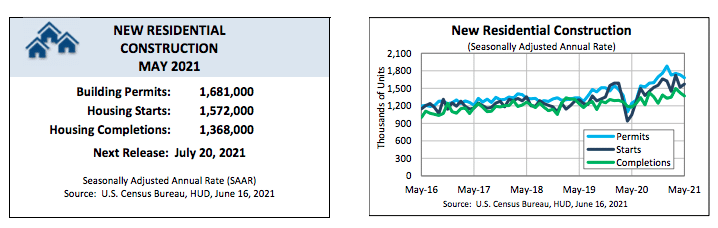
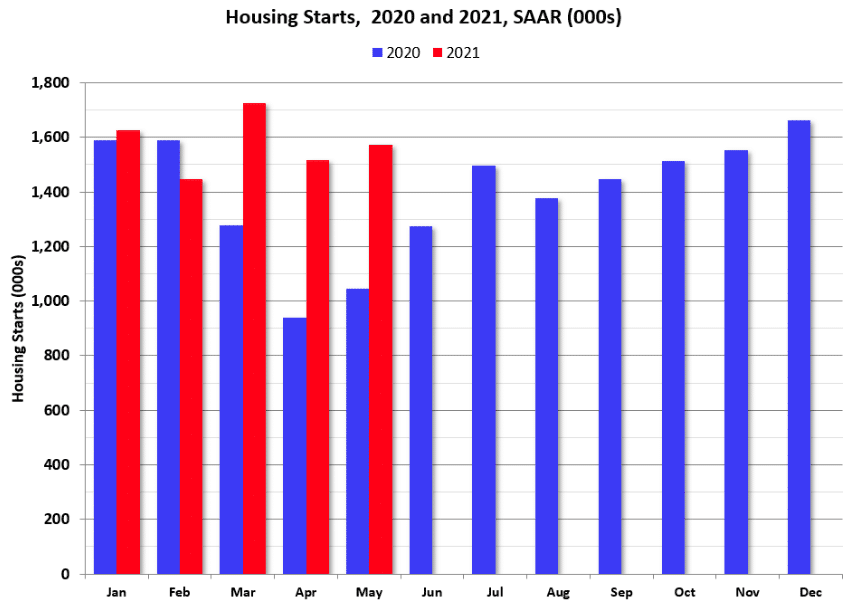
Building permits declined 3.0% to 1.68 million in May after tumbling 1.3% to 1.73 million in April. On to monthly retail sales folks!
Research Report Excerpt #6
In their 2021 midyear economic outlook, Morgan Stanley economists outline why they think this recovery has staying power, with forecasts for 6.5% global GDP growth for 2021, led by the U.S. economy’s 7.1% growth, followed by 4.8% globally and 4.9% for U.S. in 2022.
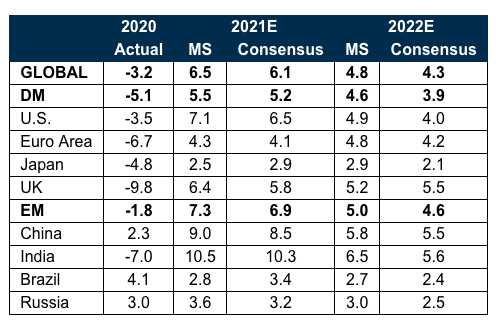
Three key factors drive this outlook for a sustained recovery. “First, COVID-19 was quite different from the Global Financial Crisis, which was born out of excessive private-sector leveraging,” says Chetan Ahya, Morgan Stanley’s Chief Global Economist.
Second, policymakers responded to the pandemic’s economic impact actively and aggressively. Finally, in the biggest departure from the prior recovery, policymakers want to see inclusive growth before they put the brakes on support. “After the last recession, the Fed tightened rates at a much higher rate of unemployment than it is targeting now,” says Ahya.
Research Report Excerpt #7
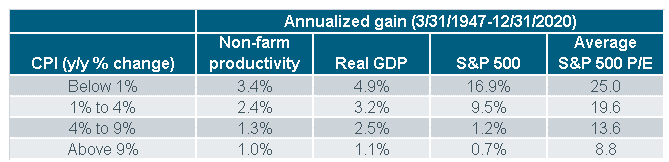
Looking at history, there is a connection between inflation and stock market, as well as economic performance. As you can see in the table below, using four broad ranges for CPI, you can see that higher inflation has led to diminishing growth rates for productivity, real gross domestic product (GDP), the S&P 500 and the S&P’s price/earnings (P/E) ratio.
Research Report Excerpt #8
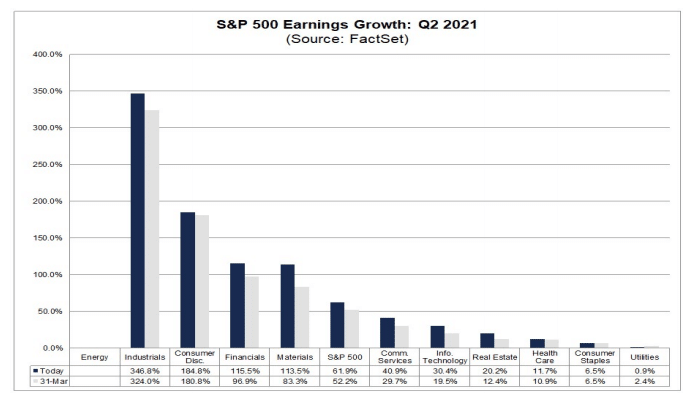
The expected 61.9% YoY EPS growth for Q2 2021 is likely to find consistent, positive revisions once the season truly gets under way, as is normally the case. Finom Group has insisted in the past that inflation is not showing any problematic impact for corporate earnings to-date, as profit margins hit record levels. Having said that, we still ask ourselves to dig deeper into this subject matter by asking the question, “Is this inflation having a negative impact on expected earnings and profit margins for the full year?”
Research Report Excerpt #9
The S&P 500 has performed best since 2010 after high readings for the 20-day HV. The 1-month returns are strongest in those 2 bottom rows, where the reading is 13.6% or higher. The low volatility bracket shows a 1-month return of 0.49%, which is the second-worst bracket in the table. It seems these low readings have generally led to boring underperformance.

The data underscores our main point. Higher HV and/or IV provide a breeding ground for opportunity. While others are selling into market weakness and volatility is rising, these are confirming signals to become opportunistic, active market participants. This assumes one uses the higher volatility levels to buy the dip.


