
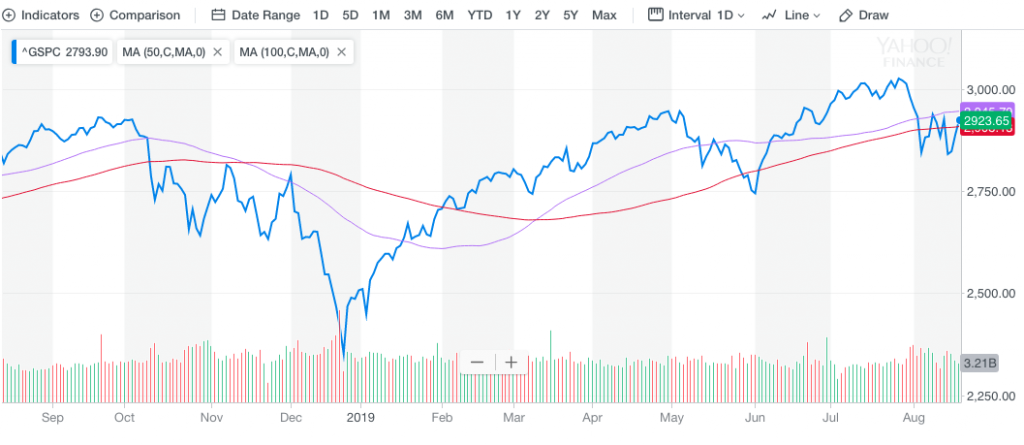
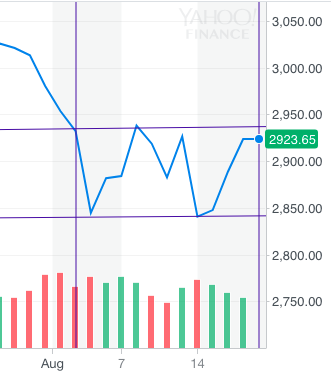
Monday picked up right where last Friday left off with bond yields and equities both moving higher. The S&P 500 (SPX) rose 1.2% on the day or nearly 35 points. The benchmark index still puts it right smack dab in the middle of its 50 and 100-DMA, having done little more than move sideways over the last couple of weeks.
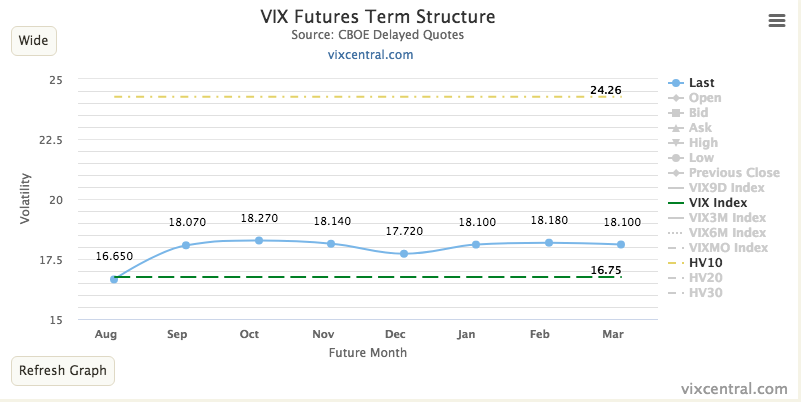
The realized volatile moves in the market over the last 2 weeks have created strong trading opportunities, even as implied volatility (VIX) has risen and more recently declined over the last several trading days. As shown in the chart below of VIX Futures Term Structure, 10-day realized volatility (HV10) at 24+ is significantly higher than the VIX at 16+ presently.
If you bought the dip recently, you’ve likely been rewarded by the market’s recent rally off of the Wednesday bottom whereby the S&P 500 had fallen 3% intraday. The media may have exacerbated market moves last week, as the focus last week highlighted Wednesday’s bond yield curve inversion (2s/10s). The Dow Jones Industrial Average (DJIA) fell some 800 points that day and sparked a CNBC “Markets In Turmoil” special programming. It was the 2nd “Markets In Turmoil” in the 10 day period, something we took notice of as what is usually an opportunity for traders.
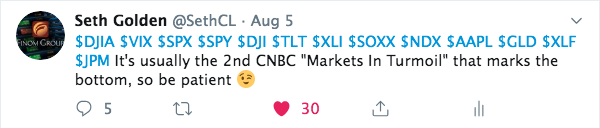
As shown in my tweet from August 5th and with the first “Markets In Turmoil” program, I alerted the fintwit community that it is typically the 2nd time CNBC airs the special program that marks, at least, a temporary bottom in the market.
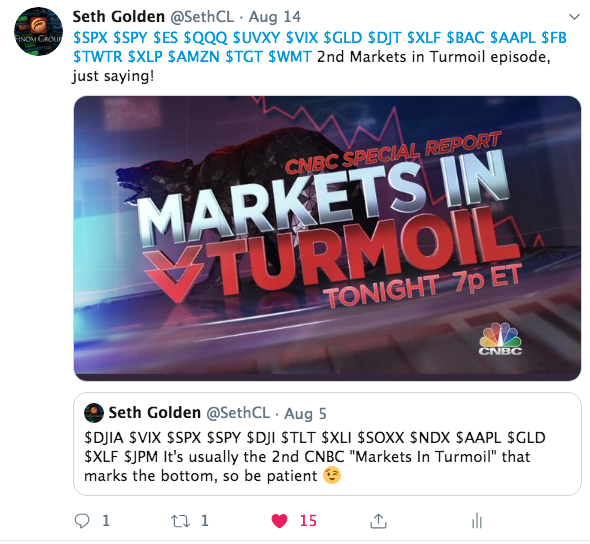
The second Markets In Turmoil was aired the day of the yield curve inversion, for which again, I alerted the fintwit community. Indeed and since, the market had shown itself to have bottomed, at least temporarily.
Usually, market fear is elevated when such special programming is presented to the public and for the purpose of explaining market moves. The programming also aims to guide investor expectations going forward. Having said that, the programming usually only serves to confuse the masses and increase the questions investors have as to what may come next. But with respect to the main point we aim to outline with the Markets In Turmoil commentary, like extreme levels of fear, this tends to be a contrarian indicator. Fear begets opportunity, something we’ve outlined for Finom Group members throughout 2019. We can also see the extreme level of fear in the market from last week’s yield curve inversion day/hours through the CNN Fear & Greed index. Last week, it registered 22 on Wednesday, which proved to be the peak level of fear and signaling a contrarian move was on the horizon.
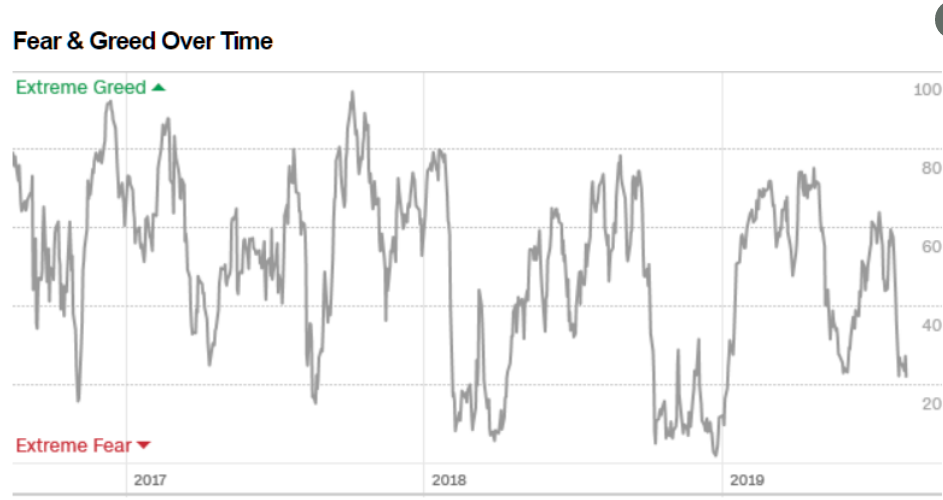
If you were checking your Fear & Greed indicator that day, you were probably on the border between extreme fear and approaching the vast desert of paranoia. The Fear & Greed index was 22. Could it have gone lower, certainly. The index doesn’t know it should stop at 20 and can go significantly lower as displayed above.
With that being said, is the rally over and are we on the verge of finding resistance? The right answer is, “Nobody knows for sure and everyone has an opinion.” Regarding those opinions, J.P. Morgan Chase weighs in with their opinion on the pullback and subsequent rally since last week Wednesday.
“We do not believe that the current pullback will extend for longer than the May one did, and still expect to step in early September, as originally envisaged.
We continue to think that, post the August correction, equities will make new all-time highs into 1H of next year. Having said that, this development nevertheless increases the chances of a potential peak of the market for this cycle in summer 2020.
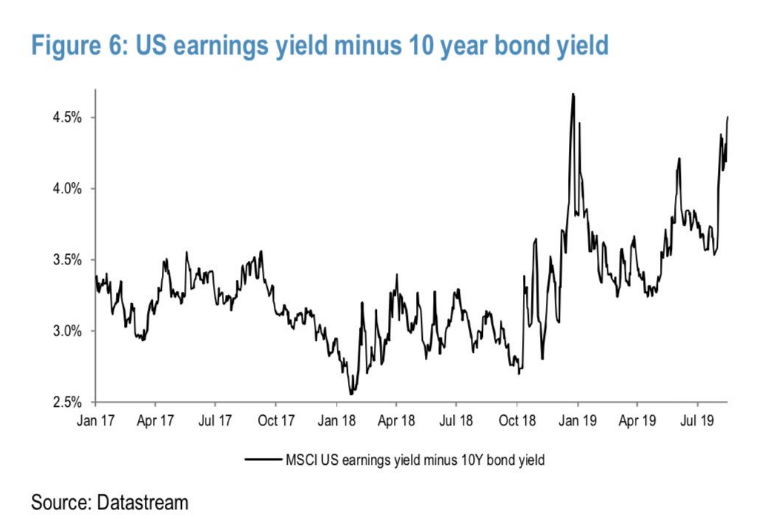
The earnings yield to bond yield gap has improved rapidly, to be close to the worst point of the December fall. This should limit the size of any further downside.”
It is important to note that: 1) there is usually a meaningful lead-lag between the curve inversion and the market peak/recession.“
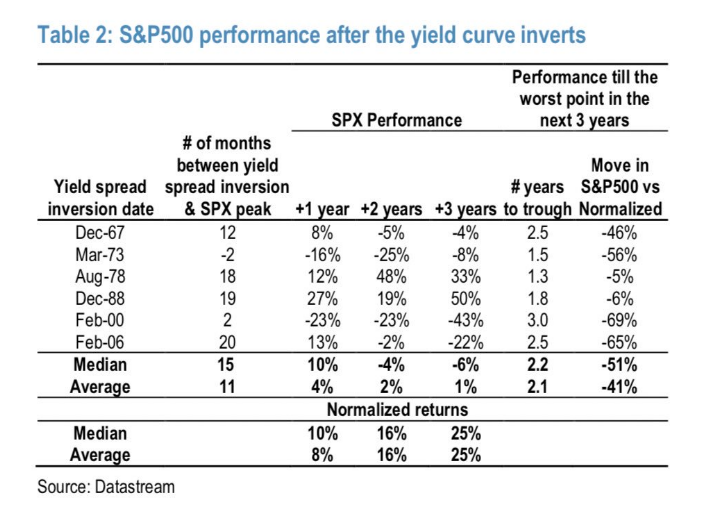
While J.P. Morgan Chase suggests that fundamental market correlations and yield curve inversions lend itself toward additional gains over the next 12 months, at least, CornerStone Macro has another consideration. Carter Worth, the firm’s chief equity market technician suggests we should anticipate and achieve some backfilling from the reflex rebound since last week Wednesday.
“After a bit of backing and filling at the smoothing mechanism, Carter expects the resumption $SPX weakness and a concomitant undercut of the 150-day moving average. The presumption is the June lows are “in play”.
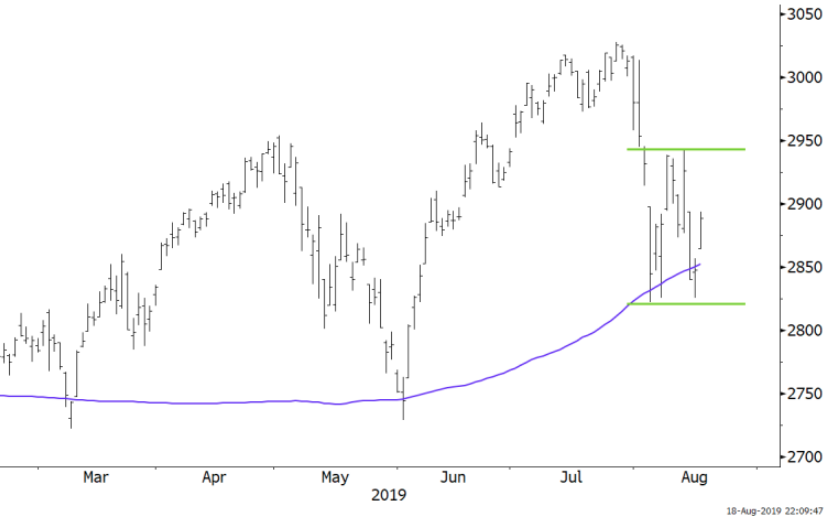
With respect to Carter Worth’s forecast and analysis, there is certainly the probability that June’s lows would come into play. I would suggest that if the S&P 500 cannot clear and close above its 50-DMA near-term, the rally could fail and investors could find themselves in a similar S&P 500 box pattern that played out in Q4 2018. Presently, the box is displayed below:
It’s a widely followed rule that the more times a resistance level is touched, the greater the magnitude of move the index can achieve once it breaks through resistance. However, and of equal importance, typically when the support/bottom level is touched a 3rd time… it breaks and demands a revisiting of more recent lows. This is what took place in Q4 2018 and where market volatility was found elevating significantly. (See SPY chart below)
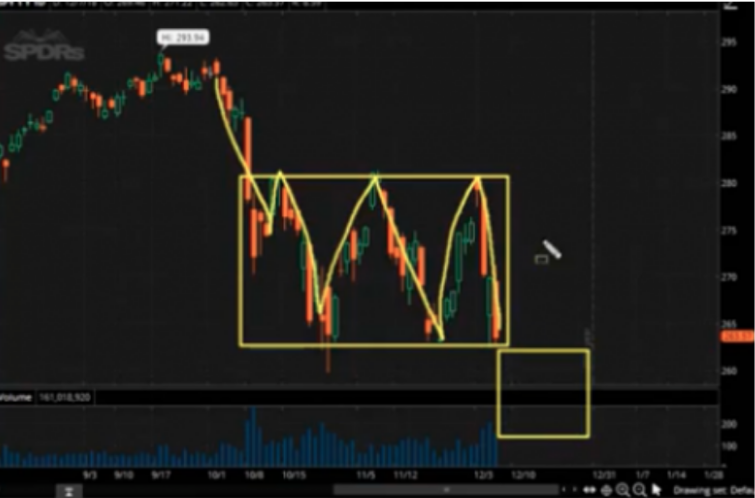
Once the bottom level of the box pattern broke, the market continued to drop without any semblance of support and/or liquidity. It was only when valuations were felt to be at extremes (S&P 500 F12M EPS 13.8) that the market did indeed rebound sharply. To refer back to what J.P. Morgan Chase pointed out, the relative S&P 500 PE multiple with respect bond yields, is near Q4 2018 extremes, which is why the firm believes the current corrective phase will not express a similar retreat expressed in Q4 2018.
When we evaluate the probabilities for market moves near-term and long-term we come to find our more overarching belief that pullbacks should be recognized as opportunities. Of course, not everyone agrees! As always, Morgan Stanley’s chief market strategist Mike Wilson continues to warn investors of more precipitous declines to come near-term.
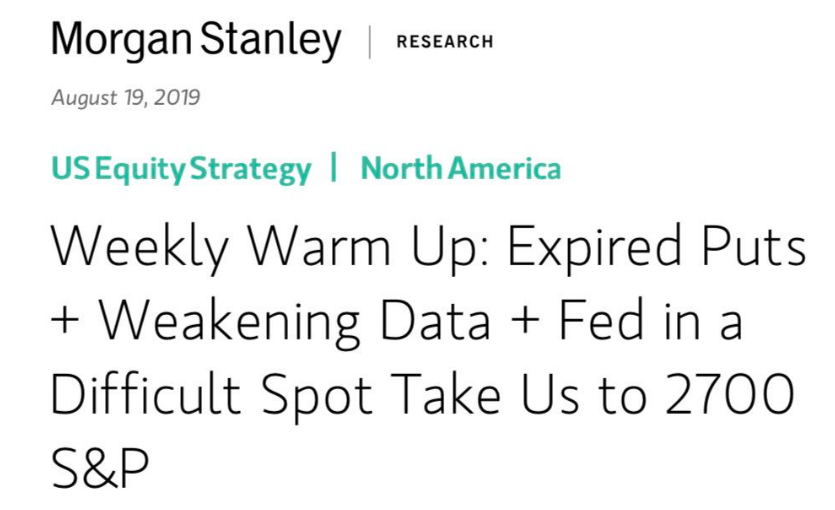
“The Fed/China trade put “has expired. .. leaving investors facing the potential reality there is no second half rebound coming.
The problem is that last month’s consumer confidence reports suggested consumers took the first [Fed] cut in a decade as a potential signal of an oncoming recession which may lead to more frugal behavior. …. a 50bps cut may throw them into a buyer’s strike.”
Projecting forward and through the remainder of the week, we aim to balance the good, the bad and the ugly. I think that 2 of the 3 are represented in today’s Daily Market Dispatch thus far, but remember as we head into the final trading days of August that there remains a very ominous forecast out there from Nomura, for the month of September. And that forecast… that one is “the ugly”.

Nomura quant Masanari Takada said, “the second wave may well hit harder than the first, like an aftershock that eclipses the initial earthquake. At this point, we think it would be a mistake to dismiss the possibility of a Lehman-like shock as a mere tail risk.”
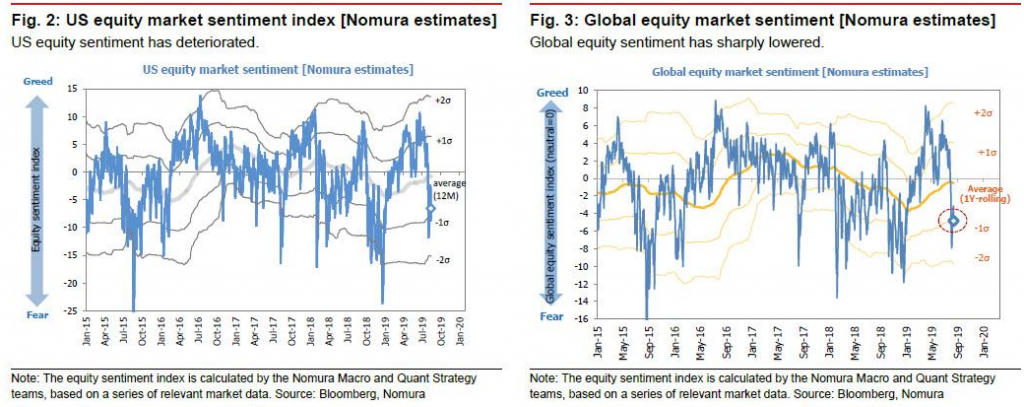
Last week, Takada analyzed the yield curve inversion and its effects on investor sentiment. Nomura’s composite measure of U.S. stock market sentiment swiftly dropped from -2.6 on 13 August to -6.5 on 14 August, while its measure of global stock market sentiment similarly fell from -3.1 to -4.8, both levels not seen since December’s mini bear market.
Takada argued last Wednesday that sustaining the Tuesday rebound on trade headlines would depend on
- the S&P 500 regaining the 2,960 line,
- the VVIX settling down to around 90, and
- a 10yr-2yr UST yield curve that resists becoming inverted.
By all three measures, noted last Wednesday, here is what Takada outlined: “Yesterday’s developments were a complete rout, as the S&P 500 was sold down to 2,840, the VVIX rose to 113, and the 10-2 spread inverted, according to Takada. All of this is to say that the market seems to be experiencing just the sort of tense summer Nomura had anticipated, “raising the likelihood of the second “vol-up” wave that we have been warning may arrive in late August or early September.”
Now since last Wednesday, of course the market has rallied sharply with the yield curve un-inverting, but not yet with the S&P 500 having captured 2,960 or VVIX declining even below 100. Nonetheless, the Nomura quant teams that also include Charlie McElligott, are at odds. Some are more bullish and don’t foresee a Lehman-like event on the horizon. With “the ugly” already outlined let’s take a look at what McElligott’s recent notes outline.
“The “negative convexity/short gamma” flows anticipated were likely to expose into August’s already established “VIX” seasonality (largely as a function of illiquidity and tight VaR/risk limit- constraints) have clearly continued to be the impetus for outrageous price-swings and “rolling volatility shocks” experienced last week.
We are now seeing the “soothing” phase as macro catalysts are now introducing an at least local “Vol Killers” into both US Rates and Equities, including i) the previously mentioned German ‘fiscal stim’ trial balloons, and ii) Trump shifting-back to “good cop” mode on trade/tariffs).”
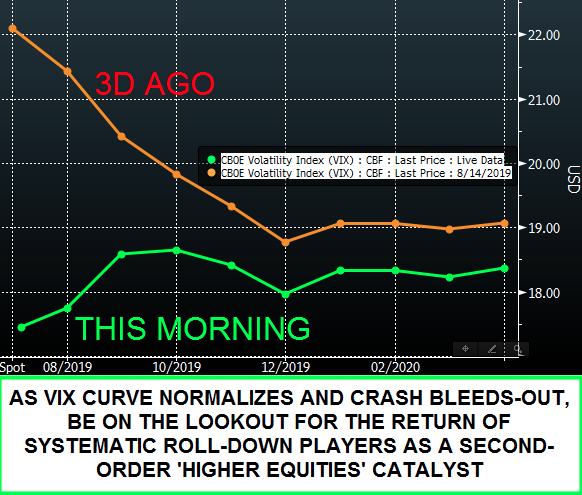
We expect to see an ongoing reversal lower in “spot VIX” levels, and a re-steepening of the VIX curve, “because much of “crash protection” daisy-chain is now likely to be worked-through and re-priced LOWER as said hedges ”bleed” (the month-long accumulation of tail hedges both due to macro trade risks over the course of August, as well as the offsetting hedges for Options Dealer Desks to the “50 Cent” VIX “call wing” flows and knock-on impact in SPX downside skew).
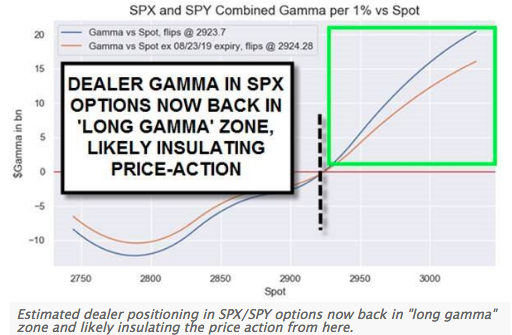
Away from VIX, traders will keep a close eye on the reversal of the recent dealer “short gamma” trade as algos scramble to go long gamma, and unwind the past 3 weeks-worth of manic seemingly “irrational” and chase-y price-action.
Boy-oh-boy, Takada and McElligott really have a different take on the macro picture, which is clearly putting their market forecasts at odds. To be clear, however, what is most important to rationalize is that these are just forecasts with criterion. Levels have been assigned to the individual outlook alongside market exposure dynamics. For either forecast to come to fruition, the market still has work to do for the week ahead.
As it was on Monday, there is no relevant U.S. economic data on the docket. On Wednesday, investors will be privy to the latest FOMC minutes from the July meeting. The minutes will be released ahead of the anticipated Jackson Hole event. Below are some thoughts from Deutsche Bank on the upcoming event.
- The event officially kicks off on Thursday however we won’t hear from Fed Chair Powell until the Friday at 10am EST/3pm BST.
- The theme for this year’s conference is the sufficiently vague “Challenges for Monetary Policy” however expect the market to be leaning on every word Powell says especially given that there’s been relatively muted Fedspeak in the wake of the July FOMC meeting.
- Obviously since then we’ve had a ratcheting up in the trade war, slowing global growth and the massive focus on the inversion of the yield curve last week.
- We’re still pricing in around two and a half more rate cuts this year so the bar for Powell to be dovish is clearly fairly high. All that to look forward to.
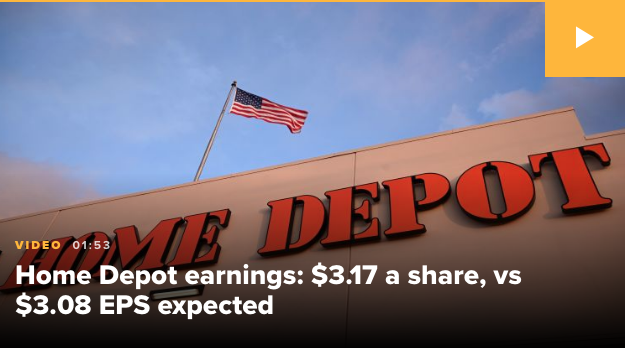
Retail earnings continue to roll out as we finalize the Q2 earnings season. Home Depot reported mixed results ahead of the opening bell on Tuesday and revised lower its outlook on the premise of tariffs to be imposed. Here’s what Home Depot reported for the fiscal second quarter of 2019 compared with what analysts were expecting, based on Refinitiv data:
- Earnings per share, adjusted: $3.17 vs. $3.08 expected
- Revenue: $30.84 billion vs. $30.99 billion expected
- Same-store sales: up 3% vs. growth of 3.5% expected
Net income for the quarter ended Aug. 4 was $3.48 billion, or $3.17 per share, compared with $3.51 billion, or $3.05 a share, a year ago. That beat expectations for earnings of $3.08 a share, based on Refinitiv data.
Sales climbed 1.2% to $30.84 billion from $30.46 billion a year ago, short of expectations for $30.99 billion. Sales at Home Depot stores open for at least 12 months were up 3% overall and were up 3.1% in the U.S., short of expectations for growth of 3.5 percent.
Home Depot is now calling for fiscal 2019 sales to be up about 2.3%, and same-store sales to be up about 4%. Previously, it was calling for total sales growth of 3.3% and same-store sales growth of 5 percent. It’s still expecting earnings per share to grow by about 3.1% to $10.03 for the year.
More retail earnings will be delivered Tuesday by TJ Maxx (TJX) and Kohl’s (KSS). Just last week, Macy’s sent a shiver down the spine of investors after dramatically missing its EPS forecast for the Q2 period. Wedbush took the report as a potential indication of what may come from Kohl’s and reduced its price target on the company stock from $58 to $48. There’s already somewhat of a low bar set for Kohl’s ahead of its earnings release, Analysts are expecting merchandise revenues to dip by nearly 2% YoY. Consensus estimate points to even sharper deterioration in EPS, forecasted at $1.53 vs. last year’s $1.76.


