

Research Report Excerpt #1
Recall that prior to May’s, 6%+ month-end rally, the S&P 500 was down 7 consecutive weeks. This was the longest weekly down streak since 2001, which fell 8 straight weeks (and was tied w/ 1970 for the record). Here’s a look at what happened following the longest down streaks in history.
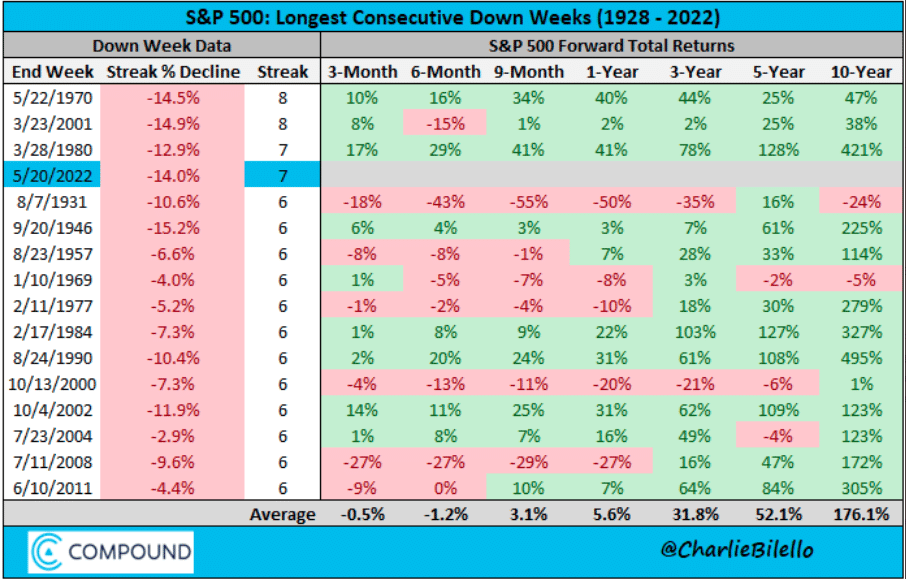
A little deeper digging into the former consecutive weekly losing streaks for the S&P 500 reveals what investors might anticipate going forward. In order to distinguish the potential path forward from here in 2022, using quantitative data, we will need to sequence the data appropriately.
In 1970 and 2001, each downtrend of this magnitude (7 straight weeks or more) has marked the low for at least 6 months. The only reason why 2001 found a new low 6+ months later was due to the 9-11 attack. As a reference point that investors/traders may wish to file away, **the S&P 500 closed at 3,901 at the end of the 7-week losing streak on May 16, 2022. The market was higher 3 months later after every like-losing streak in the past, even if the sample size has proven very small.**
Research Report Excerpt #2
The following table, from Chris Ciovacco, recognizes the occurrences of BTBT days since 1970. And as we can see from the quantitative data’s results, forward looking returns still appear quite favorable.
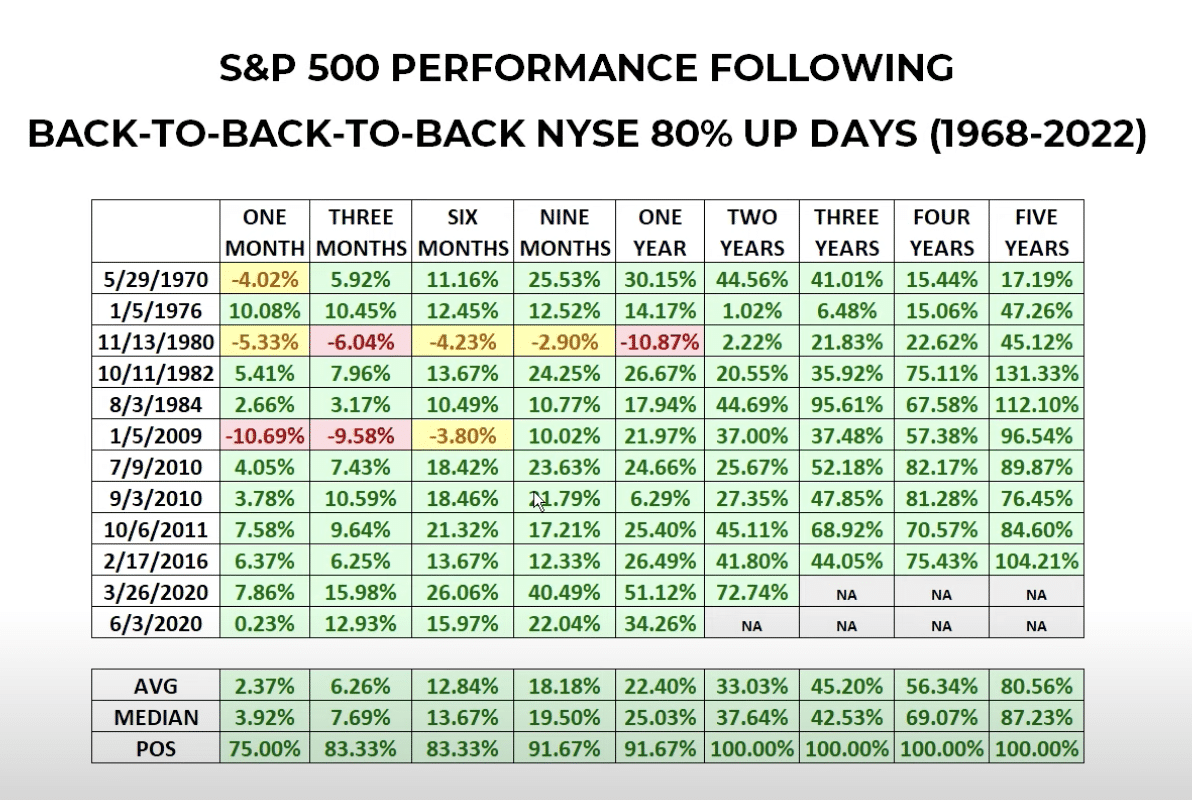
In looking at the table above, it’s rational to ask ourselves if the current BTBTB signal could result in a 1980 or 2009 drawdown. What about the 2001 LOSING STREAK that also resulted in lower-lows 6 months later. What I would suggest is that it certainly could be, but let’s dig a little deeper into market signals like the recent Demark TD COMBO that was also revisited last week.
Research Report Excerpt #3
As gasoline prices rise week-over-week and YoY to record levels, we understand from history that this rise in gasoline prices slows economic activity and GDP growth. The table/chart below identifies that, historically, even gasoline above $3/gallon at the pump doesn’t necessarily tilt the economy into a recession. Having said that, we don’t have a history to suggest what happens with gasoline averaging well above $4/gallon at the pump.
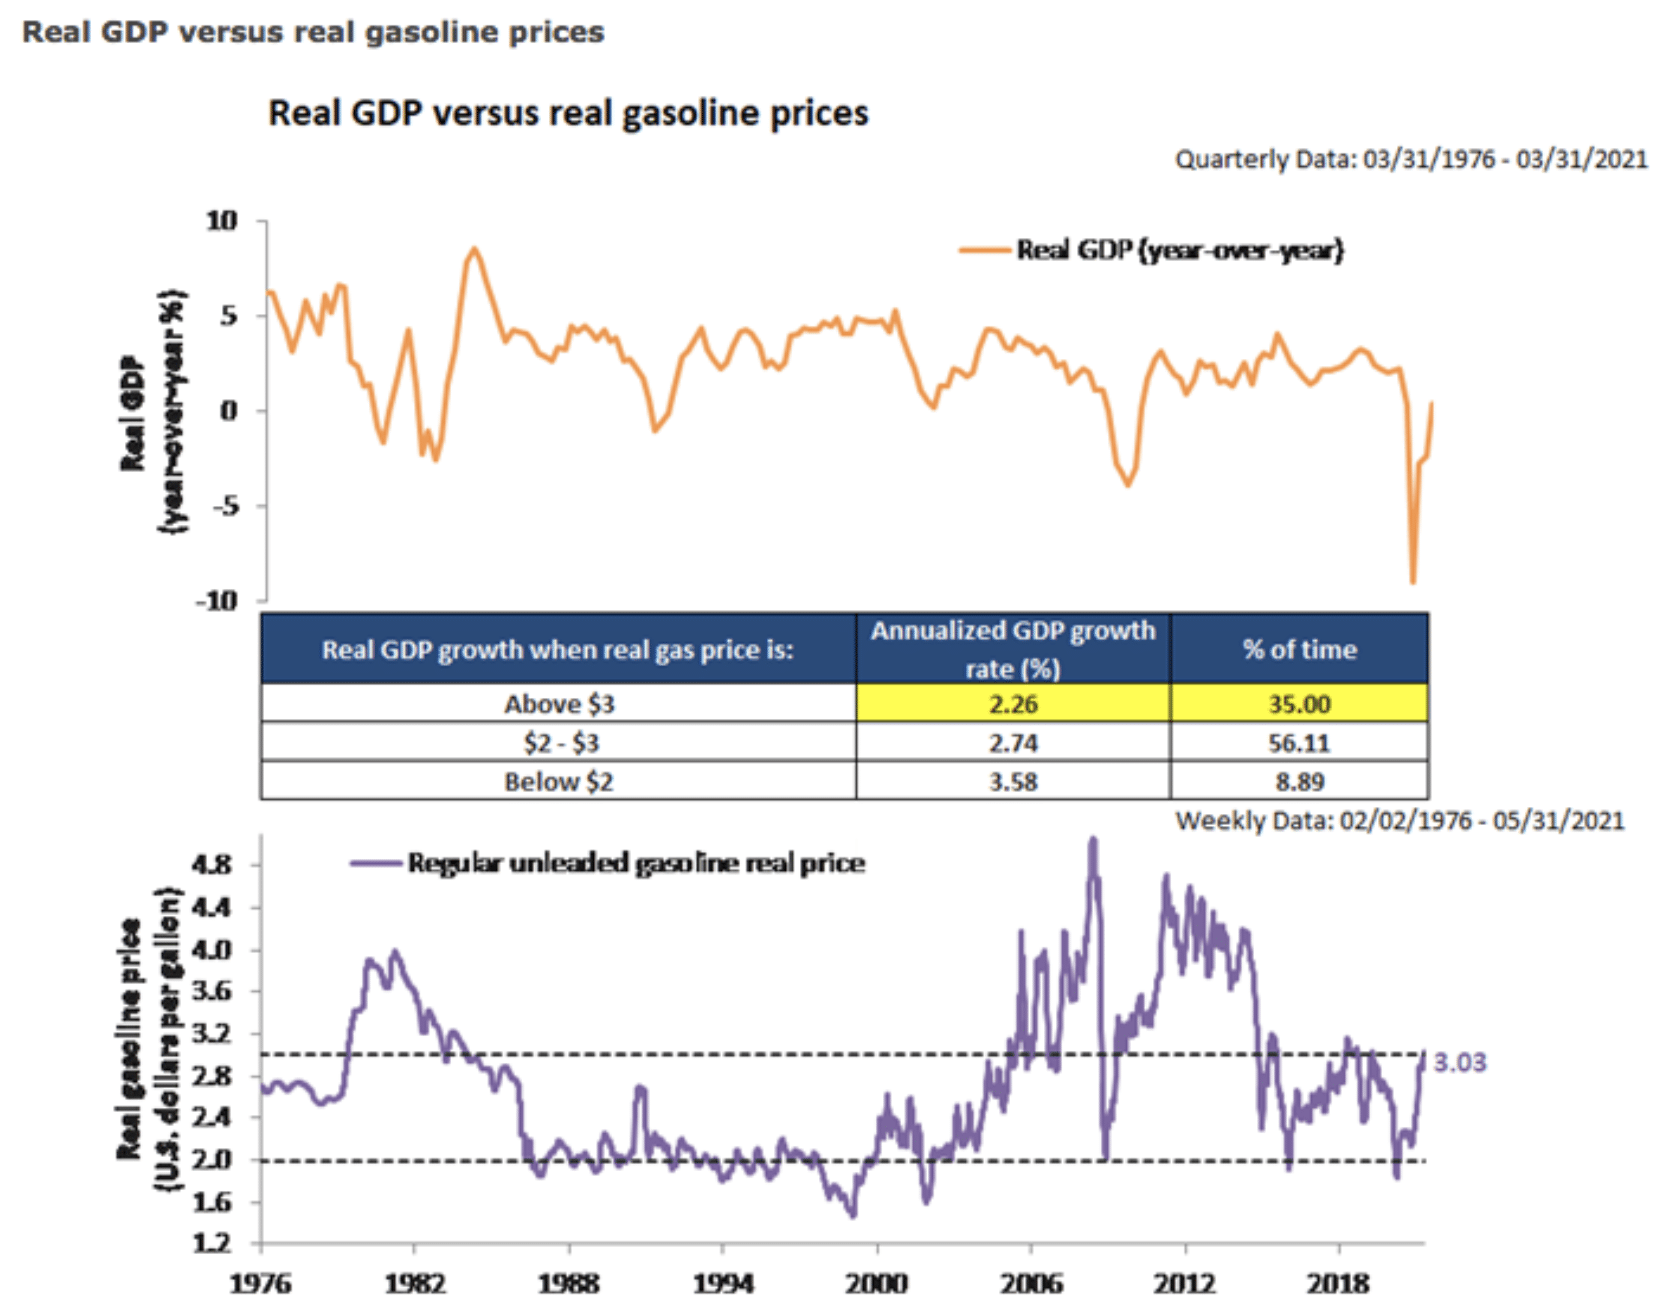
Given this dynamic, we have to remain open minded to the potential of further economic slowing should gasoline prices remain elevated through the summer months, which is typically peak seasonal pricing.
Research Report Excerpt #4
Bank of America Card spending data suggests it may already be showing up and since the end of the month of May, when gasoline prices averaged $4.50/gallon nationally.
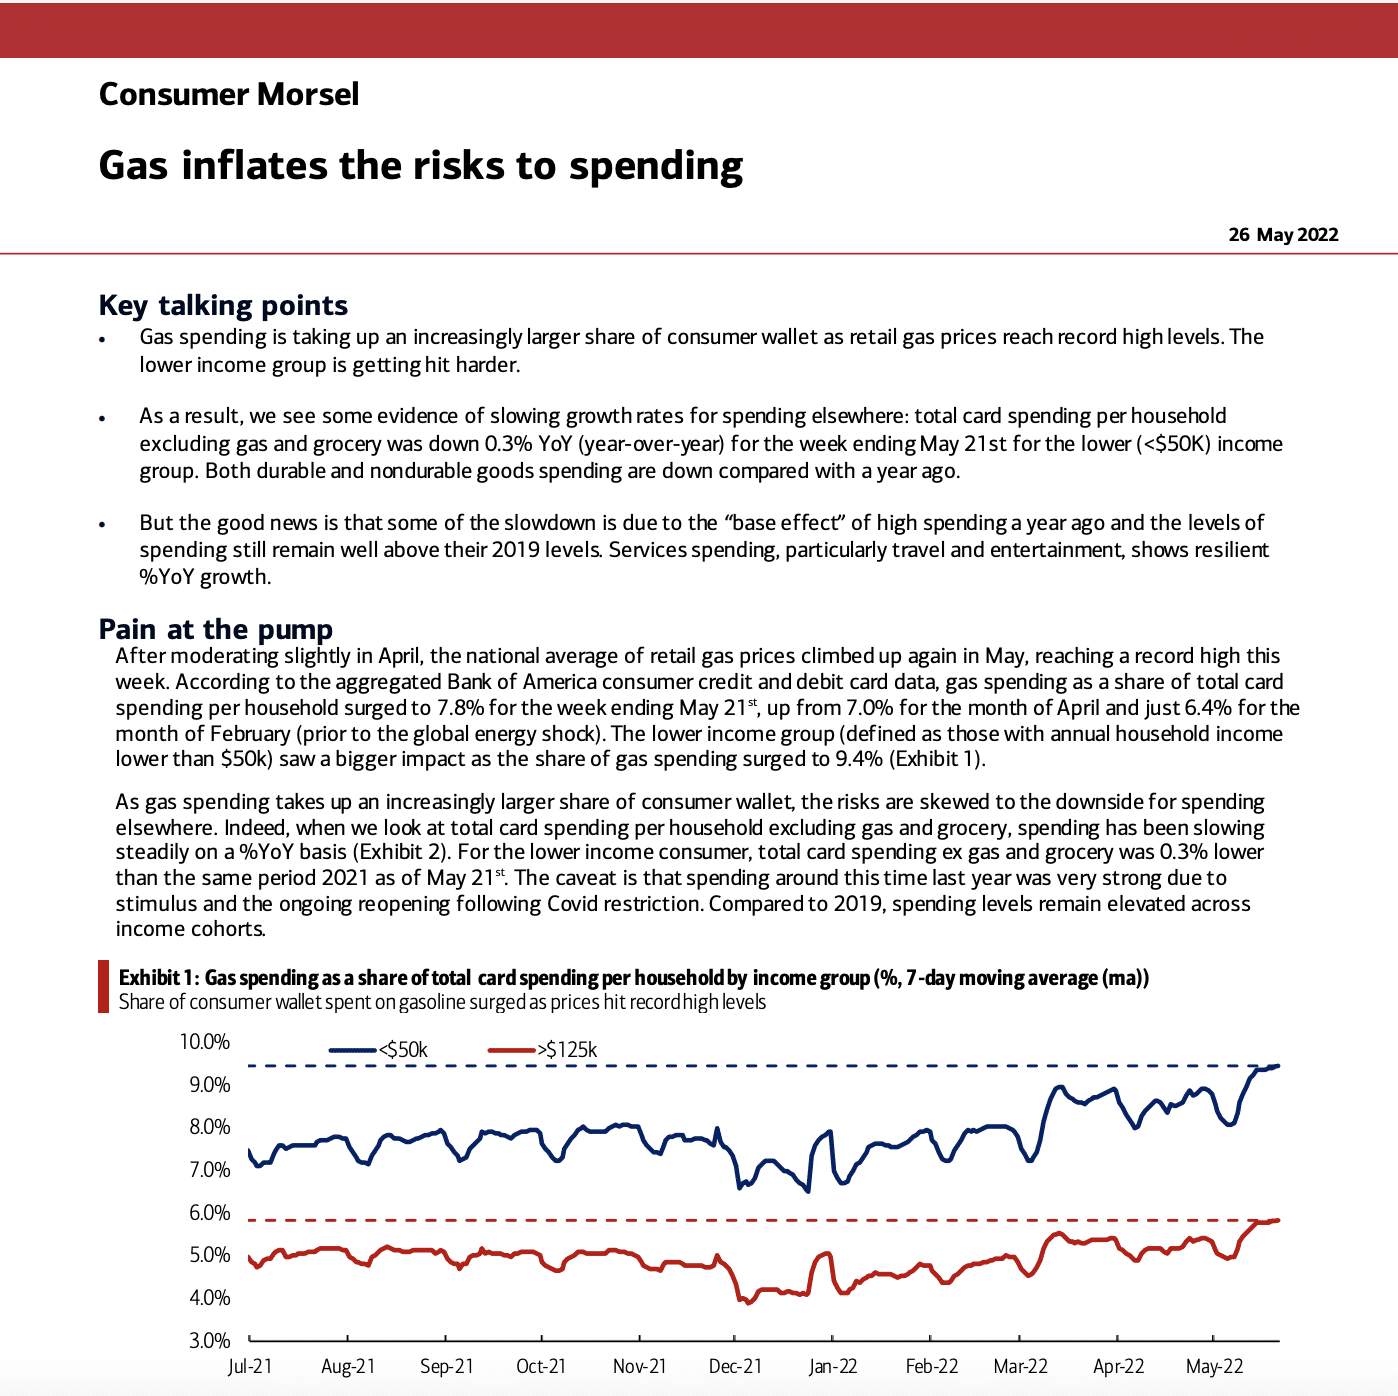
There is likely some diverting or delaying of discretionary spending (ex-energy and food), due in part from the rise of the price at the pump. Whether or not it is sustained pressure remains to be seen.
Research Report Excerpt #5
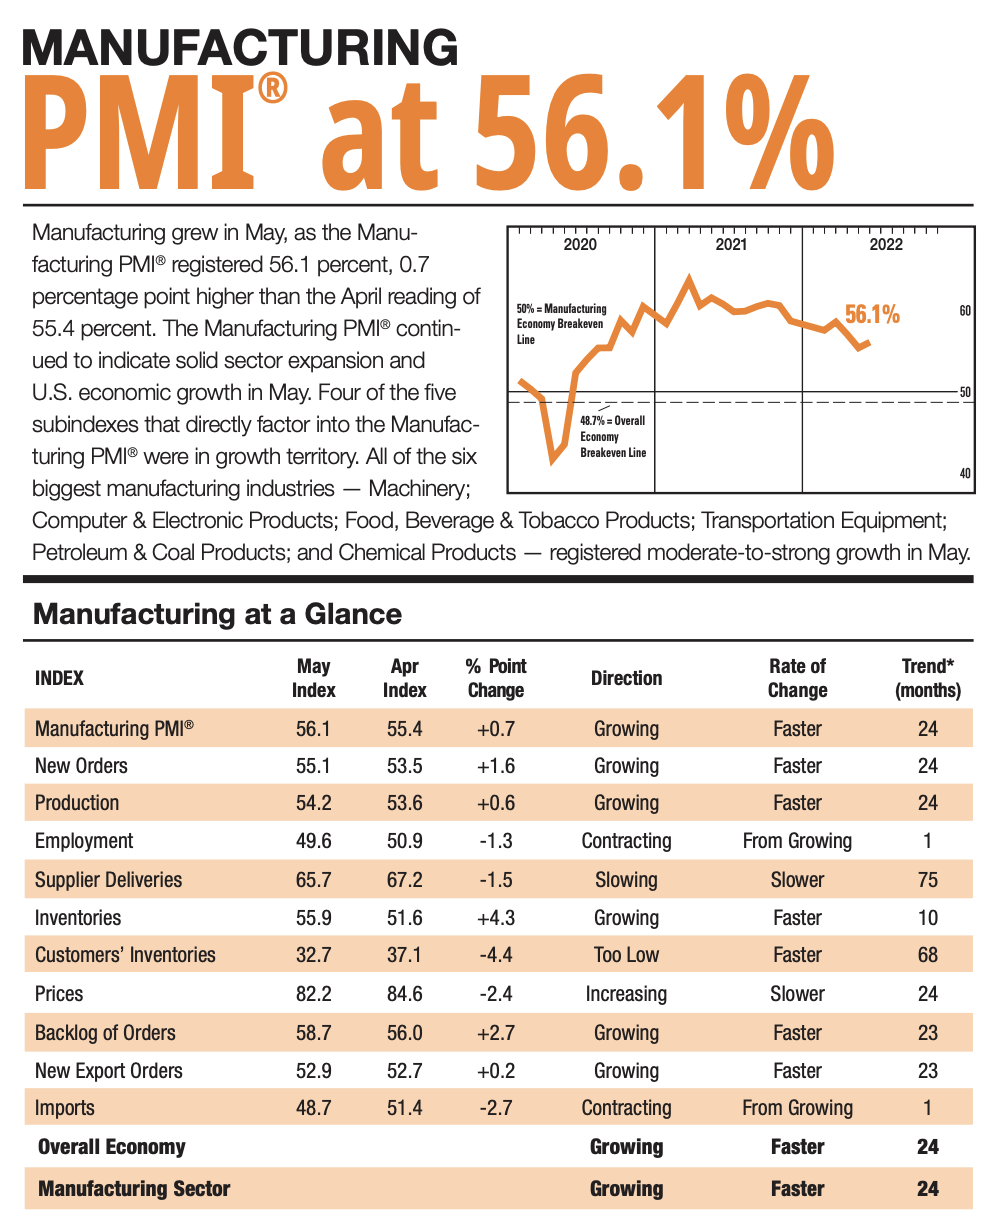
“The May Manufacturing PMI registered 56.1 percent, an increase of 0.7 percentage point from the reading of 55.4 percent in April. This figure indicates expansion in the overall economy for the 24th month in a row after a contraction in April and May 2020. This is the second-lowest Manufacturing PMI reading since September 2020, when it registered 55.4 percent. The New Orders Index reading of 55.1 percent is 1.6 percentage points higher than the 53.5 percent recorded in April.”
Research Report Excerpt #6
Research Report Excerpt #7
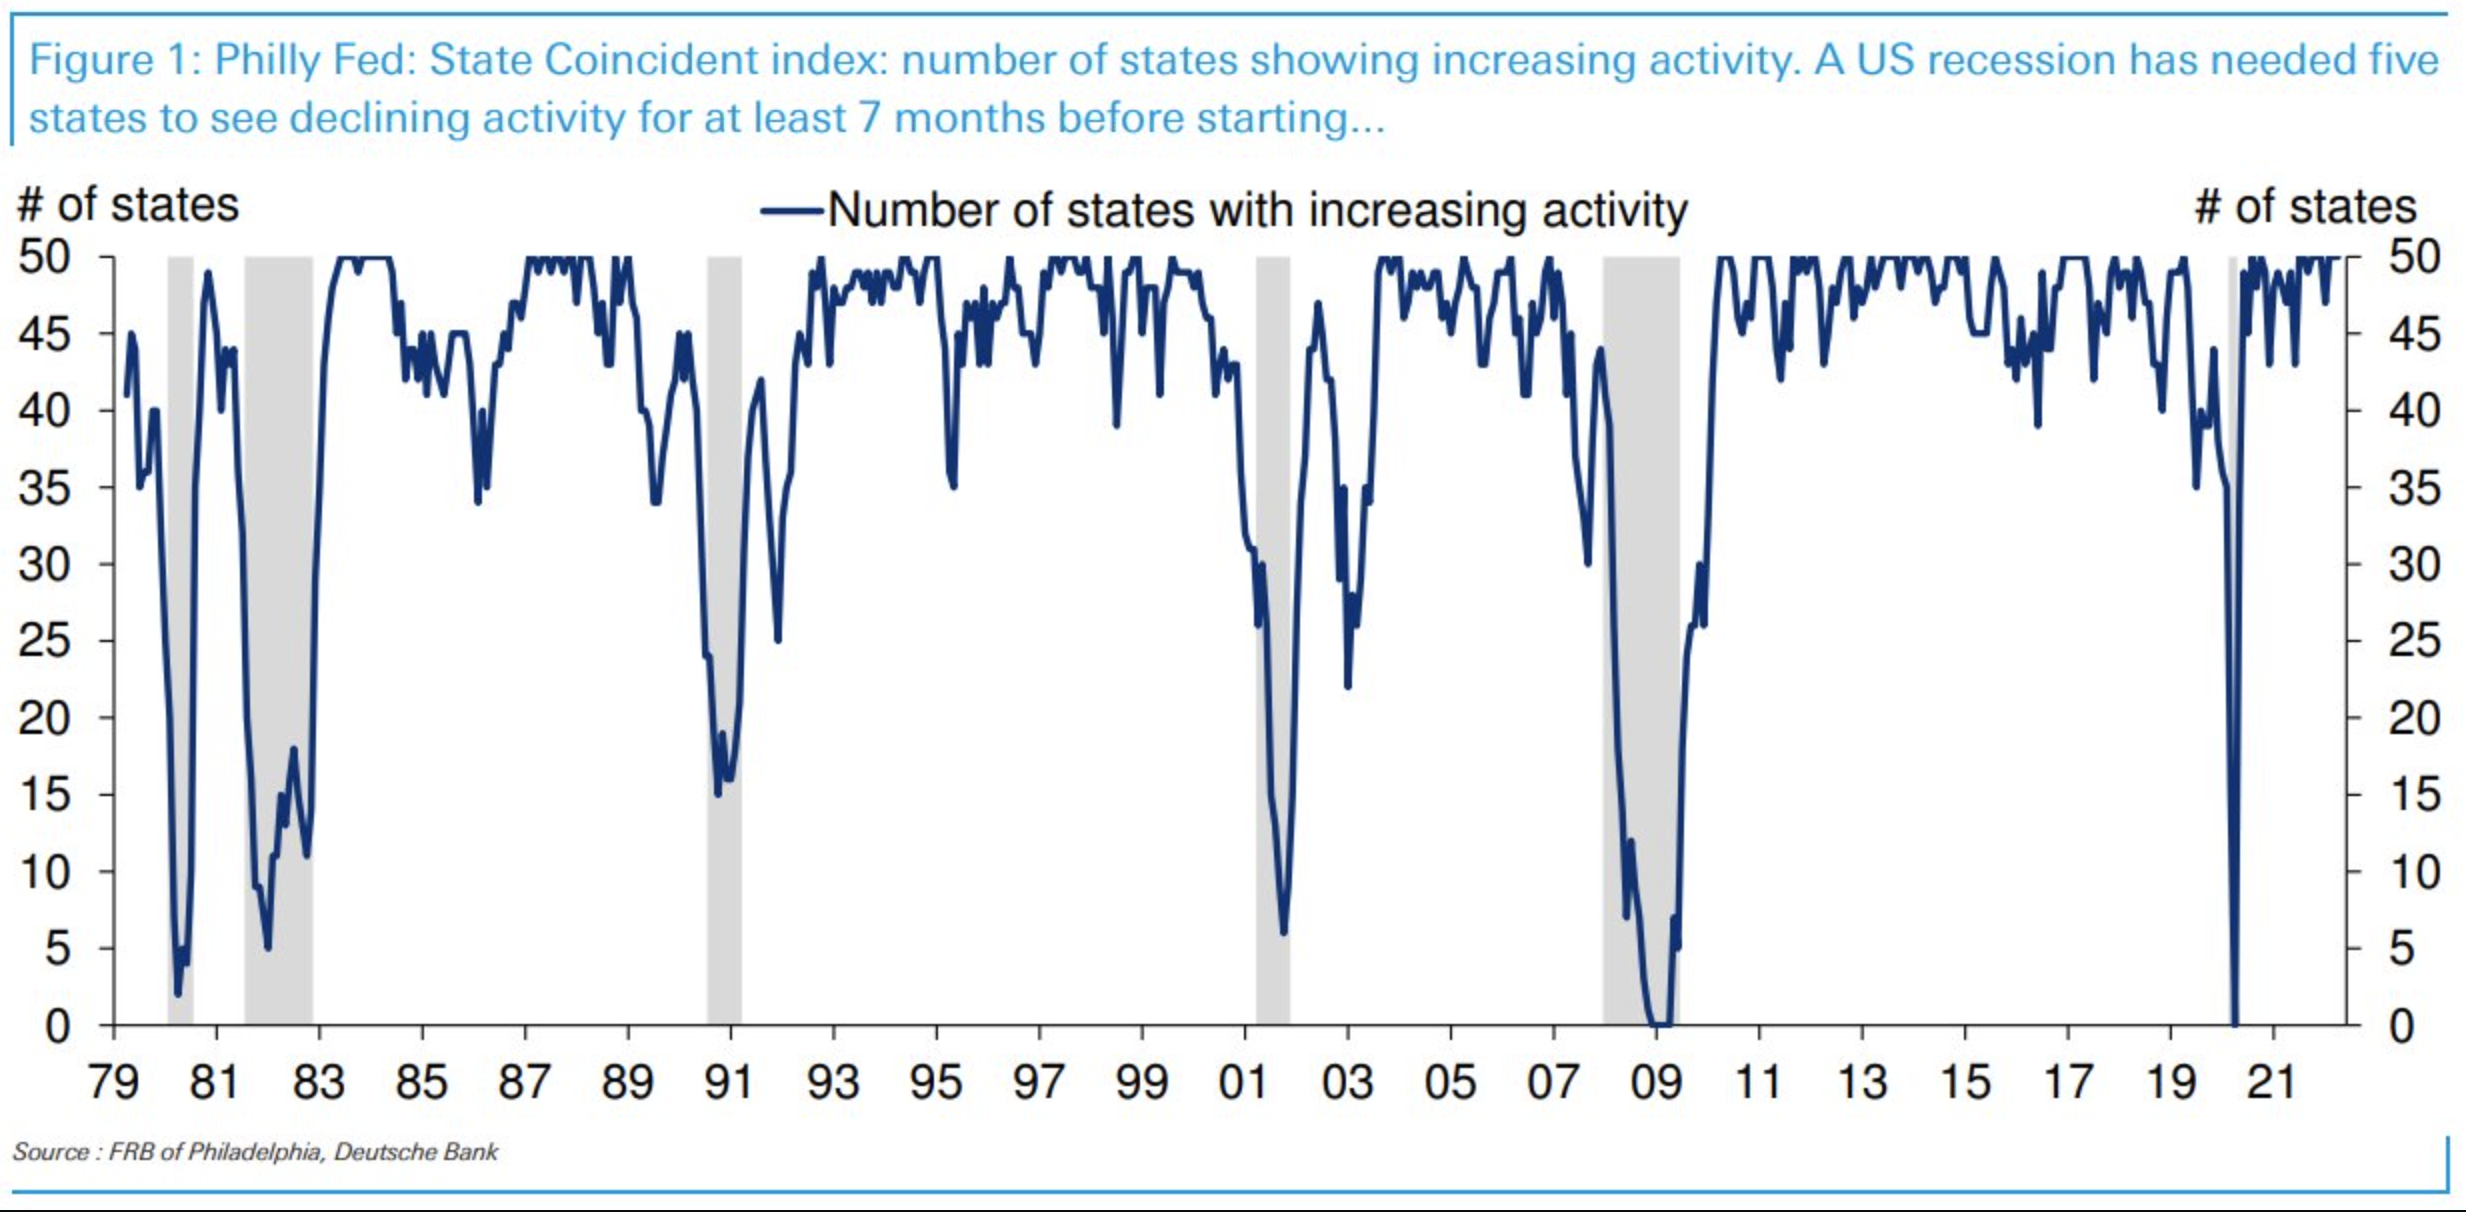
“Consider the chart above, via Matt Luzzetti of Deutsche Bank. It shows the Federal Reserve Bank of Philadelphia’s monthly State Coincident Indexes. I cherry-picked this chart because of its good historical track record of showing a drop before recessions, and because by its nature, it includes diffusion (50 states) and duration (time series) — that is 2 of the 3 NBER contraction factors.
When we do a “Compare & Contrast” of 2022 with each of the 6 prior recessions going back 43 years to 1979, we see none of the early signs of contractions in any of the 50 states. This data series has shown an early warning that recessions were increasingly probable. But the state-by-state slowings took several quarters or even years to develop. Instead of 50 states showing expansion, before recessions, that dropped to 45, 40, then 35 before the recession began (and the number of expanding states fell to 10, 5, or 0).
The current monthly coincident state index shows all 50 states economically expanded. That not only makes it impossible for us to be in a recession today but also makes it highly unlikely we will be in a recession anytime soon.”
Research Report Excerpt #8
Building upon these notes from last week, I offered this data from The Leuthold Group in a Sunday afternoon tweet last weekend, as follows:
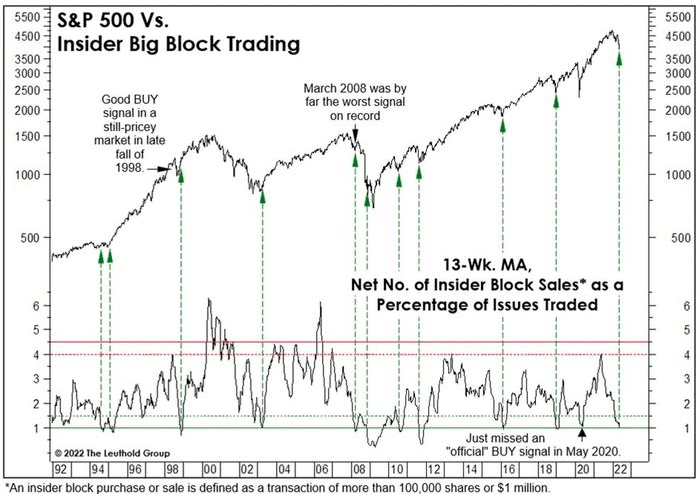
If the 13-week average of Net Insider block sales dips to 1.0 (which it has), it has signaled near/at market low since 1990. There has only been one false positive signal, in 2008. The average S&P 500 return 12-months forward since 1990, post the Insider Buying signal, has been 18.5 percent.
Research Report Excerpt #9
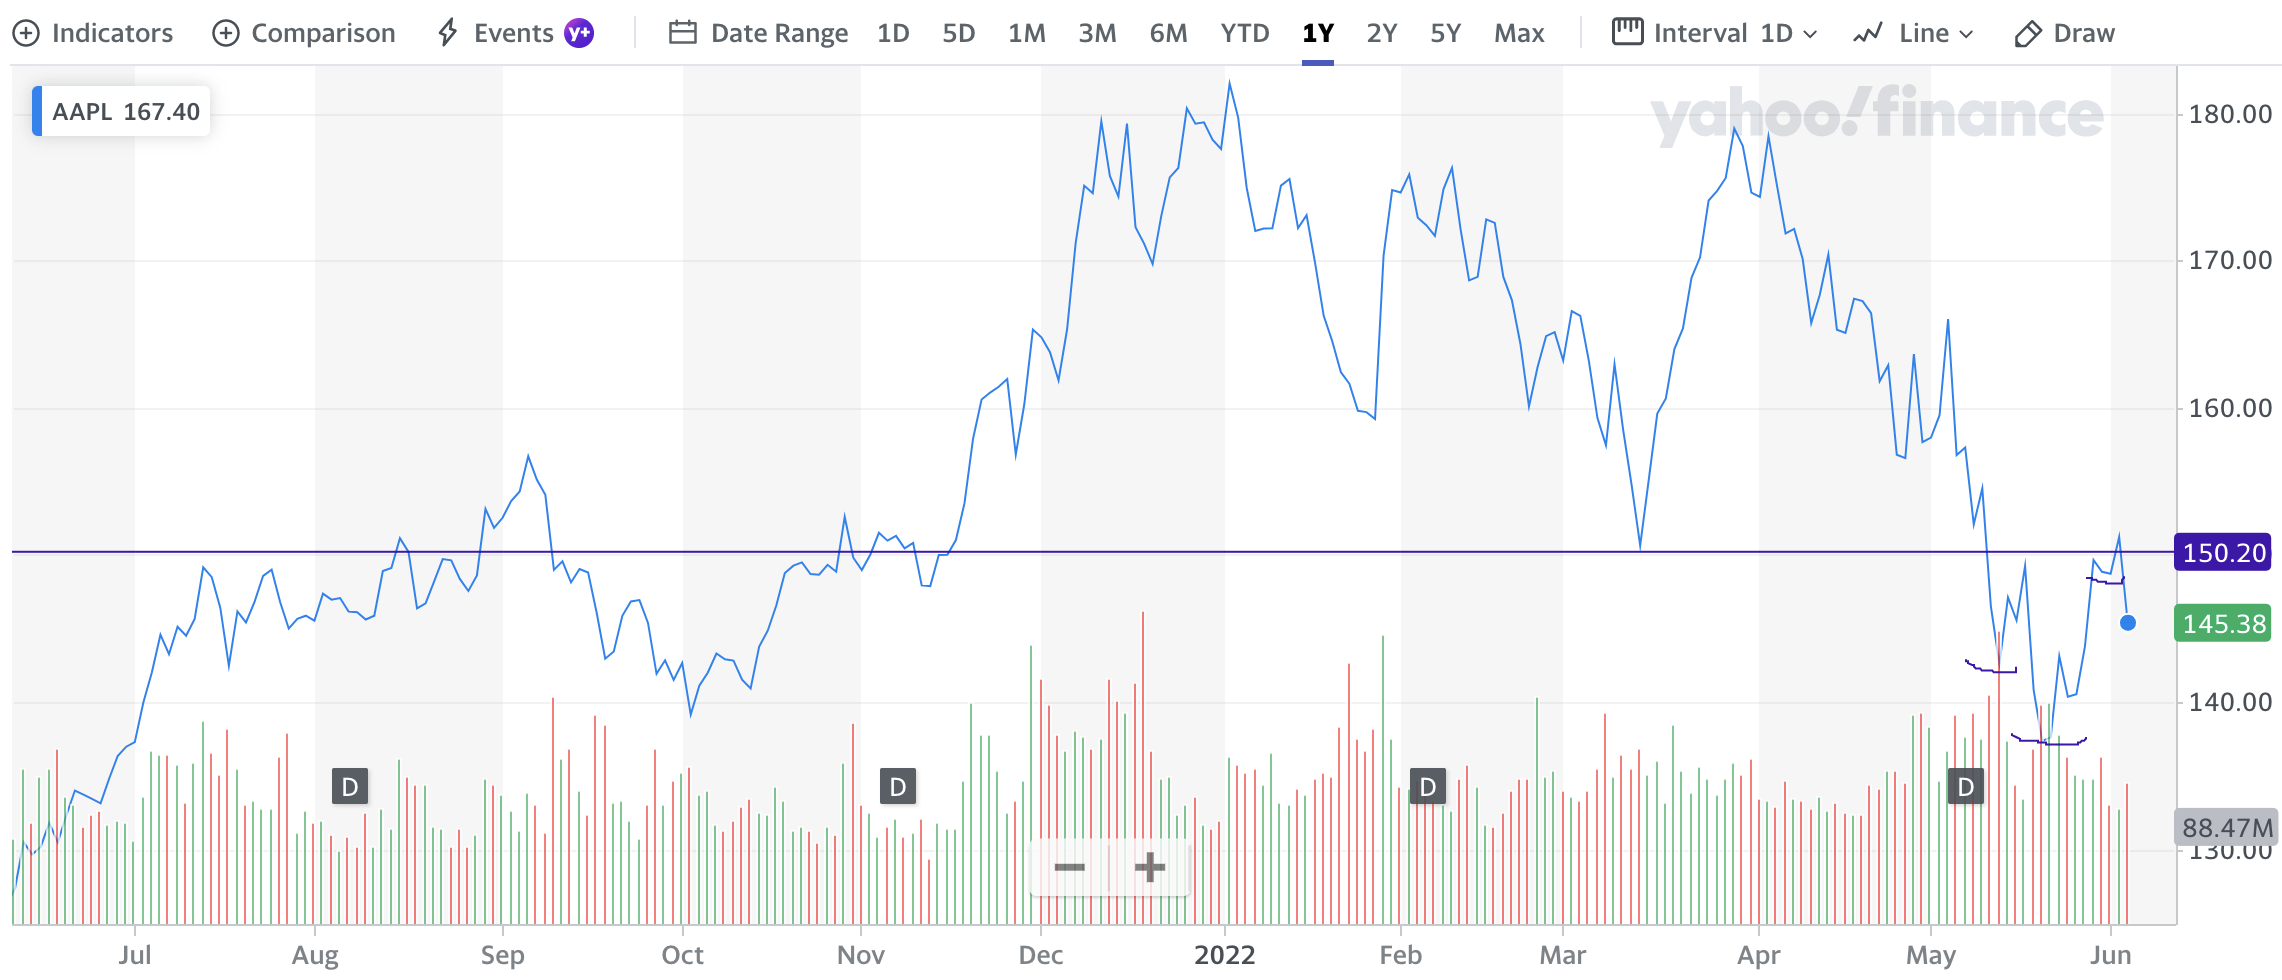
I would view potential weakness in the Apple outlook or share price performance as long-term opportunity, and look to recapture shares on such weakness for the Golden Capital Portfolio (formerly sold significant exposure from $175 to $183 in 2021). Technically, there is a pretty well-defined inverse head-n-shoulders pattern, with the right shoulder proving higher than the left shoulder.


