
The market is euphoric right? No, not by a long shot. The forward 12-month P/E ratio for the S&P 500 is 16.2. This P/E ratio is equal to the 5-year average 16.2. Do you really believe an equity market can express euphoria for a 5-year period? Clearly, the recent February-April period of market correction and consolidation makes the recent market rally appear euphoric. That is the very reason investors need to better understand the markets valuation going forward. Investors and traders alike can get caught up in the moment and fail to see the bigger picture that is expressed through valuation over time.
The major averages all rocketed higher in Wednesday’s trade on Wall Street. The Dow led the way with a 1.4% move higher, finishing above the 25K mark for the first time since February. The S&P followed the Dow to a lesser degree, finishing higher by .86% and strongly above recent resistance of 2,750. Oddly enough, the tech heavy Nasdaq, lagged with a mere .67% gain on the day. With equity markets in full-bull mode as of the last 30-40 days, the VIX has steadily declined and finished with a reading of 11.64 on Wednesday.
With equities in rally mode, bonds yields have been creeping higher over the last week and since selling off due to issues surrounding Italy’s failure to formulate a government. The 10-year Treasury note yield rose 5.9 basis points to 2.975%, its highest since May 24. The two-year note yield was up by 2.8 basis points to 2.520%, and the 30-year bond yield climbed 5.7 basis points to 3.13 percent. The spread between the 2 and 10-year Treasury yield is threatening to continue to flatten and eventually invert. With the Fed expected to hike rates in the month of June, the closer we get to the action, we would expect equity investors to express greater caution with respect to allocation.
With the bull market now in its 9th year (depending on where one believes it began, 2008 or 2009) many market bears continue to drive the mantra that the market should crash in the near future. The reality is bull markets are not dependent by time or schedules. There is no expiration date assigned to a bull or bear market. Markets expand and contract for a great many reasons.
This has been the 2nd greatest bull market since World War II. The chart below from The Leuthold Group shows the performance of the prior 12 bull markets along with the current one.
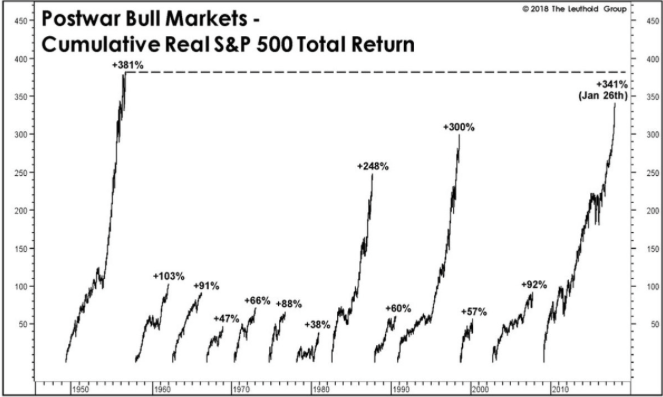
- A significant reason for this bull market cycle is the expansion of the tech sector. In the 1990s, most tech stocks were in a speculative bubble because the companies had no earnings to support their valuations. But that is not the case with the tech sector of this bull market. Earnings are real today and some of the sectors within the overall tech sector produce outsized profits and revenues.
- The current bull market resides within an elongated business cycle. This lengthened cycle is due to the initially slow recovery from the financial crisis, which took a psychological toll on the economy.
- The Fed’s easy monetary policy has also helped the situation, even with the current hike cycle, which has been the slowest hike cycle since 1977.
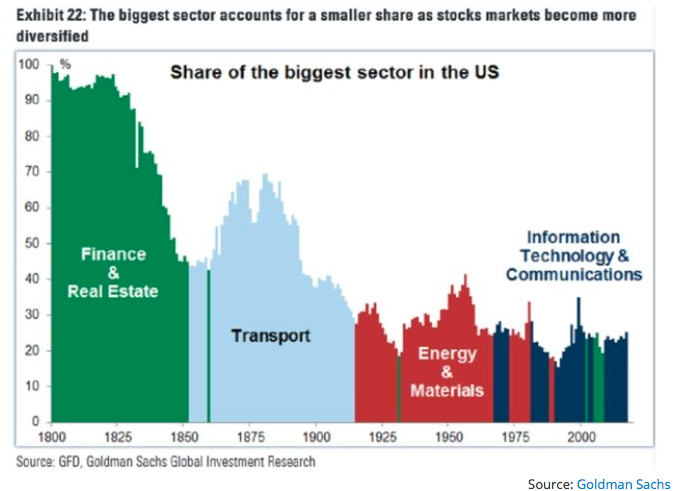
- The tech sector is now the biggest sector in the market as most of the world’s largest firms are involved with the mobile Internet. The country went from being dominated by finance, to transportation, to energy, to tech.
- The performance of the Internet stocks is very important to the current bull market. They are the market leaders.
- The valuation of a country’s equity market is partially determined by sector dispersion. America, China, and emerging market Asian Pacific nations have the largest tech sector weightings.
So is the market in a bubble? Finom Group does not believe the market is in a bubble, but we can appreciate that there are many definitions for which to suggest a bubble is a bubble. The 10-year forward 12-month S&P 500 market average PE is just 14.3 when compared to today’s 16.2 forward 12-month PE. Of course, that 10-year average is greatly impacted by the 2008 financial crisis. As such, again, it’s a matter of perspective and how one chooses to define an inflated market or bubble. Having said that, we would suggest that the market is always right and choosing to fight the market can prove costly.
Seeing how the tech sector has become so overtly important to the current bull market cycle, let’s discuss some of the more important stocks within the tech sector. Jim Cramer coined the term FANG several years ago and largely due to the strength of just a few stocks that make up a significant portion of the tech sector and S&P 500 today. Tracey Reyniec of Zack’s Equity Research recently explored the valuation of the FAANG stocks as follows:
Do the FAANG Stocks Have Stretched Valuations?
- Facebook is trading with a forward P/E of 25.3. This is the cheapest it has been since its IPO. In that year, in 2012, it had a median forward P/E of 198.
- Apple has been a value stock for years. Just 2 years ago, in 2016, it traded with a forward P/E of just 12. It’s not surprising that that’s when Warren Buffett started to buy. It currently trades with a forward P/E of 16.7, which is its highest in years but is in line with the S&P 500.
- Amazon has never been about a P/E. But Dave points out, that if you look at other valuations, such as the P/S ratio, which is just 4.29, it doesn’t seem overly expensive.
- Netflix has never been “cheap”. Back in 2012, before the Crown, it was trading with a median forward P/E of 2,190. It has a P/E of 125 now. But investors are buying the growth story.
- Alphabet/Google was cheapest in 2012 when it traded at 17x. Since then, it’s traded in the 20s. It’s current forward P/E of 28 is the most expensive the stock has been on a P/E basis in 6 years.
Finom Group’s chief market strategist Seth Golden believes one of the more attractive FAANG stocks is indeed Facebook. Expressing its lowest valuation since its IPO, but with a massive moat around its business and growing ad revenues some 50% in Q1 2018, Golden believes the stock has much room to run. The median price target amongst sell-side analysts in nearly $220 a share with most every analyst maintaining a Buy rating on the stock. On the whole for 2018, the company is expected to grow revenues some 39% on earnings of nearly $7.75 a share. What’s not to like? Well, headlines. If you’re trading the stock headlines can certainly pose a risk given the recent scrutiny around how the company shares the data it gathers from its user base. What traders and even investors might miss through the sensationalist headlines is that regardless of the scrutiny of the company’s data sharing practices, Facebook ad customers have no bigger competing audience to participate with. It simply does not exist. We’ve never heard the likes of Coca-Cola, General Motors, Kraft or any other company say, “I wish had a smaller audience to market our products.”
So what could derail the current bull market cycle? Good question, but not a terribly complex one. Equity markets follow corporate earnings. As corporate earnings remain expansionary, throughout history, equity markets climb higher. Certainly they have fits and starts with geopolitical issues and general fears that arise in the economy from time to time, but overall as corporate earnings go so do equity markets.
A recent index reading surrounding this very question was examined in the Lloyd City Risk Index survey. Man-made risks like cybercrime and interstate conflicts rank among the biggest threats to the world’s cities, according to this year’s Lloyd City Risk Index. And the No. 1 threat? A financial market crash. The Lloyd City Risk Index, which was created in collaboration with Cambridge University, measures the impact of 22 threats on 279 cities’ projected economic output. Should a financial crash occur, the world would lose an estimated $103.33 billion in economic output, according to Lloyd’s analysis.
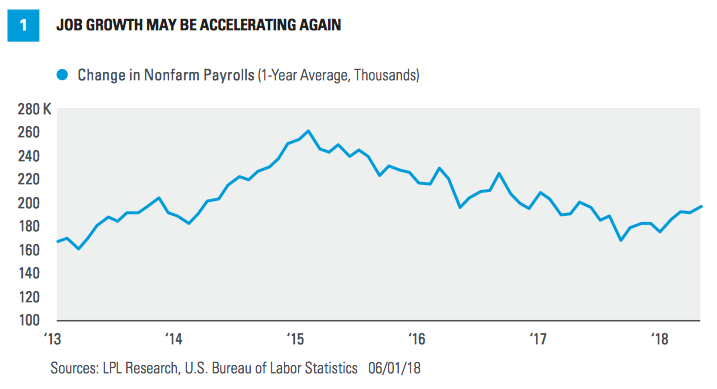
Market crashes generally occur due to some form of excess colliding with some form of deficiency that is left for resolution. While many point to longevity, rising rates, yields, debt:GDP, trade tariffs and many other geopolitical factors that impact investor sentiment, these headline risks will have to impact economic activity and corporate earnings before they ever produce the end of the bull market cycle. With that being said, one of the more substantial supporting aspects of the current bull market cycle and economic expansion continues to be job growth.
Average yearly job growth peaked at 261,000 in February 2015, and has gone through a natural slowing process since. Nevertheless, job growth remains at very healthy levels for this point in the economic cycle. Also of great importance with respect to the labor market and job growth is the recent uptick in the number of jobs created as depicted in the graph below.
With expectations already in place for the economy to accelerate after a slow first quarter, the jobs report confirmed the current U.S. economic outlook. The Atlanta Fed’s GDPNow model for second-quarter gross domestic product (GDP) edged up 0.1% after the jobs report to 4.8 percent The New York Fed’s model did not change in response to the jobs report, and rests at a lower 3.3% for the second quarter. Bloomberg consensus economist estimates sit at 3.1% for the second quarter and 2.8% for all of 2018.
But what about rising wages? Isn’t that inflationary and a concern? Rising wages are a good supporting element for a bull market cycle as it serves to support the underlying economy through consumer spending. Consumer spending comprises roughly 70% of economic activity. Here is how LPL Financial’s John Lynch characterizes and or defines the impact from wage growth on the bull market cycle:
Historically, it takes average hourly earnings of production and nonsupervisory workers growing at about 3% year over year to get inflation to the Fed’s 2% target. Wages rose 2.8% year over year in May, a modest and welcome upside surprise from expectations of 2.7% and still ahead of inflation, but not yet at that 3% threshold. Nevertheless, this was still the fastest pace of wage growth since June 2009, when wages were still early in their post-recession decline (they would bottom in October 2012 at 1.2%). It’s also the fourth consecutive month of year-over-year wage growth accelerating, a streak we haven’t seen since 2013. Given the Fed’s emphasis that its inflation target is symmetrical, indicating comfort with letting inflation run a little hot, we would not consider wages an immediate threat.
At Finom Group we encourage investors to consider the “long game”. Certainly this bull market cycle has been a long cycle and will likely set a record before it is complete. The underpinnings of the market are found with strengthening corporate earnings that are on the rise. Many analysts now project corporate earnings to grow around 20% in Q2 2018 and between 18% and 20% for all of 2018. Given the propensity for corporate earnings to produce upside surprises, we may be in for a late-2018 market surprise as well. You simply never know until you know. But always be prepared!


