
It’s never easy, is it? As an active portfolio manager, trader or investor, it seems as though once we move beyond one obstacle, one fearful market narrative there is another one right around the corner if not immediately following the last fearful narrative. What could tip the scales from a bullish trend to a bearish trend now? I choose a different perspective and have for the better part of the last decade. The market perspective that I’ve developed and professed has been one that looks toward any potential bearish narrative and trend as opportunity. Using the term bearish trend, in and of itself and within the context of perceived opportunity, is also understood to be fleeting given the conditioned nature of investors to “buy the dip”. But I digress… and let’s now look upon the more recent fearful narratives. Keep in mind, our job as long-term investors acting upon local price action is little more than to think broadly and respect the structure of the markets is such that it will trend higher over time.
Rebalancing:
Here we are at quarter-end and after the S&P 500 has rallied some 76% off of its March 2020 lows. That number begs of an understanding that would find mutual and pension funds rebalancing, likely, in favor of bonds and out of equities. There are no guarantees when it comes to quarter-end rebalancing and the “offsets” from such rebalancing flows are difficult to quantify and qualify, even as the prime brokerage houses aim to do so.
Only two weeks ago JPMorgan predicted that just among balanced mutual funds (such as 60:40 funds, US defined benefit pension plans, Norges Bank, i.e. the Norwegian oil fund, and the Japanese government pension plan, GPIF), there could be as much as $316 billion in total rebalancing:
- Mutual -$107BN
- Defined Pension -$110BN
- Norges Bank -$65BN (could be -$22BN)
- GPIF -$34BN
The quantities are large, quite large, historic some might say… but so has the rally in equities since the March 2020 lows. As such, this potential rebalancing out of equities should be held in the “to-be-expected” category of investor considerations. Not a surprise and therefore not really to be feared. Least we also forget, sizable quarter-end rebalancing was previously projected by J.P. Morgan for the Q4 2020 period. (See screenshot below)
While the former equity market vulnerability was cautioned by J.P. Morgan in December of last year, the market did nothing but melt higher into year-end, basically closing at an all-time high. Does that history portend to repeat itself? Obviously we can’t predict the future, no matter how smart our words and information may appear. Nobody knows what will happen tomorrow and anybody who suggests otherwise is wasting their time sharing that information with us. Nonetheless, Bank of America builds on the more recent J.P. Morgan quarter-end rebalancing with the following notes to clients:
…predicting a total of $88.5BN rebalancing out of equities and into U.S. fixed income, a number which BofA finds historically significant vs. standard deviation of quarterly equity rebalancing flows over the last three years at c.$67BN.
Broken down by fixed income inflows, BofA estiamtes that $41BN would flow into Treasuries, $44BN into corporate bonds, $3BN into Agency & GSE backed securities and $c.0.5BNn Mortgages. And while part of the rebalancing flow is “likely” to have been executed at month-end in January and February, the strategists expect the larger part of the rebalance “at quarter-end reflecting the broader relative performance of asset classes throughout the quarter.”
This Could be bearish for stocks in light of the chronically low liquidity in U.S. equity markets that has persisted since late 2016.
The singular focus from BofA, however, is somewhat disputed by Nomura’s Charlie McElligott. In his latest report he writes, … “a sharp change in quant/dealer/vol-control signals means that pensions selling may be fully offset by mechanistic buying now that we have anniversaried the March 2020 crash.”
Charlie brings attention to Monday’s “vol crush across macro Equities”, which saw the VIX decline in diagonal fashion amid persistent volatility selling for the entire day, as the March 2020 VIX explosion dropped out of the 1-year lookback for volatility-control/targeting funds…
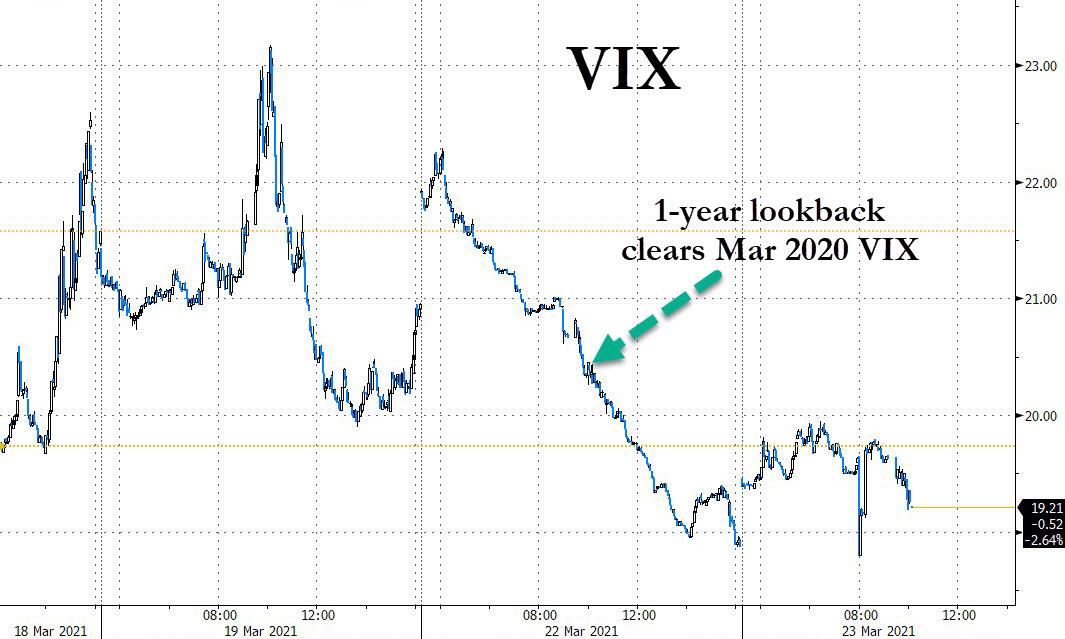
McElligott now notes that in that 1-month realized volatility lookback period there was a cluster of ‘down days’ which are set to drop out of sample, “which then likely portends re-adding exposure in substantial size in coming-days if the market’s daily changes “tighten” under the compression of a return to a Dealer “long gamma” regime.” For simplicities sake, this basically means that assuming no major market shocks to the market, McElligott estimates up to $31.8BN of buying over the next 1 week and right into the teeth of quarter-end rebalancing, but only if daily market moves are < 0.5%; the number shrinks to +$27.2B if daily moves are < 1.0%; and +$12.2B if daily changes are <1.5% (all of those numbers accordingly grow if range compression holds beyond 1 week).
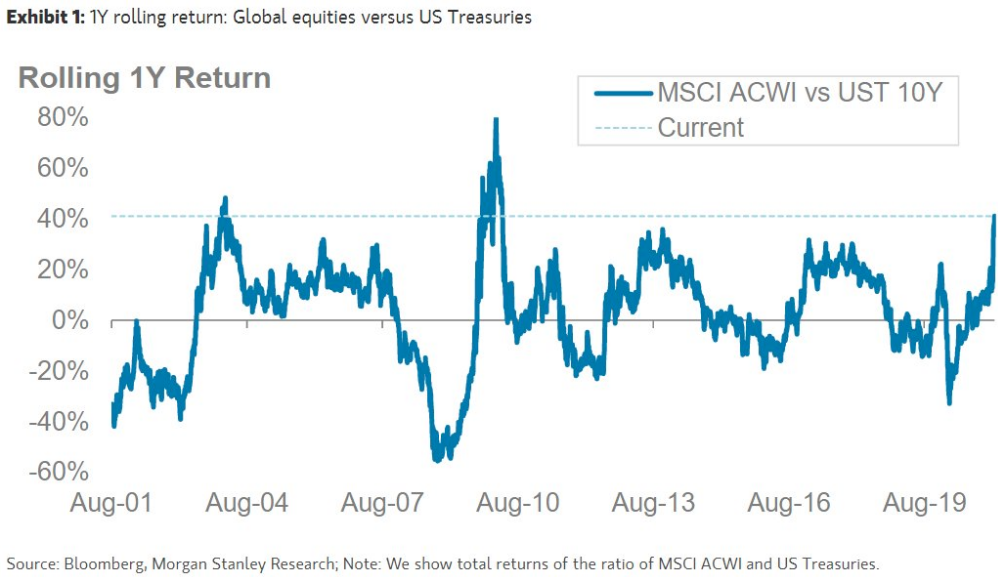
If you like noise for what is understood to be a normal and to-be-expected market participant operation, the above is likely to prove just a lot of noise that does little more than distract investors. Again, During the last 12 months, equities beat bonds by the most in more than a decade! If rebalancing of bearish consequence is found, so is long-term investor opportunity!
A normal and to-be-expected quarter-end rebalancing operation is nothing to fear. It may simply be something to plan for and around. With market weakness, what are you buying? If the market doesn’t prove to weaken, where might you be taking profits, rebalancing your portfolio? When you have a plan you have a discipline that is less afraid of price action and more appreciative of price action. Some investors likely found this out the hard way back in March 2020.
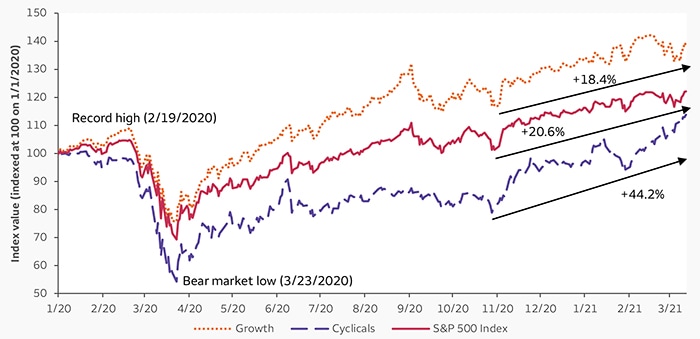
One year ago yesterday, the S&P 500 Index fell to a bear-market low, closing at 2,237. In just over a month, investors had seen the index plummet 34%, from a record high of 3,386. Many investors wondered whether they should stay invested.
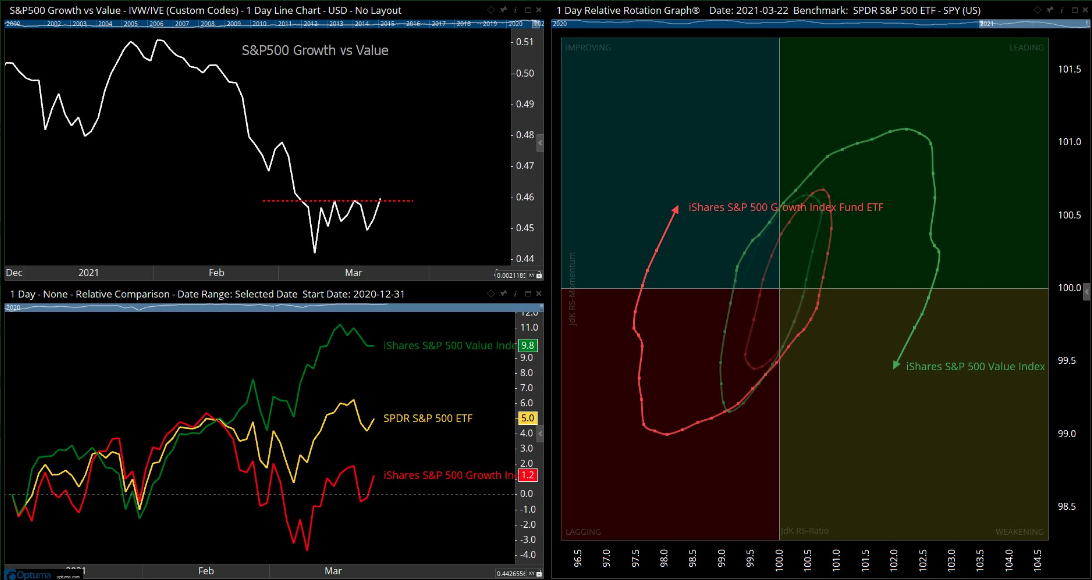
Exactly one year later, much has changed in the markets. The S&P 500 Index is approaching 4,000, which has proven the typical difficult accomplishment of a 1000pt number, up more than 76% over last year’s bear-market bottom. While growth stocks (orange line) led the charge upward from March to September, cyclical stocks (purple line) have led the way since October 28 lows.
If Tech Doesn’t Lead:
We left off with what has been leading, carrying the markets since October 2020, Cyclicals. The reopening trade has been all the buzz, hyperbolized for what many are promoting as the dawn of a new leadership cyclical bull market. I’m leaving room for error from the many strategists leaning in favor of new, long-term leadership that finds Information Technology stocks/sector taking a backseat. As noted previously, the media, analysts and strategists often allow for the hot topic, price action to dictate their sentiment/s. These market participants are often wrong and caught in a prisoner of the moment cycle more so than being found for thoughtful analysis. After all, we were told to sell the vaccine news as early as November of 2020 by BofA’s chief equity strategist Michael Hartnett:
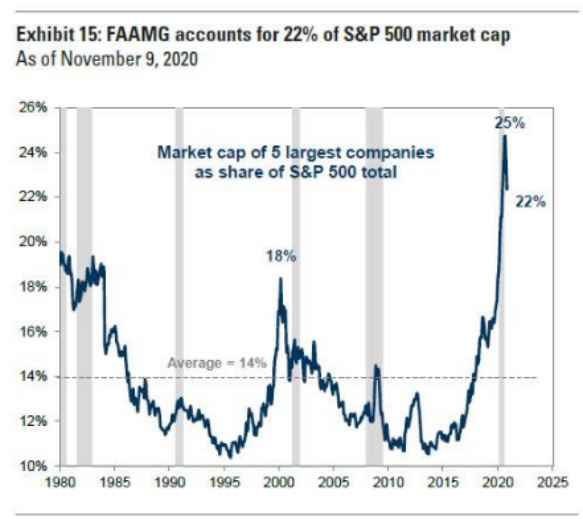
Sell #vaccine news: “Bull story of 2021 “a reopening rotation story, one which however would have a deep impact on tech stocks which have been market leaders for past 3 years, and where just the 5 FAAMG stocks now account for 22% of the S&P’s market cap.”
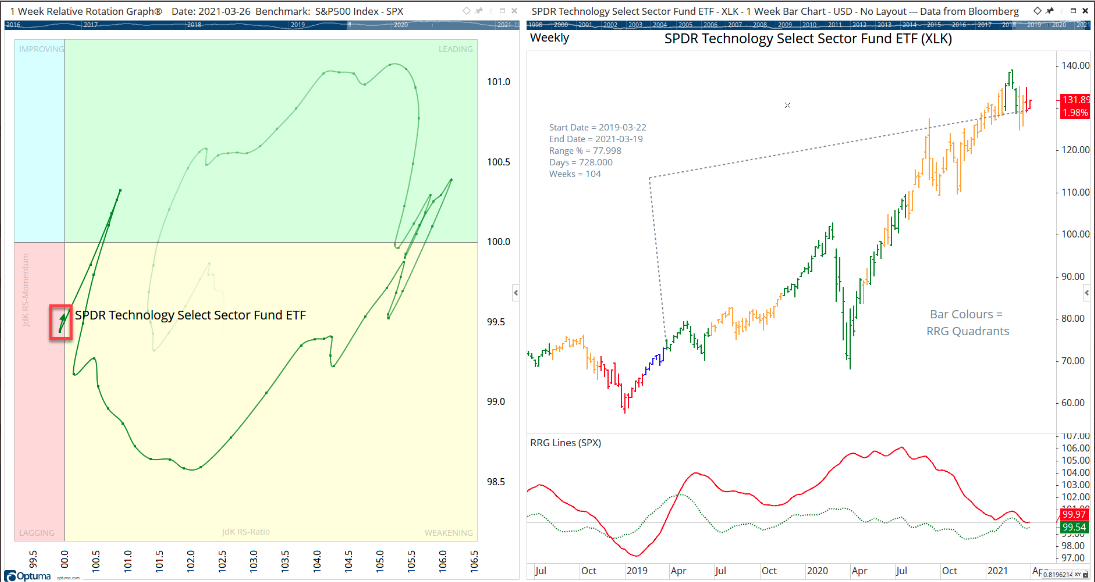
If we fast-forward to the Tuesday, here is where things stand: Growth (IVW) is accelerating relative momentum in the RRG Improving quadrant vs Value (IVE) in Weakening quadrant. Daily RRG shows growth/value rotation in the S&P 500 this year. We may be on the verge of a change in leadership once again. Or maybe growth/tech was never really lagging, but rather leading the eventual consolidation phase post a leadership out of bear market territory from March through September 2020.
Below is a back-of-the-envelope attempt to quantify the effects of market timing, recently offered by Ben Carlson. It is far from a perfect approach, but what you see here is a calculation of the 10-year profit and loss (P&L) of all monthly net flows into equity mutual funds and ETFs, and compared that to the 10-year P&L of a dollar cost averaging strategy. Both of these are then compared to the long-term compound annual growth rate (CAGR) for both the S&P 500 and cash.
Some of this, not yet trending, resumption of relative growth/tech strength is potentially predicated on a surge in fund flows. The $155 billion Invesco QQQ Trust Series 1 (QQQ), which tracks the Nasdaq 100, had a $4.9 billion infusion on Monday, according to data compiled by Bloomberg.
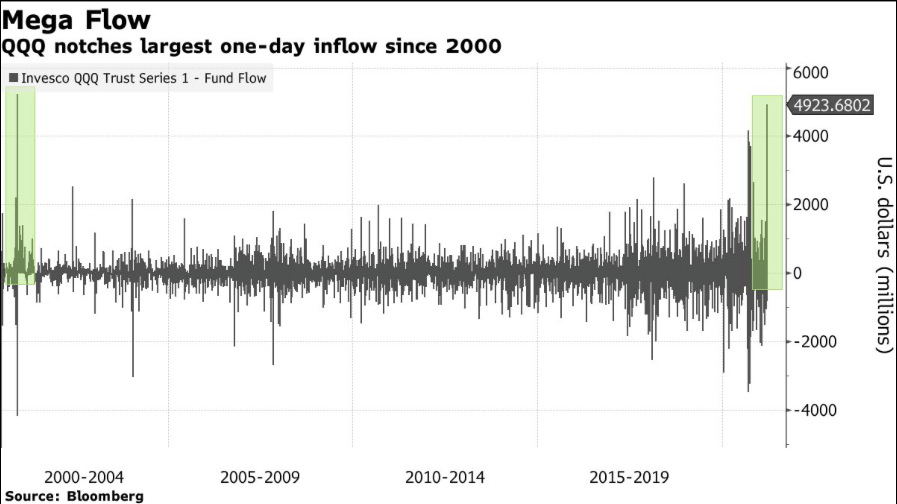
That’s the largest one-day intake for the ETF since 2000. The inflow was related to quadruple witching on Friday. More than 17 billion shares changed hands on U.S. exchanges that day, roughly 20% above the three-month average.
Finom Group is of the opinion that the weakness in growth/tech will ultimately revert to strength and will prove an opportunity for long-term, patient investors. BTIG’s equity strategist Julien Emanuel is of the same opinion:
“We are firmly in the camp that despite the fact we think value over growth works in long term, in the near term, upside is definitely going to be led by moderation in the decline in bond yields spurring outperformance in large cap tech, specifically FANG.
BofA Global Research recently offered the following notes/chart regarding their tactical approach to the growth/value narrative near-term as follows:
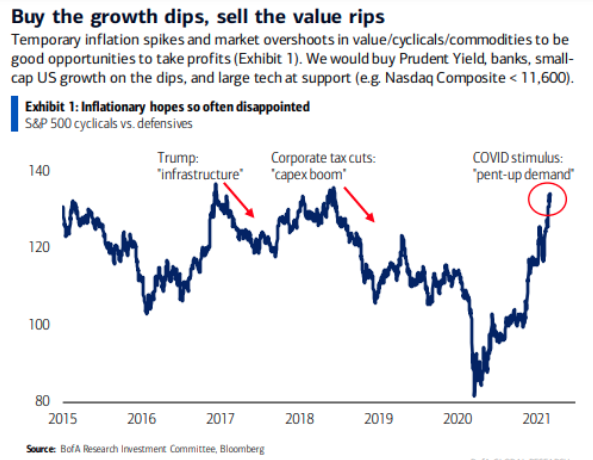
While it remains to be seen as to, and in Finom Group’s earnest opinion, WHEN FANMAG/growth/tech leadership is more prominently on display, the industry group may prove the greatest value of the moment. Furthermore, and this holds true for the industry group and the market as a whole: when stocks/markets go on sale, don’t be a net seller of good stocks/ETFs or the market as a whole. Buy the dip and ride the wave of market volatility that will ultimately subside and revert to an uptrend, as proven throughout history.
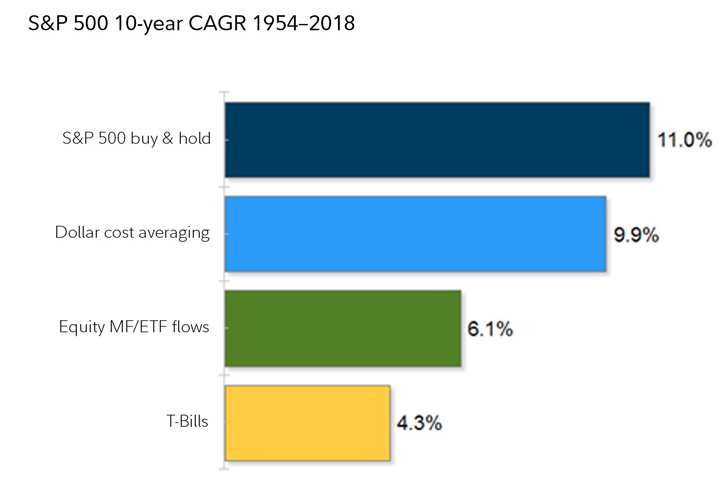
As you can see in the chart above, while dollar cost averaging comes very close to replicating a buy and hold strategy (represented by the long-term CAGR of the S&P 500), fund flows (as a proxy for market timing) lag far behind and are pretty close to what you can earn by sitting in cash. Market timing, on aggregate, tends to detract from performance while increasing volatility. Nonetheless, and despite the preponderance of evidence, active investors/traders will attempt to time the market via equity sales, hedging or simply going short the market as a whole. Literally happens on a daily basis, despite history evidencing the buy and hold strategy as prevailing, even when considering the “Perfect Storm of 2020”.
Tackling Today:
As we head through the end of the quarter, facing many challenges and hyperbolic, sensationalistic headlines over inflation and bond market turmoil, we urge investors to stick to their game plan. Ride the waves, look for opportunities of market weakness to take advantage of long-term opportunity. As we are always forward-looking, given the market’s forward-discounting tendencies, let’s review some recent data/quants. These are some of the key historic data points we recently discussed in our weekly Research Report on March 14, 2021:
“…as it pertains to the bond ETF (TLT), seasonality may come in to play through the end of the month, which aligns with quarter-end portfolio rebalancing.
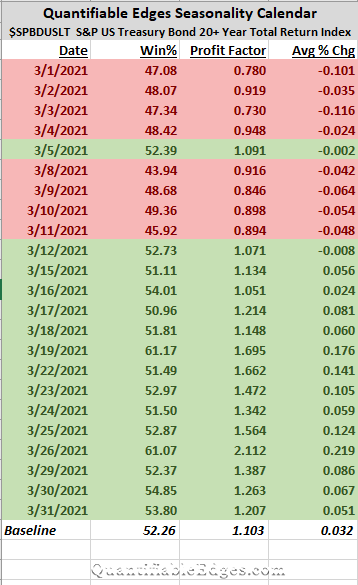
Seasonality is now starting to turn positive for the bond ETF (TLT). Numbers still appear somewhat muted for the next week, but starting on the 19th through the end of the month, TLT should have a seasonal wind at its back to help with any rebound. This correlates with yields moving lower.
Based on our notes above, if we look at the chart of TLT and refer to the date of March 19th…
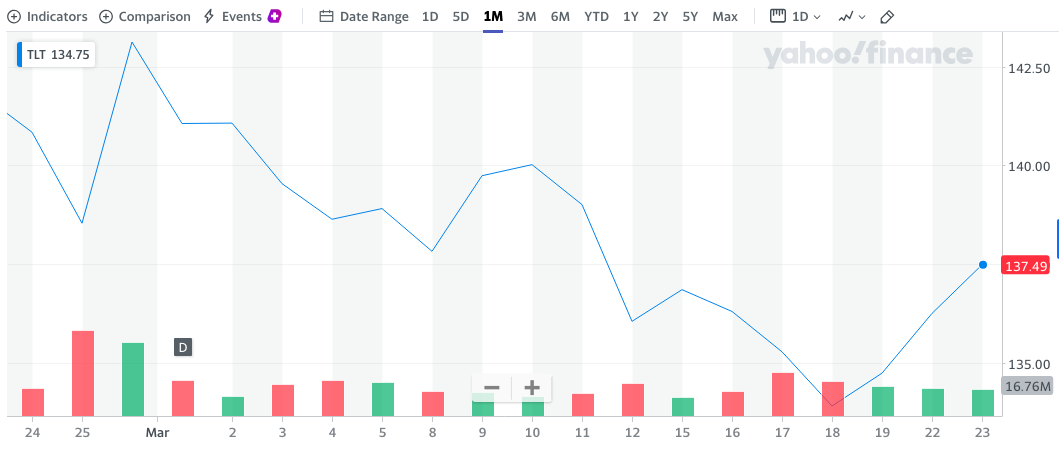
Wouldn’t you know it? As quarterly rebalancing takes place, seemingly finding bonds in favor once again, yields are lower, bond prices are higher which results in a higher TLT bond ETF. History doesn’t always repeat, but having the data informs of the probabilities for which investors/traders can prove advantaged. Speaking of bonds and historic data:
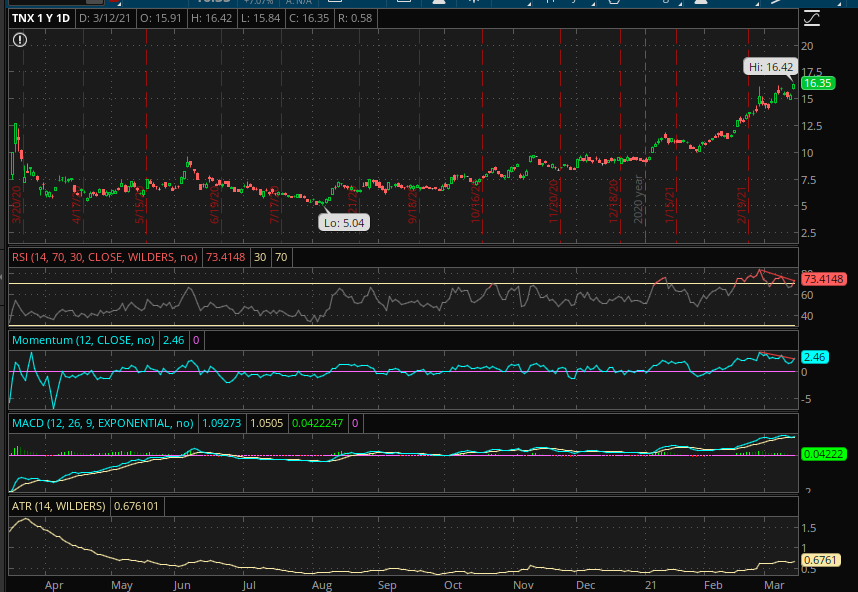
While the 10-yr yield recently hit a post pandemic high of 1.754% late last week and after an extreme YTD rate-of-change has heralded ever-rising yields from the financial media pundency, we think a topping pattern is afoot, which we discussed with members in our March 14th report:
“Like any other asset, price can drift higher even when bearish divergences appear. That is what we’ve seen lately as TNX has drifted higher. In the chart below we can see that the 10-yr. yield is at a post-pandemic period high, but its 14-day RSI, while in overheated territory has not achieved recent highs while the 10-yr. yield has reached newer highs. Furthermore, with RSI and Momentum identifying bearish momentum divergence, we might anticipate a MACD bearish crossover at these elevated levels near-term.”
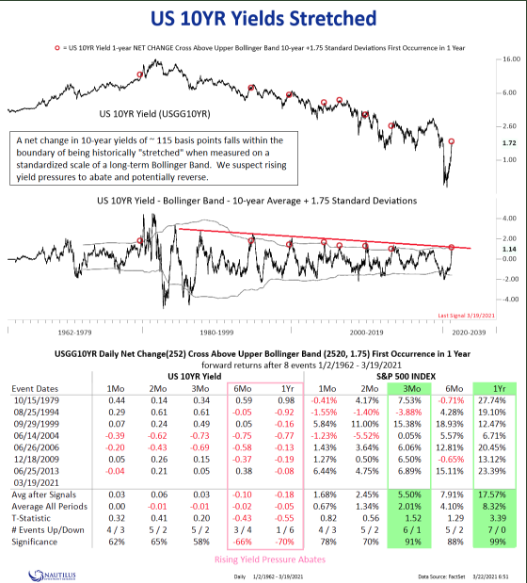
If we look at this historic rate-of-change in the TNX, here is what we’ve also found for investors. According to data from Nautilus Research, the 115bp move in the 10-yr since the lows in 2020 is indeed stretch, overheated if you will. This has only occurred 7 other times dating back to 1979. S&P 500 forward-looking returns are largely positive from 1-month out 12 months. The percent positive rate also increases the further out in time, as shown in the study below:
Now let’s look at another recent market occurrence that may also prove to indicate the path for the S&P 500 from our recent State of the Market video:
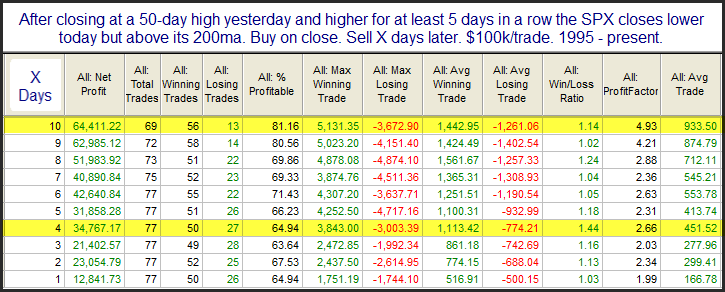
- It has largely gone unnoticed, but the market was up 5 days in a row again, reaching new highs to start the week.
- The table above offers what happens after the market moves up at least 5 days in a row to a 50-day high, and then pulls back, as it did on Tuesday.
- We can see that from 1-10 trading days later, the % profitable/positive rate is above 60% across the total period and the profitable/positive rate mostly increases the further out in time we go.
- The S&P 500 closed at 3,968 on March 15th. 10-days later or March 25th the S&P 500 would need to be above this level if the 10-day forward return is to be positive, indicated with an 81% probability based on the study above.
- **We would be remiss if we didn’t remind that this was triggered in February 2021 as well. The market was higher 5 days later, but fell into the end of the month of February.**
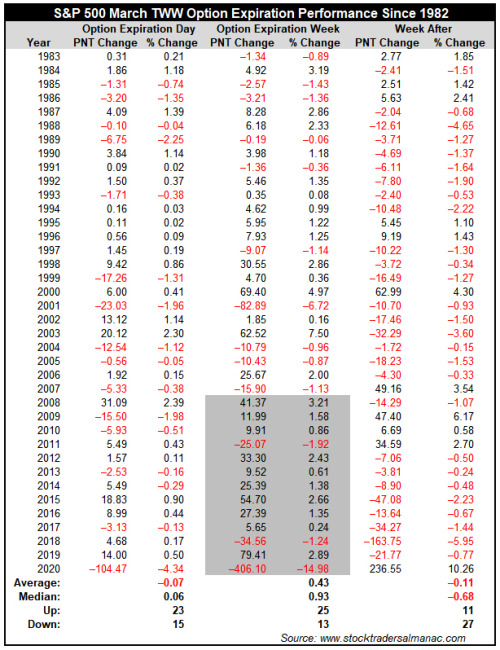
Unfortunately, while the probability of a higher S&P 500 price after a 5-day win streak looks appealing if not strong, the week after monthly options expiration is historically a weaker performance for the market.
The near-term is anybody’s guess, but the data certainly helps to set-up the probable outcomes. If investors/traders act on local price action, but do so with longer-term considerations, the outcomes are usually found profitable (index level). As LPL Financial reminds us: This is year 2 of a new bull market.
Figure 1 below shows what happened during the first year and second year of bull markets that followed 30% or larger bear markets going back to World War II. Here are three takeaways to remember as the bull turns the calendar to year two.
- Since World War II, there have been six other bear-market declines of at least 30%, and in every single case the S&P 500 was up firmly the first year of a new bull market—with an average return of more than 40%. The good news is the gains continued in year two, as stocks were also up the second year of a new bull market every single time—up a solid 16.9% on average. Only once (after the 1987 crash) did stocks gain more during year two than year one.
- The previous best start to a bull market ever was the 2009 bull market, which was up 68.6% after one year. Even after those historic one-year gains, the S&P 500 managed to gain a respectable 15.9% during the second year. It wasn’t an easy ride, however, as there was a 17.1% correction during the second year.
- Pullbacks tend to happen during the second year of a new bull market, with an average year two pullback of 10.2%. Considering the current bull market reflected the best start to a bull market ever, this could open the door for an above-average pullback during year two.
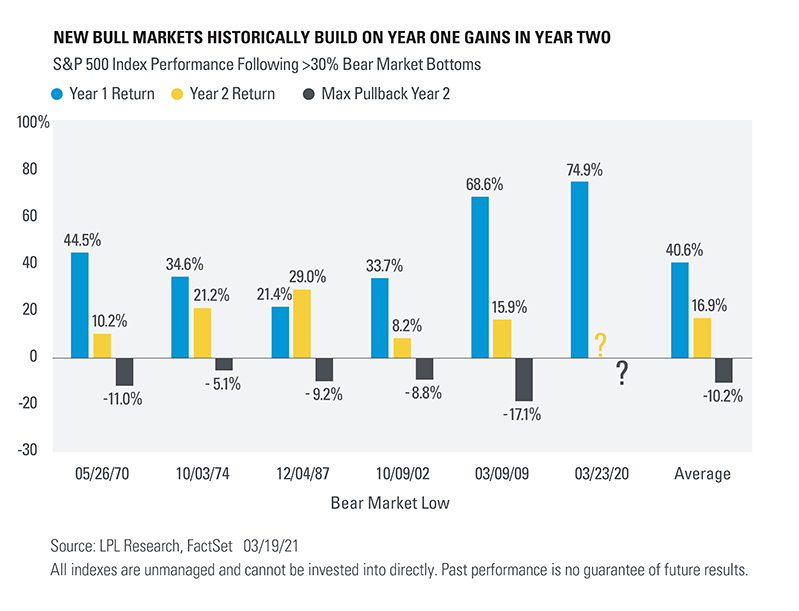
Year 2 of a new bull market does suggest the bulls will remain in full control, but do anticipate some volatility as the “easy money” was likely captured in year 1 of the new bull market. With that, here’s another interesting factoid: No bull market since 1950 has ended in year 2.
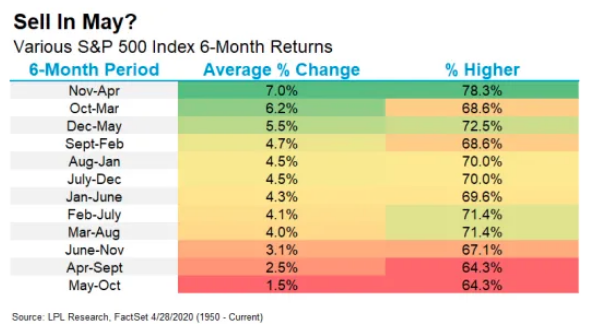
History informs us that while the pundits and permabears continue to beat a bearish drum that discounts the markets’ trend, investors should anticipate higher prices for the stock market in 2021, at least. having said that and nearing the end of the quarter, April marks the end of the “Best Six Months” to own stocks.
With respect to April, let’s not also fail to recognize the fact that we are coming out of an election year. What does history inform if we include this key variable?
Typical post-election year blues have done little to damper April’s performance since 1953. April is DJIA’s second best month in post-election years, gaining 1.9% on average. April is fourth best for S&P 500 and NASDAQ. Although post-election year 2005 did suffer a 3% DJIA decline.

April is typically one of the best months of the year for the S&P 500, but we still have a few trading days to go in order to complete the Q1 2021 period. As of late, the trend has not been friendly to end the months. January ended poorly and with a 4.5% peak-to-trough correction and February witnessed net selling and another wave of consolidation to end the month. Thus far, the final trading days of March have lent to the prevailing end-of-month trend. But this may prove just what the market needs to eliminate some of the froth and take the next leg higher.
The market is full of fun and terribly useful data points to consider. The one thing the historic data does not offer is any guarantee that history will repeat. Nonetheless, the probabilities help to define risk, and the more an investor aligns with the greatest probabilities, the more likely they are to extrapolate profits from their investments/trades. If there is one truism we can hold firm and fast to, as it pertains to investing it’s probably this:
“Whenever you think you’ve found the key to the market, some son-of-a-bitch changes the lock!” ~Walter Deemer


