

Research Report Excerpt #1

Recall the table above that we had been tracking and suggesting may prove favorable for the back half of 2022? Since 1932, any time the S&P 500 was down 14% or greater through the first 120 days of the year, from that point forward the market was higher by year-end. And so far, history is rhyming rather well. While the narratives surrounding the Fed, inflation, the consumer, the ongoing war in Ukraine, and a slowing economy persist, earnings have held up rather well and confirmed EPS growth through Q2 2022.
Research Report Excerpt #2
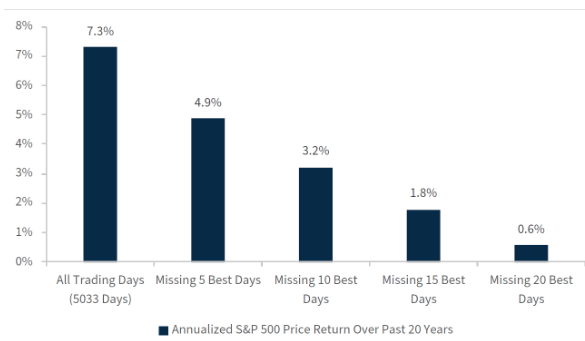
Over the past 20 years, the S&P 500 has grown at an annualized rate of 7.3 percent. However, removing the 5 best trading days over that 20-year period brings the S&P 500 total growth down to 4.9 percent. So if you missed the 5 best trading days for each year over a 20-year period, you likely earned less than the S&P 500. Missing the 20 best trading days pulls this return down to only 0.6 percent. Stay in the market, ride out the storms, even if we don’t know when or how the bear market ends.
Research Report Excerpt #3
So here is why the 50% RULE is so important as it pertains to distinguishing between just another bear market rally and potentially a new bull market forming:  Every bear market since 1972, whereby a 50% retracement of the down move has been achieved, there has never been a retest and the low of the bear market was established. Hence, a new bull market formed once the 50% retracement occurred.
Larry Williams: “The history of the last 9 bear markets going back to 1972 shows that once we have had a 50% rally, back where we are now in the S&P 500, lows are not re-tested. And a rally less than 50% may give way to a re-test. Anything greater than 50%, we just don’t retest.”
Research Report Excerpt #4
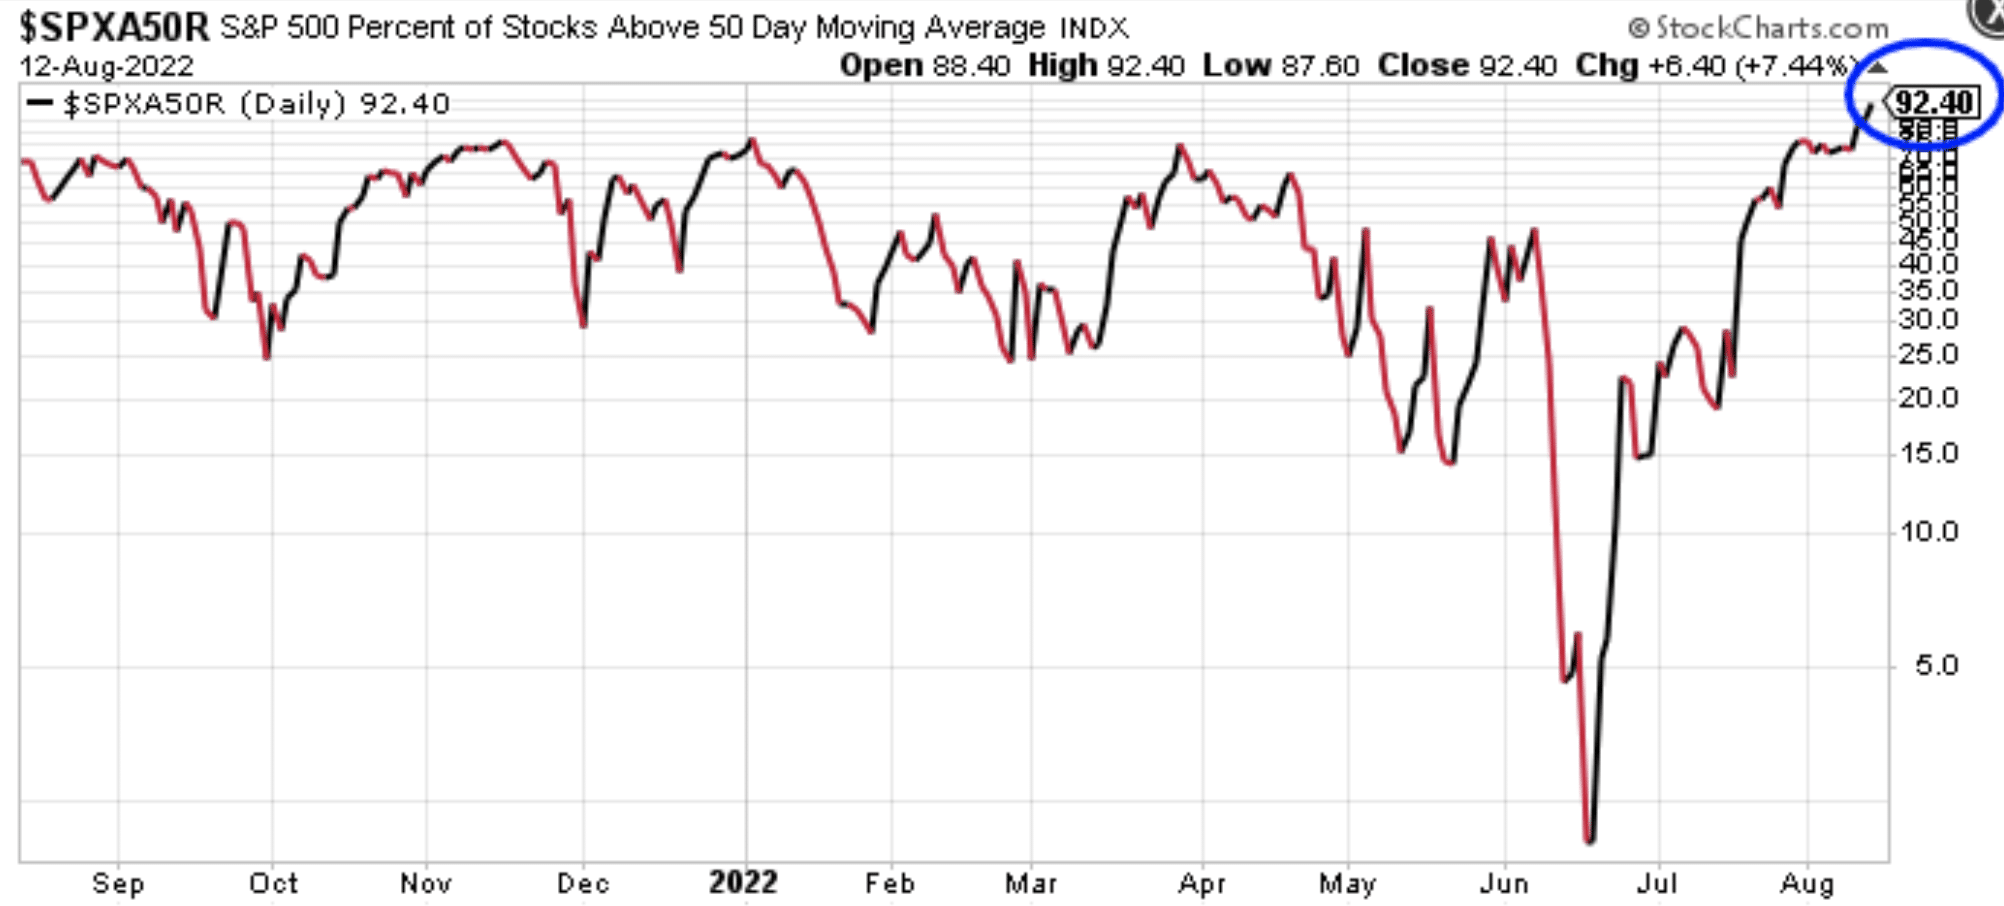
At the end of the week, more than 92% of S&P 500 stocks finished above their 50-DMA. It’s important to let this sink in for a minute and reflect on what it actually means. It’s one thing if a handful of large-cap stocks are driving the market higher, it’s a whole other story when the vast majority (92%+) of stocks are participating in the market rally. More than 92% of stocks are indeed trading ABOVE their interim moving average (50-DMA). So what does history tell us about “when more than 90% of stocks are trading above their 50-DMA in the S&P 500?”
Research Report Excerpt #5
Ideally, the finally pin in the argument as to whether the bear market is over or not will come with the S&P 500 moving back above its 200-DMA. That proverbial “line in the sand” is fast-approaching!
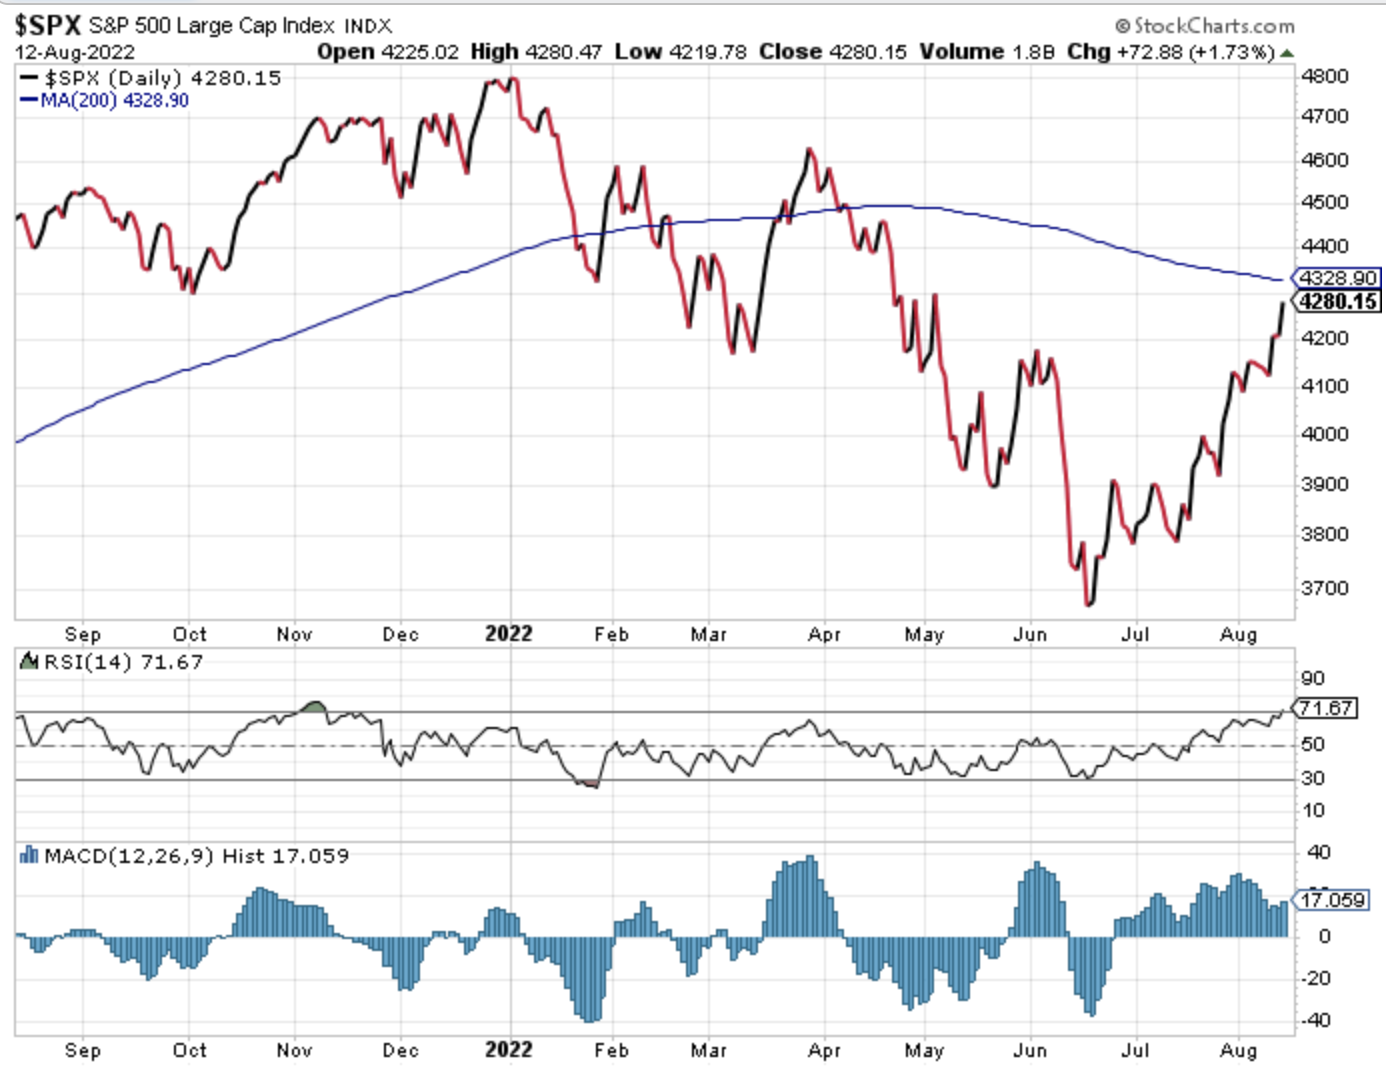
The S&P 500 is now within 50 points of its 200-DMA. Only the small-cap Russell 2000 has managed to close above its 200-DMA as of this past week.
Research Report Excerpt #6
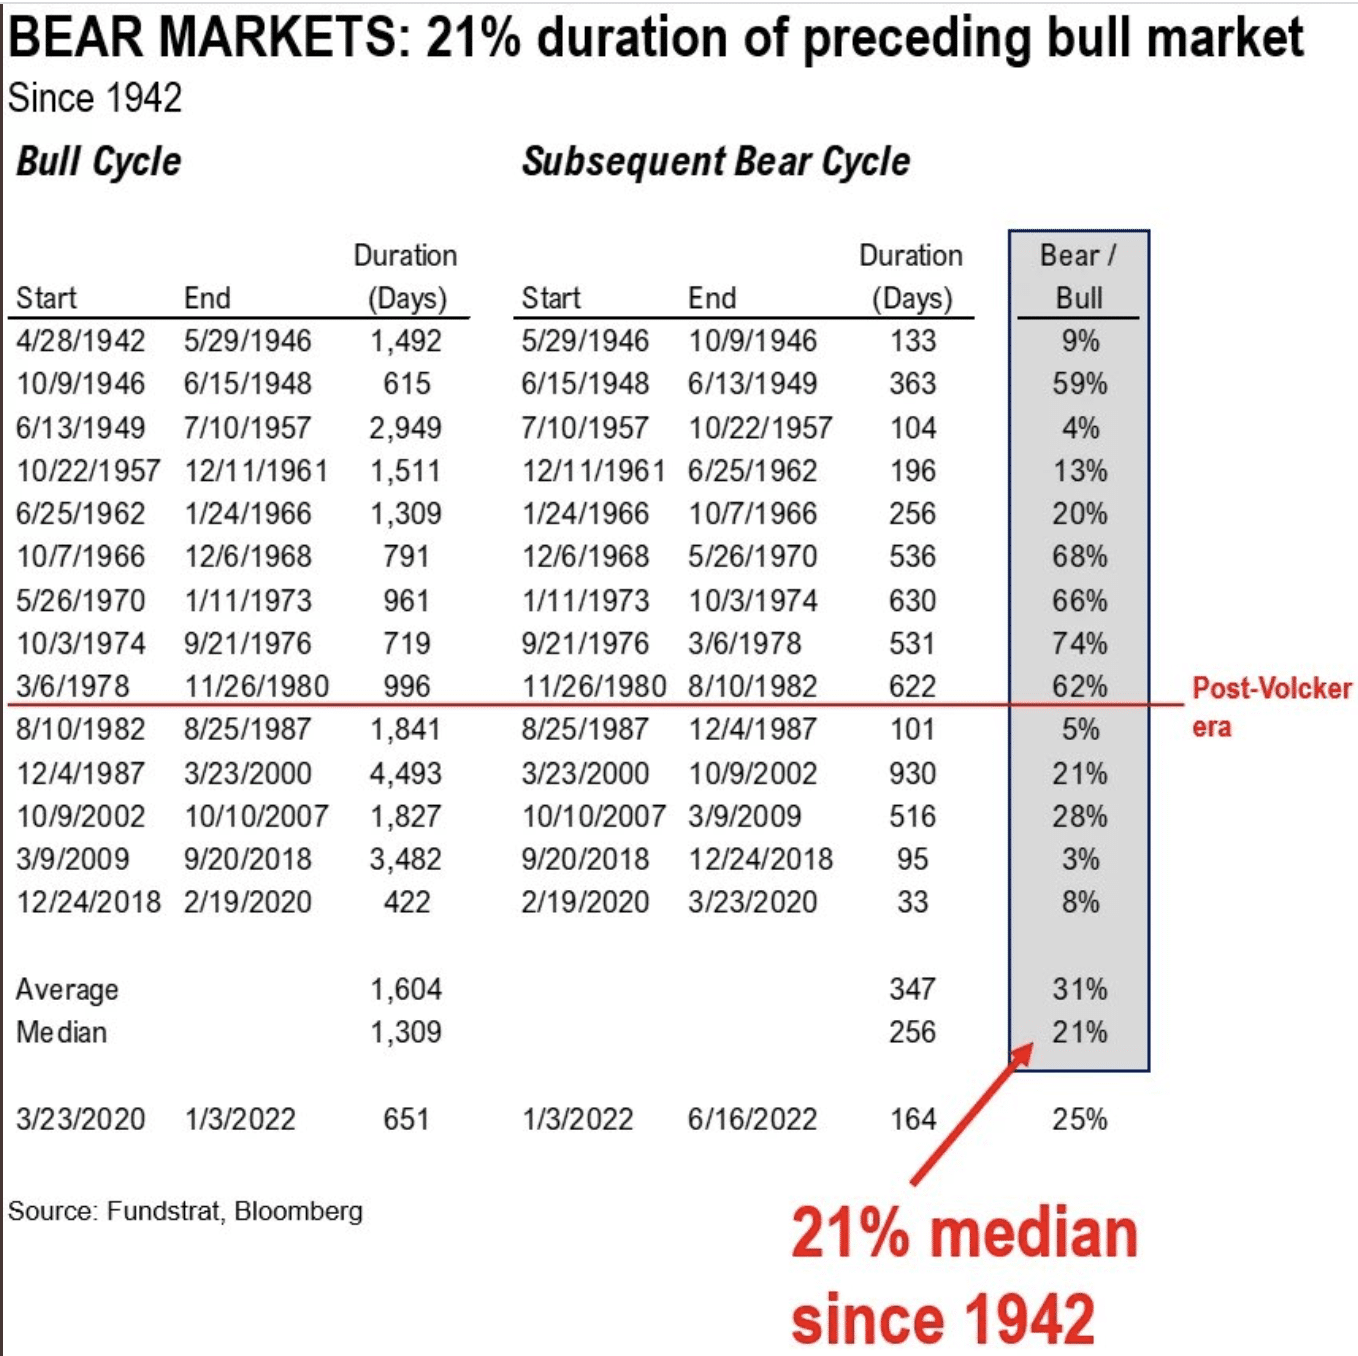
Fundstrat: “Historic average ratio of bear to bull cycle time is 31%, indicating a bear market ~ 1/3 of the bulls duration. 2022 bull market completed 651 days, bear market would be 164 days thru June 6 or -25%, which is within the range of the average and median bear markets, historically. It’s possible, like in 1982, the entirety of the bear market is erased over the next 4 months.”
Research Report Excerpt #7
At this point in the economic cycle, which noticeably slowed during the Q2 period, I would be of the opinion that investors should greatly consider all that corporations and the consumer have dealt with during the first 6-7 months of the calendar year. I call it the Dirty Dime (10): 
- China lockdowns extending the supply chain crisis
- Rapidly rising oil and gas prices due to Russia/Ukraine war
- Omicron variant
- Normalizing of the consumer wallet share from goods to services
- Rapidly rising dollar
- Fasting rising rate environment since 1990s
- Housing affordability at worst level ever
- Geopolitical turmoil
- 42-year high inflation
- Potential manufacturing recession
Research Report Excerpt #8
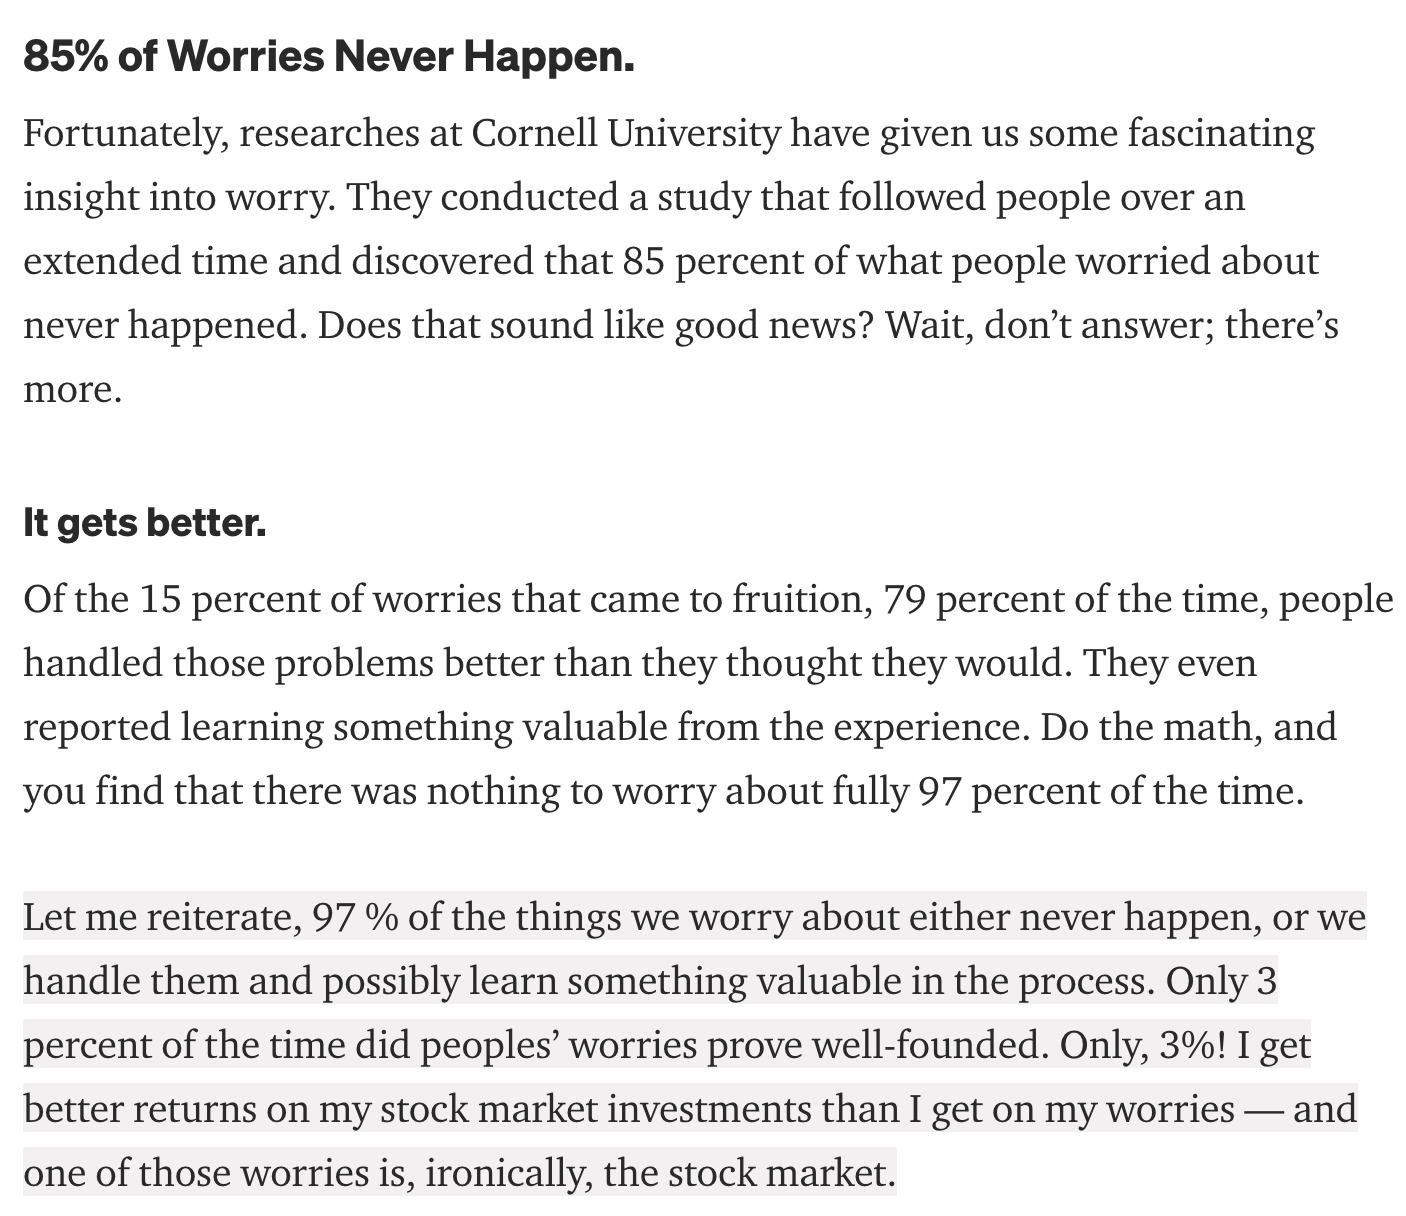
And, more often than not, what we tend to focus our worry proves misplaced or irrelevant. Seriously, misplaced or irrelevant says a study from Cornell University. What, you think I just say stuff to say stuff? Not the “Golden boy”. Everyone has an opinion, but not everyone supports their opinions with data, with facts!
Research Report Excerpt #9
Anytime the word “debt” is introduced into the conversation it takes on a negative connotation. But most debt is “good debt”. Good debt, in this investor’s opinion, is debt that can be serviced. If debt rises over time, the amount of debt is less consequential to an investor than the serviceability of that debt. So let’s look at the chart below:
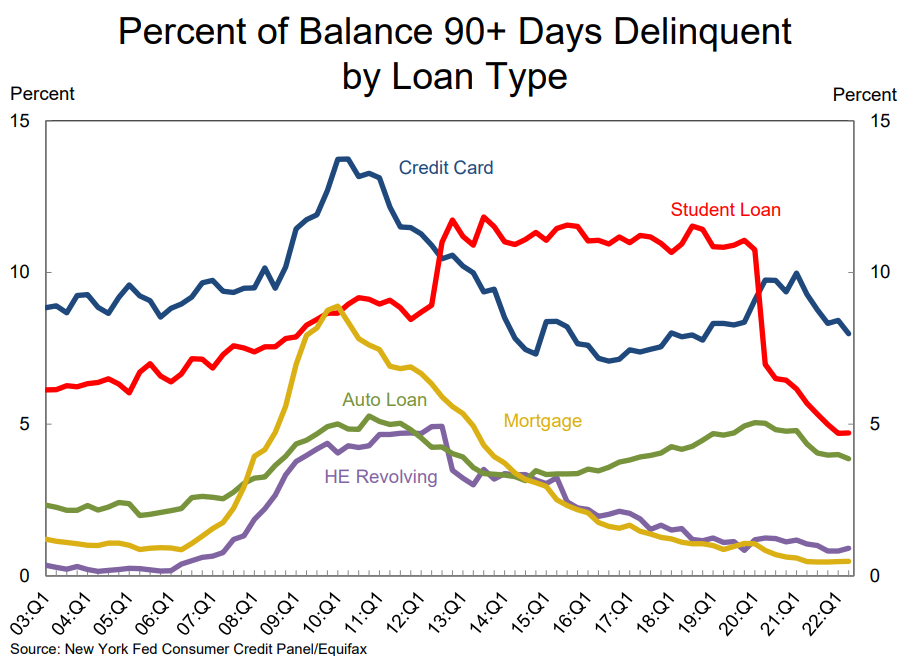
Again, from the New York Fed’s quarterly Household Debt and Credit report we can see the 5 different categories of household debt. What we can recognize from the different categorical debt trends is that most debt category delinquency rates are falling and have been since 2009/2010. When delinquency rates are trending lower or at low levels we recognize that the average household is accruing debt that can be serviced/paid on a monthly basis. The average household is behaving responsibly with respect to their debt “burden.”


