

Research Report Excerpt #1
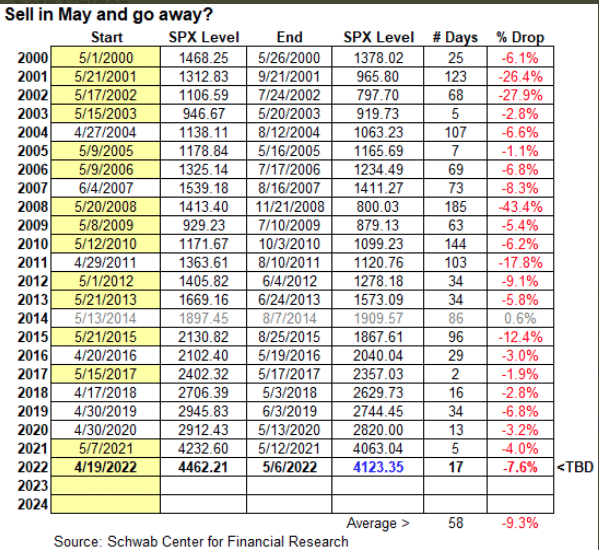
Keeping in mind that Sell-in-May-and-Go-Away doesn’t pertain solely to the month of May, but rather to the 6 month period starting in May and ending in October. This period holds the lowest probability for positive and average returns for the S&P 500 dating back to 1950. In speaking to the potential drawdowns during the month, over the past 22 years there have been 14 pullbacks that began in May and 8 others (including 2022) that happened within 2 weeks before or after May. 2014 was the only year that there was not a pullback of some sort that began around May (table above from Charles Schwab’s Randy Frederick).
Research Report Excerpt #2
Fast-forward to this past week and the XVG fell more than 1%, greater than the S&P 500 decline. In the updated chart of the XVG below, we can see that it fell to a low last seen in February 2021. Additionally, the XVG resides just a few percentage points above its pre-COVID high from February 2020.

The Value Line Geometric Index pre-pandemic peak of 2020 may be a good determinant of where the major averages are heading, lower. Then again, if indeed the fundamentals prove their merit and assuage the concerns surrounding “inflation” and “monetary policy’s efforts to combat inflation, the February 2021 trough point may prove the 2022 trough point, and resonate within the major averages. soon enough. There’s no predicting the future, but the future price action may be determined and come as soon as this coming week within the releases of the Consumer Price Index (CPI) and Producer Price Index (PPI).**
Research Report Excerpt #3
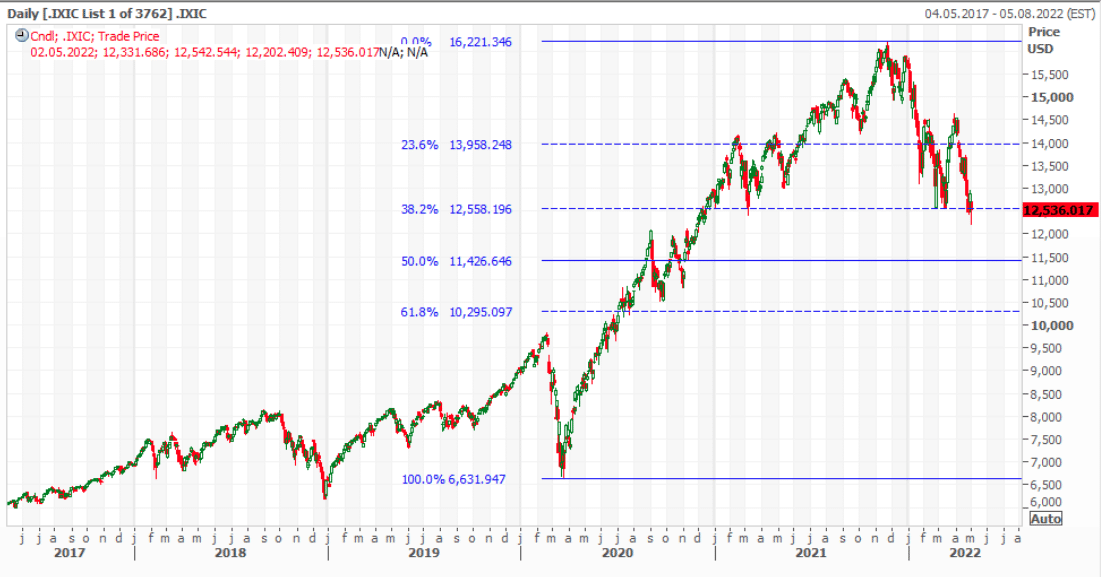
Market price behavior often proves the theory of market symmetry, and as such we can see this symmetry played out by the plotting of Fibonacci levels in the chart above. In 2022, the Nasdaq had tested support at the 38.2% Fibonacci level 3 times before breaking below recently. This does not automatically suggest doom and gloom, but it does reference the anticipation of further downside. The next Fibonacci retracement level would come at 50% or 11,426.
- The Nasdaq composite is down ~24% year-to-date and a move down to the 11,426 level would represent a ~29% bear market for the Growth-defined index, or roughly 5% lower than where it closed this past week.
Research Report Excerpt #4
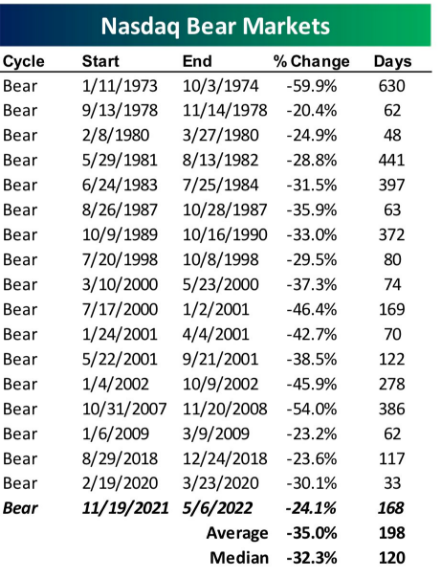
What investors will recognize, from the table above, is that there were four 20%+ rallies during the post-Tech bubble secular downturn and before the ultimate bottom was put in (table from Bespoke Investment Group). Remember, markets do not go down in a straight line any more than they go up in a straight line. The average bear market since 1973 was 35% and the average duration was 198 days. At 168 days and a 24% bear market, investors’ patience is demanded as much as intestinal fortitude. Markets move quite rapidly nowadays so while a 35% drawdown is another 11% downside from Friday’s close, it can happen within a matter of days or weeks.
- In no way shape or form do we know that the average bear market will be achieved and bringing the index down to the average trough price of 10,540 (Nasdaq).
- In recognizing the history of Nasdaq bear markets it simply helps for risk management and capital allocation planning intentions. The savvy investor uses the data to possibly increase cash holdings and/or plot points of capital allocation. Bear markets are not fun, especially when the average Nasdaq stock is down more significantly than the index year-to-date.
Research Report Excerpt #5
With respect to the S&P 500, and as an example of why investors/traders should focus more so on CASH and TIME, and less on the near-term index outcomes is exampled in another study we presented back in April. This study from Chris Ciovacco focused on a like retracement in the S&P 500, which occurred in Q1 2022. The index had dropped some 13% in Q1, only to retrace 10% of the drawdown to end the quarter.

Unfortunately, and based on the table above, the 1-month returns for the S&P 500 did not achieve the higher probability outcome. The average return for the study of 10% retracements intra-quarter was 5.70% with a 90%+ positivity rate. The only previous time the S&P 500 didn’t finish with a positive outcome over the 1-month period, before 2022, was in 2008. The higher probabilities for near-term outcomes don’t always manifest, and as such, we encourage investors to extend their time horizons as the forward returns are increasingly favorable the further out in time we travel.
Research Report Excerpt #6
FactSet: “Positive earnings surprises reported by companies in multiple sectors (led by the Health Care, Utilities, and Financials sectors), were responsible for the improvement in the earnings growth rate over the past week. Positive earnings surprises reported by companies in the Health Care, Financials, Information Technology, and Communication Services sectors, partially offset by a negative earnings surprise reported by a company in the Consumer Discretionary sector, have been the largest contributors to the increase in the earnings growth rate since the end of the first quarter (March 31).” (charts & commentary from FactSet)
Insight/2022/05.2022/05.06.2022_EI/sp-500-earnings-growth-q1-2022.png?width=920&name=sp-500-earnings-growth-q1-2022.png)
Recall what Finom Group offered in our April 10th Research Report as follows:
“Finom Group’s former model anticipated that even though consensus analysts’ estimate was in the 4% to 5% range for EPS during Q1, we’d likely see something in the 6% to 7% realized EPS range. But… we may have been to conservative even in this above average EPS estimate. **Based on the consistency in consumer spending, inflation rate and wage gains, we think Q1 EPS could come in expressing 9-12% YoY growth.”
Research Report Excerpt #7
- So while the headlines will emphasize concerns from around the globe and even the domestic economic environment, the ERP summarizes all of these issues into one metric. This is the reason I often offer that when markets are contracting, it is usually a market operation, normal and to-be-expected rather than a doomsday scenario in the making or a black swan build-up. It’s painful for many investors nonetheless, and I get that. I’m not having much fun in this market environment either. Having offered that and all the details above, the information might just save your portfolio from poor decision-making in the future. If you’re selling your stocks and moving into cash because you think this is going to be the coming of a multi-year bear market like 2000-2002, that is not evidenced by the ERP.
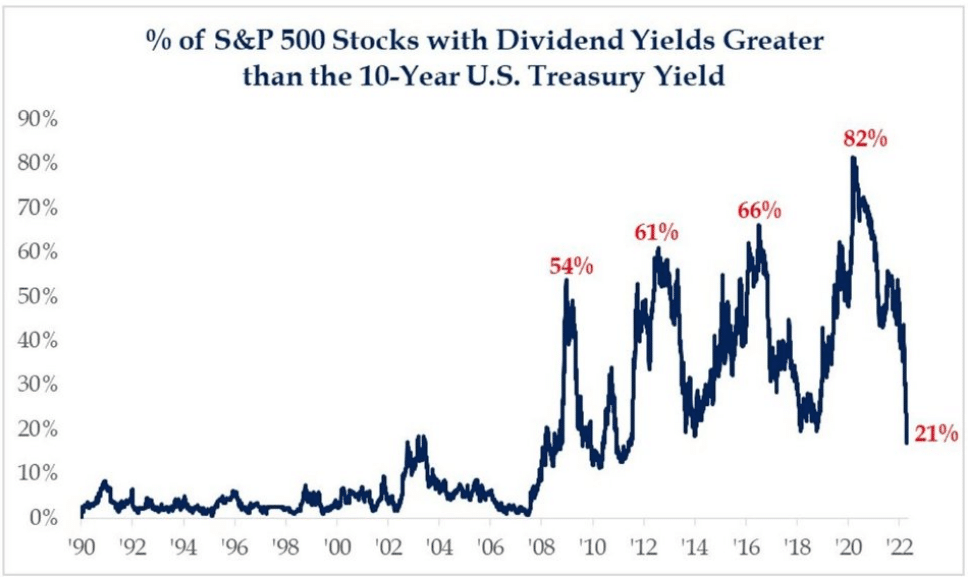
- The %age of S&P 500 stocks with Dividend Yields greater than the 10-Year Treasury has come under great pressure.
- Risk appetite has been calling, but TINA is washing her hair!
- There is now greater competition for every capital investment dollar as yields rise.
Research Report Excerpt #8
As such, the Equity Risk Premium has been falling, as previously detailed and depicted. But does the 10-year yield at 3% suggest it is a better value when compared to stocks or the S&P 500? The answer is NO, and a resounding NO based on history.
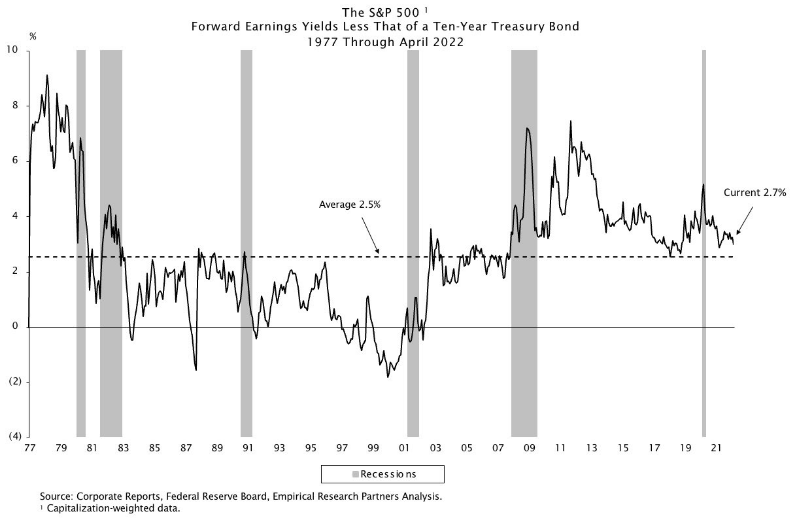
The chart above defines the trend of the Equity Risk Premium since 1977. Based on the “Current” 2.7% ERP, it still suggests that equities/S&P 500 offers the greater yield per capital dollar investment. How do we determine this mathematically and by way of the chart?
- With a 3.0% 10-year yield, and the S&P 500 trading at ~17.4x Finom Group’s 2022 EPS model of $240 (Earnings/Price = 5.7%), that implies a 2.7% equity premium.
- We are taking the $240 EPS and dividing it by the S&P 500’s closing value Friday of 4,124 which is roughly 5.7 percent.
- At 5.7% we then subtract the 10-year yield of ~3% to recognize the Equity Risk Premium/ERP is at 2.7 percent beyond the 10-year yield. As shown in the chart above, the ERP is still above the average ERP of 2.5% since 1977. This basically still suggests that the S&P 500 is cheap and therefore represents value to investors.
What you’ll also notice in the ERP charts above is that equities are far more valuable today on a ERP-adjusted basis compared to the Dotcom period. Notice how the ERP trend line was below zero during the Dotcom period. This outlines that Treasuries were actually a better value and, indeed, stocks were far overvalued back then. So if you are worried about a market crash, this would be the lesser likely outcome outside of an exogenous event. Equity index valuations have no likeness to the Dotcom period on an ERP basis.
Research Report Excerpt #9
Another signal that has been quite reliable when achieving a buyable bottom has been the 5-day Equity Only Put/Call Ratio (CPCE). Tom Bowley explains this signal, as follows:
“Every significant market bottom this century has occurred with a 5-day moving average of the equity-only put call ratio at .75 or higher. Nearly every one has occurred with this 5-day moving average at .80 or higher. And on Thursday, one of the worst days we’ve seen in a very bearish 2022 prints a .63 reading. In a nutshell, that’s the reason why we haven’t bottomed yet. Traders continue to believe that the market is suddenly going to surge right back to new highs. They’ve been “trained” to believe this by the last two years.
The following S&P 500 chart has the 5-day moving average of the equity-only put call ratio in the panel beneath it:
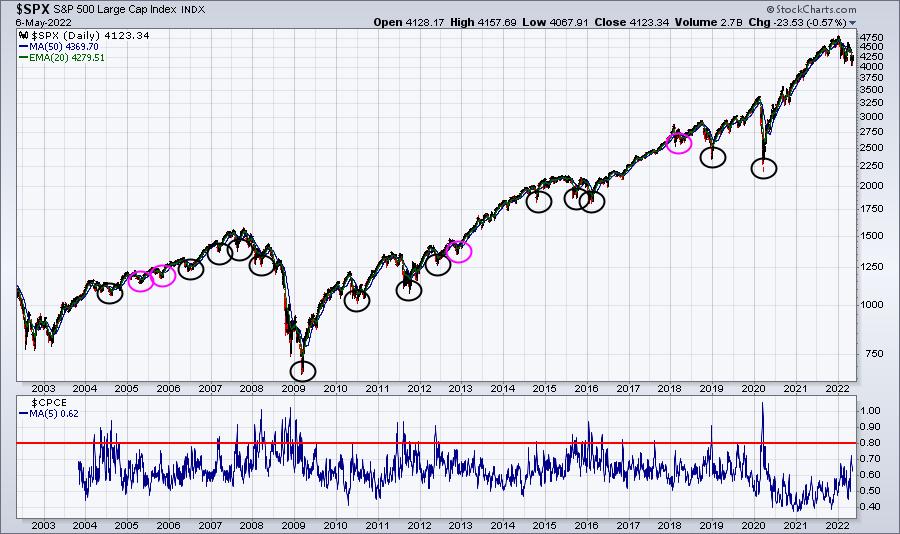
Circled are all the key price bottoms over the past 2 decades. There were 18 of them. 15 saw the 5-day moving average of the equity-only put call ratio peak at .80 or higher (black circles). The other 3 saw it peak at .75 (pink circles). There are no other key bottoms on this chart. Will the 2022 bottom be different from all the others? I doubt it.”


