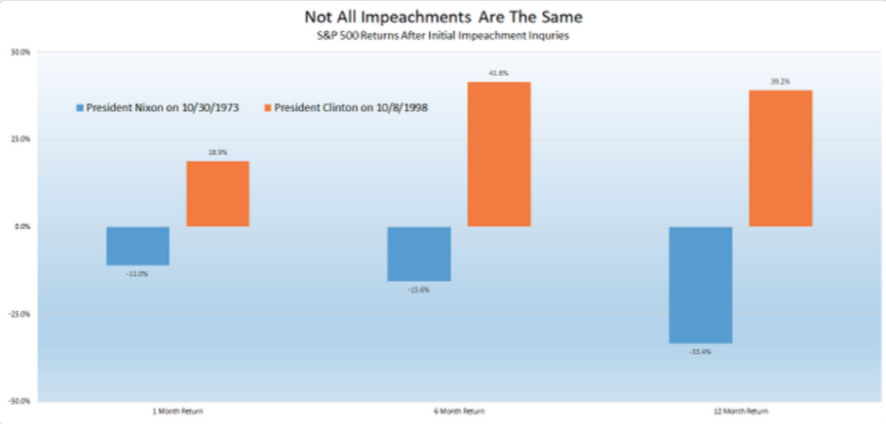
The only sample size smaller than two is obviously one, but that’s how many times the stock market has combatted an impeachment, inquiry or otherwise. And with the headlines buzzing on the latest impeachment inquiry, they took the equity markets on a wild ride Thursday. Only twice before have the markets dealt with the threat of a President being impeached/removed from office, Nixon ’74 and Bill Clinton ’98. The market’s reaction to each of these past impeachment proceedings was completely in opposition with the S&P 500 falling significantly in ’74 and rising sharply in ’98.
Thursday morning investors and citizens were delivered the release of the White House Administration’s call with the newly elected Ukrainian President. On the call, it was clear that President Donald Trump asked of the Ukrainian President to look into the Biden’s for potential criminal and/or political interference to their personal betterment, by Donald Trump’s determination.

The release of the transcript coupled with testimony from Director of National Intelligence Joseph Maguire, before a key House committee, found markets unsettled in early trading Thursday. By late afternoon, however, markets turned positive with a W-pattern formation in the S&P 500. Finom Group’s Wayne Nelson forecasted the W-pattern formation and discussed it in our Live Trading Room with members during the trading day.
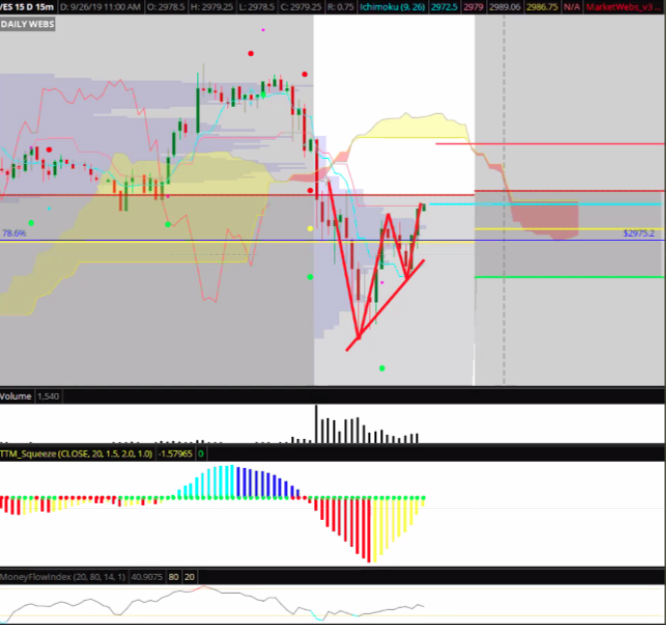
The pattern also coincided with money flow and volume increasing in the late afternoon. With the technical pattern on display, we aimed to also rationalize the reasoning for the dip buying activity that seemed to overcome the political uncertainties of the day. It was around the 3:00 p.m. EST hour that headlines out of China suggested more willingness on the part of China to purchase U.S. products that sent stocks into the green.

China’s top diplomat said on Thursday that China was willing to buy more U.S. products, and said trade talks would yield results if both sides “take more enthusiastic measures” to show goodwill and reduce “pessimistic language” in their trade dispute.
“And so, (on) the Chinese side, we are willing to buy more products that are needed by the Chinese market. We hope both sides can take more enthusiastic measures, reduce pessimistic language and actions. If everyone does this, talks will not only resume, but will proceed and yield results.”
Oddly enough, the late afternoon headline from China’s top diplomat came after Bloomberg reported that the United States is unlikely to extend a waiver allowing American firms to supply China’s Huawei Technologies. There has been no shortage for both domestic and geopolitical headlines this week. With all the issues surrounding the White House Administration, however, investors are still awaiting the widely anticipated resumption of trade talks in Washington D.C. And finally, some meaningful timeline was offered on Thursday and in this regard.
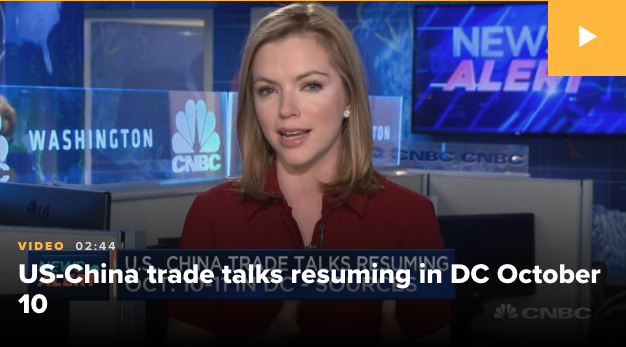
Trade talks between the U.S. and China are set to resume Oct. 10-11 in Washington, D.C., three people close to the talks told CNBC on Thursday. Chinese Vice Premier Liu He will be representing the delegation from Beijing.
Heading into the final trading day of the week, investors should be expecting additional “Breaking News”, but will likely be pleasantly surprised if headlines were absent the trading day. It’s been quite difficult for investors and traders to focus on either the technicals or fundamentals in the face of market moving headlines on a weekly and, sometimes, daily basis. With a looming impeachment inquiry hanging over the markets now, investors are most concerned with how the White House Administration handles trade negotiations and whether or not their counterparts will feel emboldened to await the results of the impeachment process. This is an unprecedented period for the markets.
With the geopolitical issues of the day/week evolving, we attempt to refocus our attention on market and economic fundamentals. The positive economic surprises continued on Thursday, with the release of Pending home sales data. Remember, it was on Wednesday that New home sales data hit a cyclical high.
“Sales of new single‐family houses in August 2019 were at a seasonally adjusted annual rate of 713,000, according to estimates released jointly today by the U.S. Census Bureau and the Department of Housing and Urban Development. This is 7.1 percent above the revised July rate of 666,000 and is 18.0 percent above the August 2018 estimate of 604,000. “
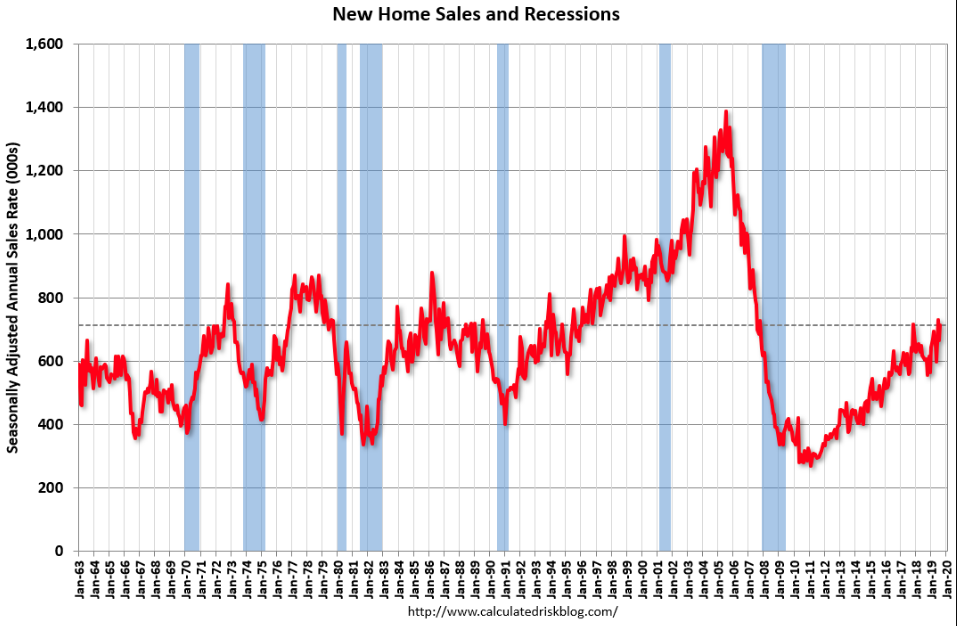
And not only were New home sales at a cyclical high when reported Wednesday, but the previous 2 monthly reports were upwardly revised and inventory declined sharply.
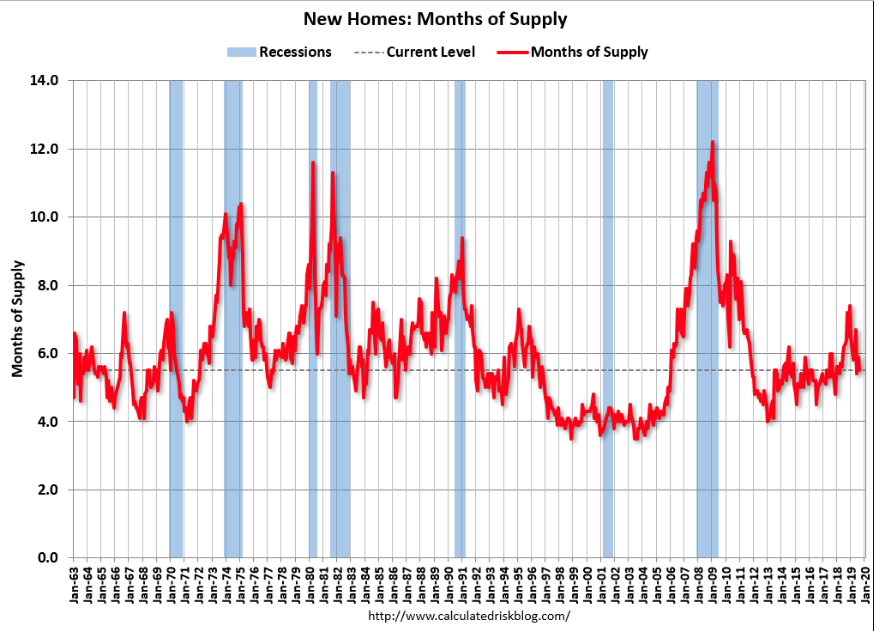
The months of supply decreased in August to 5.5 months from 5.9 months in July. The all time record was 12.1 months of supply in January 2009. Typically, we don’t see recessionary conditions in the economy with months of supply this low, as indicated in the chart above. Seven months of supply or greater would be concerning, as this is typically the level of inventory that has lead to recessionary conditions. But again, New home sales and inventory only served to foreshadow that which was to come by way of the latest Pending home sales data.
Pending home sales increased 1.6% in August, following July’s decline, the National Association of Realtors reported Thursday. Compared with a year ago, contract signings were up 2.5 percent.
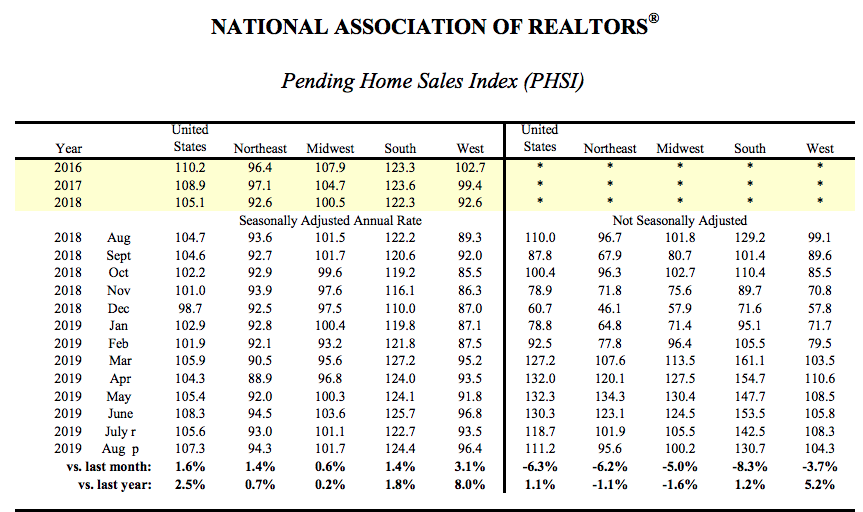
“The surge in mortgage applications in both August and September points to new cycle highs for sales around the turn of the year,” Ian Shepherdson, chief economist at Pantheon Macroeconomics, wrote in a research note. “Sales could well dip a bit over the next month or two, having overshot relative to mortgage applications for the past three months, but the trend is rising.”
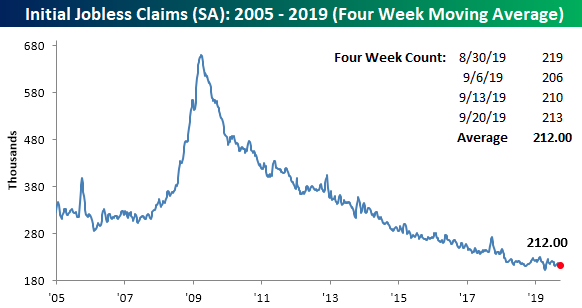
In addition to a string of strong housing data, Initial jobless claims only increased by 3,000 to 213,000 in the seven days ended Sept. 21. Jobless claims continue to hover around 50+ year lows.
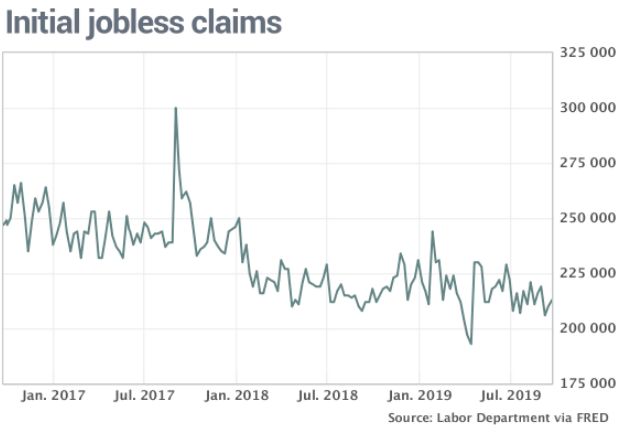
The main cause for the upward move in claims was due to the UAW auto-workers strike. Raw or actual claims, before seasonal adjustments, surged in Michigan after GM auto workers went on strike. Applications for benefits in Michigan more than doubled to 7,724 from the prior week. If workers return to work and get back pay, however, they’d have to return any government benefits. Management and workers are said to be close to a deal to end the impasse.
Nonetheless, the four-week moving average that helps to smooth out some of the fluctuations of this high-frequency data fell once again this week. Now at 212,000, the moving average has fallen for three consecutive weeks and is at its joint lowest (the week of July 26th also had a reading of 212,000) level since April. Looking ahead to next week, assuming no large revisions or a significant uptick in next week’s data, the moving average could potentially drop again as the high of 219,000 from the final week of August rolls off the average.
Friday’s economic data releases have wide-ranging implications for the Fed’s economic and inflation outlook, as the PCE data is set to be released. Alongside this data, investors await Durable goods orders, which have been moving higher in recent monthly reports, and the University of Michigan’s Consumer Sentiment report.
The health of the consumer is increasingly important with manufacturing contracting both domestically and around the globe. Within the PCE data, investors will get another look at consumer spending. We’ll have to wait a bit longer until the Census Bureaus latest monthly retail sales report, but in the meantime, the latest REdbook same store sales are proving out the consumer-centric economic strength in the Unite States.
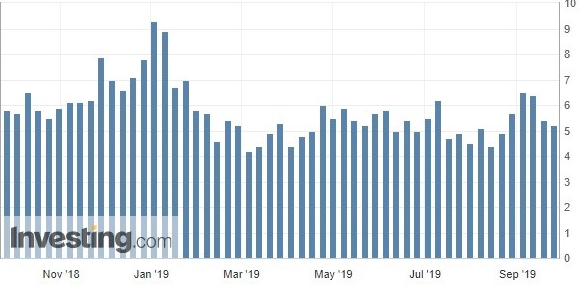
In the week of September 21st, the Redbook same store sales growth rate fell from 5.4% to 5.2%. That’s still very strong growth and suggests that tariffs and the trade war haven’t slowed consumer spending. As the chart above shows, Redbook data will face very tough comparisons in December. Notably, it strayed far from retail sales growth in that month as December is when yearly retail sales growth bottomed with the S&P 500 and as a government shutdown threat forced consumers into a more thrifty holiday period.
Moreover, with the better than expected housing sector data and jobless claims remaining at low levels, the Citi Economic Surprise Index has recently reached levels not seen since April 2018, as shown in LPL Chart of the Day.
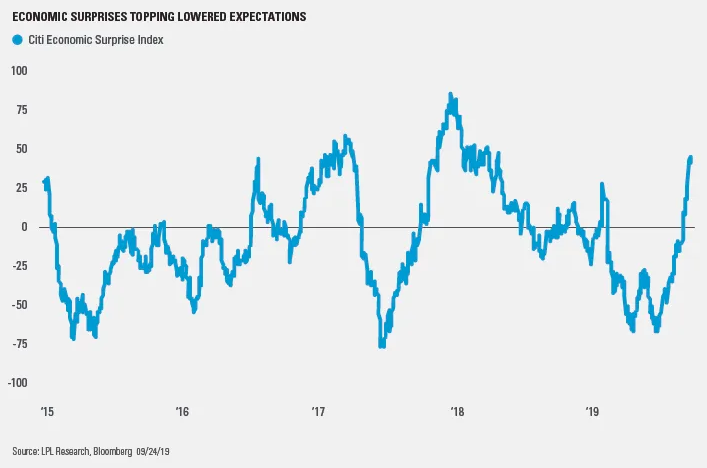
“With all the negative economic news we’ve seen, it’s easy to miss the recent stretch of upside surprises,” said LPL Financial Chief Investment Strategist John Lynch. “While the U.S. economy has slowed, it continues to show resilience in the face of softer global growth. Trade uncertainty may have offset the expected impact of fiscal stimulus on business spending, but we see still see some beneficial effects from new workers being pulled into the labor force. Add that to a more supportive Federal Reserve, and conditions remain in place for the expansion to continue despite some increased risks.”
It’s been Finom Group’s belief throughout 2019 that the U.S. economy is still expressing positive fundamentals despite trade uncertainty, manufacturing weakness, and slowing global growth. Consumer spending in particular continues to be strong and has been supported by low unemployment, steady wage growth, contained inflation, and low interest rates. For those who might have suggested lower rates from already low cyclical rate regimes wouldn’t amount to much in the growth of the economy, this thesis has been disproven by way of the housing sector data for much of 2019. With the Fed pausing rates in early 2019 and now easing by 25 bps in two consecutive meetings, financial conditions have loosened and aided in creating more favorable conditions for interest rate sensitive sectors of the economy. Speaking of financial conditions.
The National Financial Conditions Index (NFCI) ticked down to –0.74 in the week ending September 20. Risk indicators contributed –0.32, credit indicators contributed –0.26, and leverage indicators contributed –0.14 to the index in the latest week.
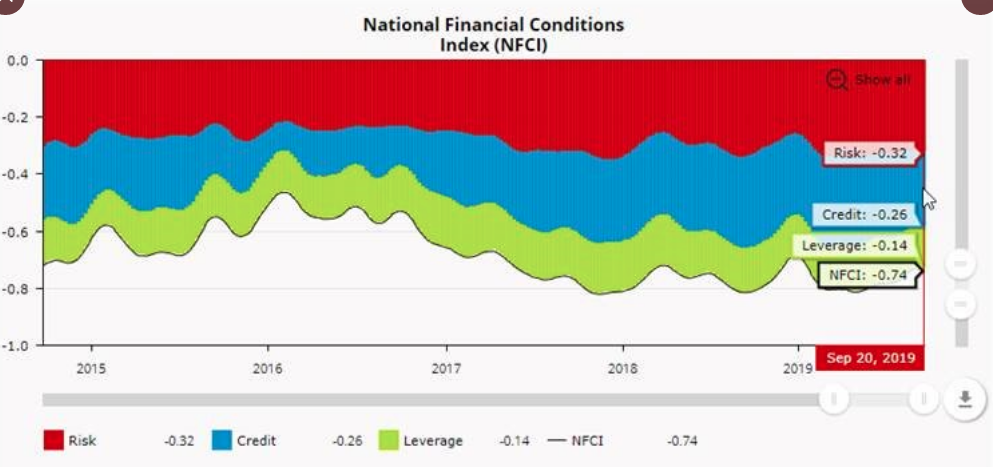
With the latest and easier financial conditions noted, here is how Canaccord Genuity’s Tony Dwyer characterizes the latest NFCI and as it relates to the credit markets and free flowing credit through the economy:
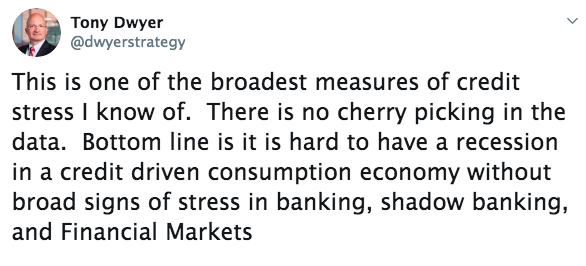
If only there was the perfect economy and perfect market, but that simply isn’t the case. We have what we have and what we have is pretty darn good at the moment in the way of both, which of course, could change rather quickly. The trade war carries on and the political environment is only getter worse domestically. Having said that, we can’t lose sight of what drives markets over time, earnings! And while Nike’s earnings proved to support the bull market thesis, certain sectors of the economy have waned under the pressure of the protracted trade war such as FedEx (FDX). The trade war was also a notable impact on the semiconductor sector and within the most recently reported results from Micron Technologies (MU).
On Thursday afternoon, the memory giant reported August quarter (fiscal fourth quarter) revenue of $4.87 billion (down 42% annually) and non-GAAP EPS of $0.56, topping consensus analyst estimates of $4.59 billion and $0.51. However, the company also guided for November quarter revenue of $4.8 billion to $5.2 billion (down 37% annually at the midpoint) and EPS of $0.39 to $0.53, which compares with consensus estimates of $4.8 billion and $0.53.
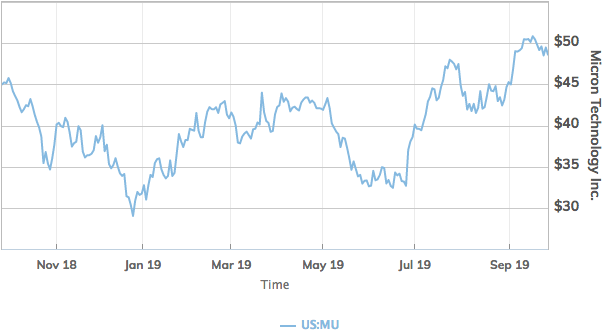
Even though U.S.-China trade problems may continue to stifle sales to Huawei Technologies Co. over the coming quarters, returning demand in the industry is “solid,” said Sanjay Mehrotra, Micron chief executive, on the call.
“And the second half, as the demand is back, the customer demand is back and yes there may be some level of inventory build in China due to the reasons that I mentioned by certain customers,” Mehrotra said. ”But I’ll tell you that we do not think that that inventory build is anywhere close to the kind of inventory build that had gone on in the second half of last year.”
Earnings season will officially kick-off in mid-October, but by that time 2-dozen S&P 500 companies will have reported results already. FactSet estimates the earnings decline for the third quarter is -3.8%, which is slightly larger than the estimated earnings decline of -3.7% last week. One of the biggest negative impacts to the earnings outlook is the Information Technology sector and Micron was forecasted to be the most negative standout.
The Information Technology sector is expected to report the second highest (year-over-year) earnings decline of all eleven sectors at -10.2 percent. At the industry level, four of the six industries in this sector are projected to report a decline in earnings: Semiconductors & Semiconductor Equipment (-31%), Technology Hardware, Storage, & Peripherals (-14%), Electronic Equipment, Instruments & Components (-11%), and Communications Equipment (<-1%). On the other hand, the other two industries in this sector are expected to reporting earnings growth: Software (8%) and IT Services (5%).
As we close out the trading week, we remind investors that despite the increase in volatility this week, the market has done very little and the S&P 500 is down 15 points coming into Friday’s trading session. The weekly expected move is $47/points and may not be achieved for the 2nd consecutive week. But you never know given the proclivity for market moving headlines that have been delivered daily.
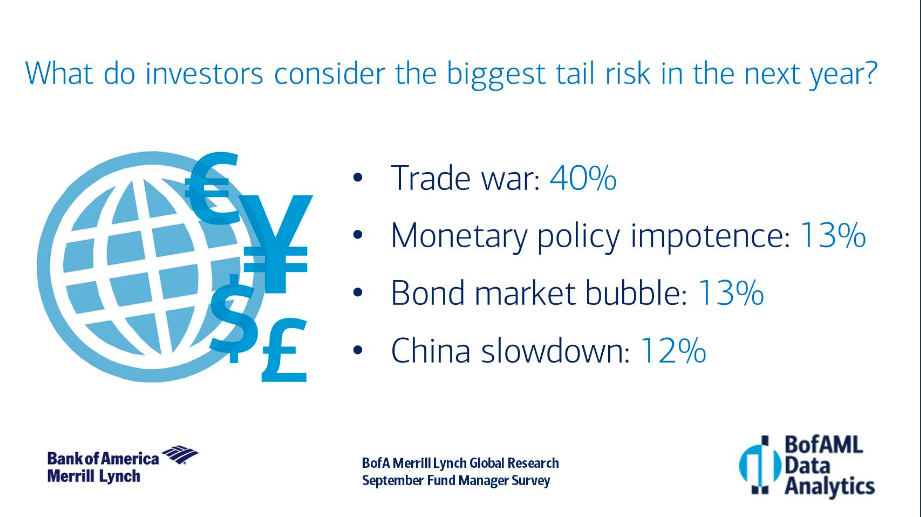
Investors are certainly on high alert for headlines and the biggest investor concern remains with the trade situation. According to the latest BofAML Fund Manager Survey (FMS), investors continue to cite a trade war as the top risk to markets in the coming 12 months.
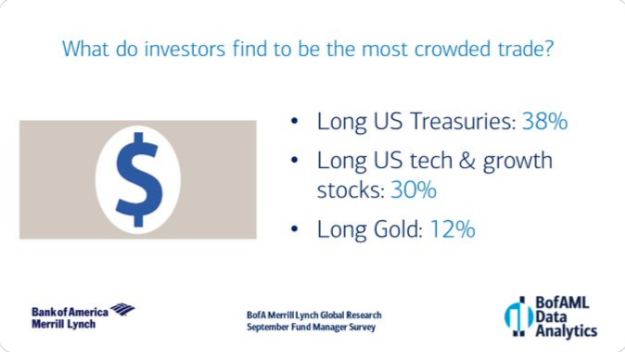
This is one of the biggest reasons, fear of the trade war impact on the economy, that the flight to safe haven assets remains a robust trade. For the 4th straight month, investors cite Long U.S. Treasuries as the most crowded trade according to the FMS.
It’s unlikely the S&P 500 will hit an all-time high on Friday. I think we can safely say that and without an un-forecastable headline declaring the end of the trade war. So with that in mind, it has now been 43 trading days since the S&P 500 last made an all-time high. Over that 43 day trading period, the S&P 500 has not touched the 200-day moving average intraday. If institutions and insiders believe the end is near, that will change in short order.
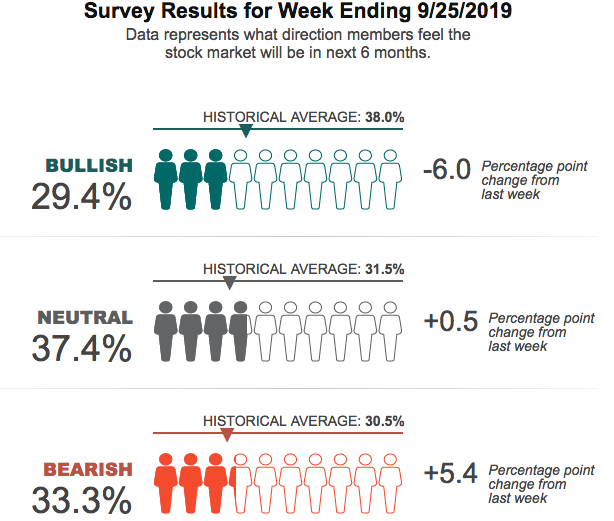
As we head into the month of October next week, we do so with depressed investor sentiment.
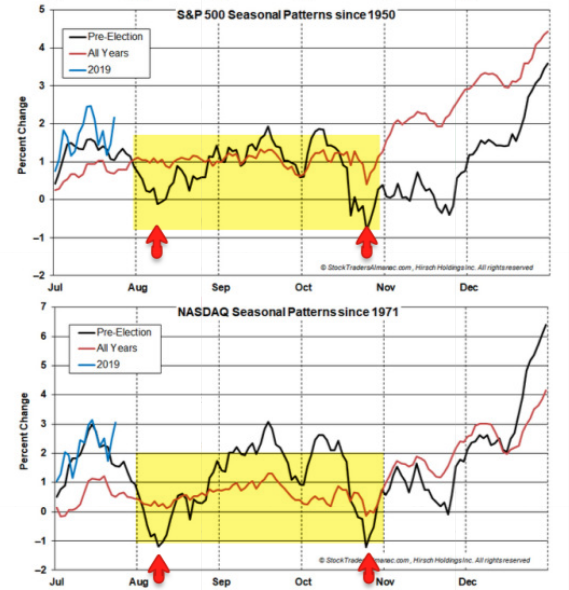
But keep in mind that historically, the first couple of weeks in October are typically bullish for the stock market. But then, it could get dicey again according to the Traders’ Almanac seasonal pattern tracking back to 1950.