
Welcome to another trading week!! In appreciation of all of our Basic Membership level participants and daily readers of finomgroup.com content, we offer the following excerpts from our Weekly Research Report. Our weekly Report is extremely detailed and has proven to help guide investors and traders during all types of market conditions with thoughtful insights and analysis, graphs, studies, and historical data/analogues. We encourage our readers to upgrade to our Contributor Membership level ($7.99 monthly, cancel any time) to receive our Weekly Research Report and State of the Market Videos and take advantage of this ongoing promotional event today! Have a great trading week, be in touch, and take a look at some of the materials in this weekend’s published Research Report!
Research Report Insight #1
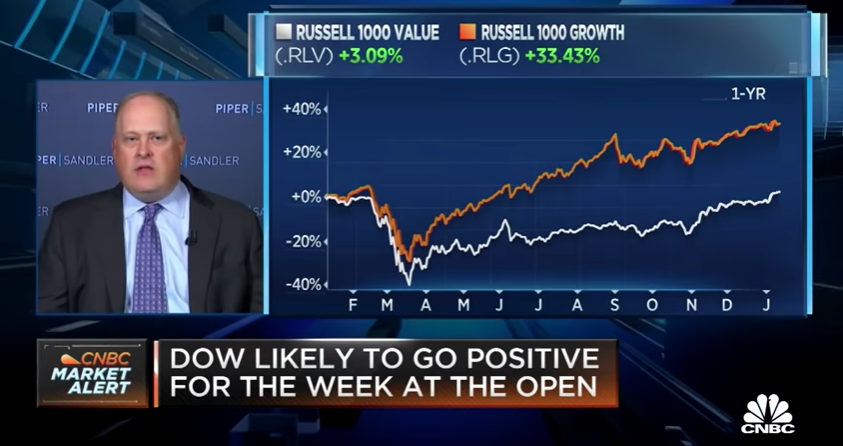
What’s more troubling, from my perspective, is that such strategists/analysts continue to offer the same calls month-after-month, and regardless of markets’ trend, amongst many variables. Craig Johnson marched out on CNBC just this past week, and once again with markets under pressure, to reiterate his market correction call.
A couple of reasons Johnson continues to beat the correction call drum are as follows:
- Rates rising typically prove a headwind for equities
- First year of a New Presidential year historically delivers a 5.8% return
- Also, see a drawdown of roughly 16% over the first year of a New Presidential year, which would indeed take the SPX down to the 200-DMA. How coincidental?
Sure, I could be like many strategists/analysts and forecast a correction based on a knee-jerk reaction at the first sign of market weakness, but that’s a guessing game I’ll leave for others to perform. I don’t know when a 10 or 15% correction may occur and neither does anyone else despite their efforts to tell us otherwise. Frankly, I don’t care either.
Research Report Insight #2
Below are some like-thoughts from Morgan Stanley’s chief equity strategist Mike Wilson and BofA’s Michael Wilson; you can’t make this stuff up folks!
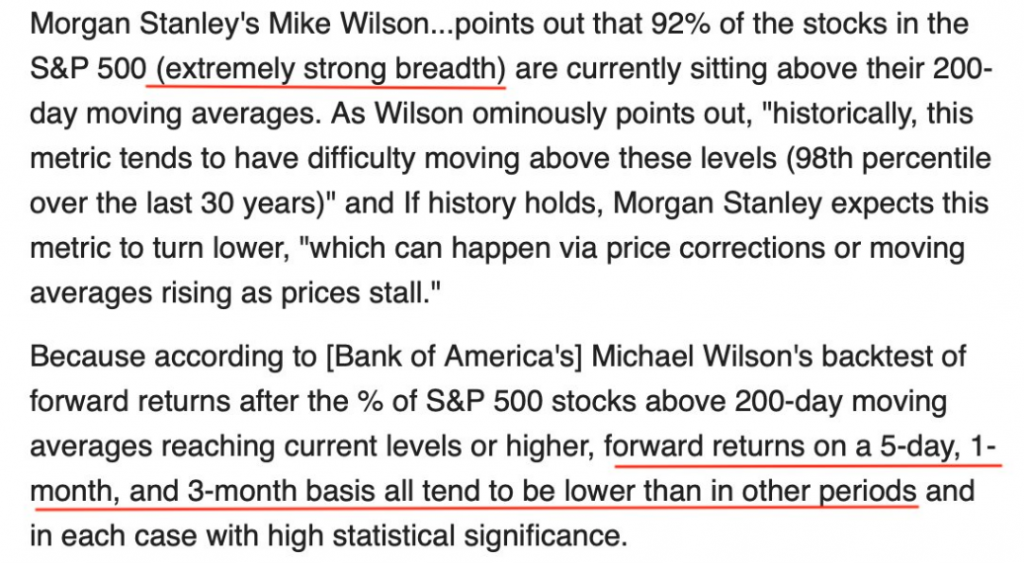
Let’s not dismiss the offerings from the “Wilsons” folks! For now it is important to recognize that stocks and equity markets don’t grow to the sky in a straight line. They aren’t trees. Mirroring a similar sentiment, don’t be the investor that plants trees in front of their progress, focusing on every little potential headwind and pitfall in the economic/market recovery. These are to-be-expected, not “to-be-planted” as long-term obstacles.
Research Report Insight #3
qual-weight leading informs us that this is a broad equity market move, not a concentrated equity market rally over the last 9 months.
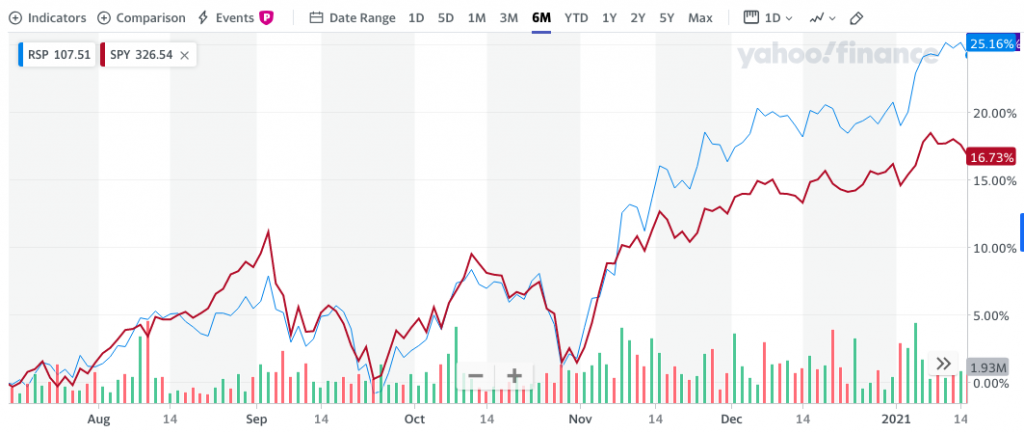
The market could never have achieved the breadth strength it had over the last few months without getting most stocks on-board with the market and economic recovery trend.
Research Report Insight #4
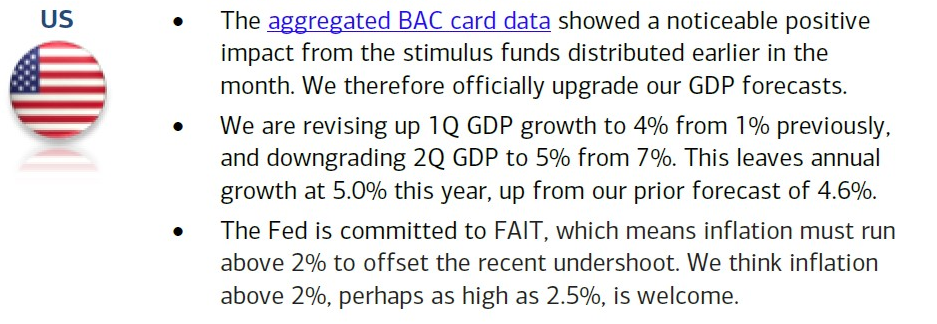
This was the weakest NFIB survey since May, but again, it looks back at the December period when Covid19 started to peak and regional economic restrictions increased. It also recognizes a period “without” the benefit of the recently passed fiscal relief package that granted tax payers $600 checks and $300 in additional weekly unemployment insurance benefits. These are not points to dismiss, but rather to recognize as potentially boosting economic output from the month of January onward. Bank of America believes my sentiment to be valid as they recently adjusted their Q1 GDP model.
As offered, a goodly amount of the economic outlook is predicated upon fiscal relief implementation as well as getting the pandemic under control. We’re starting to see the benefits of regional economic restrictions and possibly the early vaccination protocols in the daily/weekly virus data.
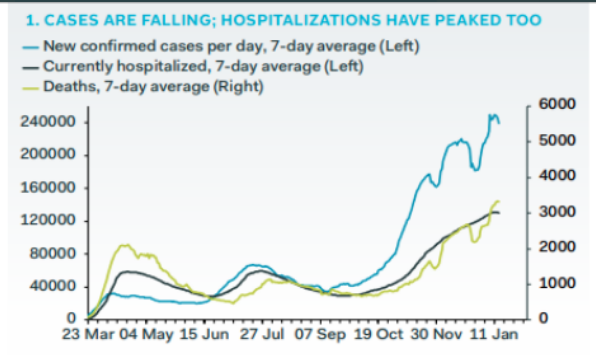
U.S. new Covid19 cases were down 10%+ WoW yesterday for a 2nd day running. It was also the first drop in deaths WoW for a non-holiday period since 11/12/2020. Hospitalizations were also down 10% WoW. Positive test rates have been falling even as test counts continue to rise 20% WoW.
Research Report Insight #5
Fast-forward to the week that was and with big money center banks starting to report Q4 results and we’ve already seen a significant upward revision by FactSet.
- For Q4 2020, the estimated earnings decline for the S&P 500 is -6.8%, up from the previous forecast for a decline of -8.8%.
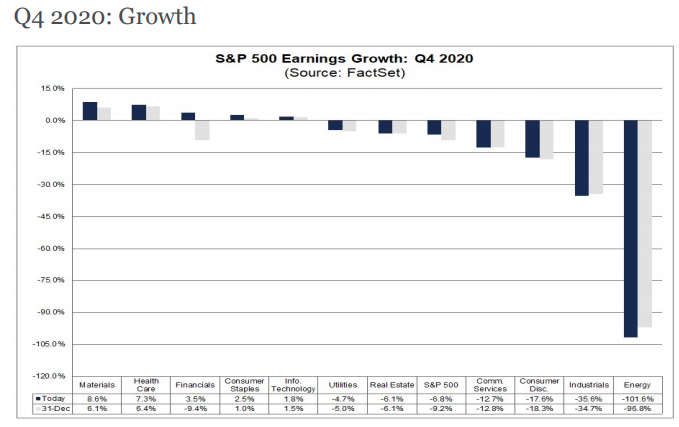
You have heard me say many a time over the last 90 days that I would be looking for FY2020 EPS to come in with a $140+ handle, not a $138+ handle. It would appear as though my sentiment and outlook may come to fruition at the early stages of Q4 reporting season. Additionally, this is now the key question FactSet has posed in its weekly report, as follows:
Research Report Insight #6
Goldman Sachs reminds investors that without the ability to fully assess the validity of current economic forecasts, valuations are historically rich for equities.
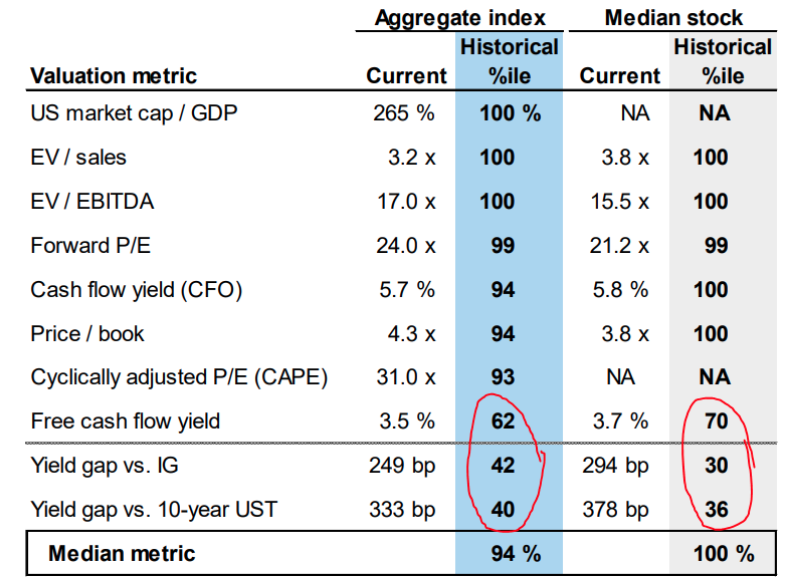
Stocks are currently pinned at max valuations, except when compared with free cash flow (better business models dominate S&P/low debt costs) and bond yields.
Research Report Insight #7
The NAAIM Exposure Index, which provides insight into the actual adjustments active risk managers have made to client accounts over the past two weeks, jumped above 100 again.
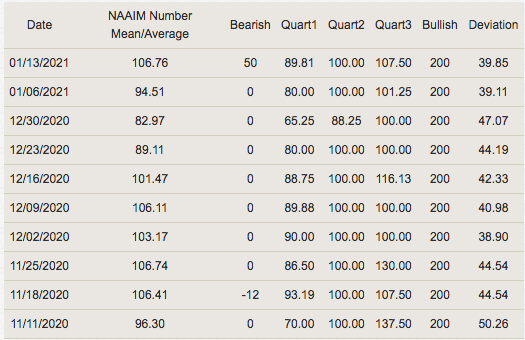
Keep in mind that this type of equity market exposure, for more than a month, has not been seen since Q1 2017. Such clustering of market exposure and sentiment had proven to limit market corrections in the past (November 2016 – January 2018) to less than 3% off the all-time high for the S&P 500.
Research Report Insight #8
Elsewhere in “analogueville”…
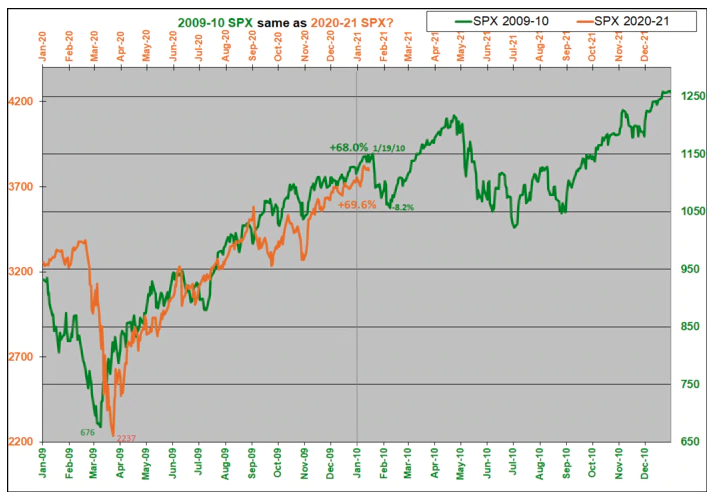
Since fully completing the 2009 analogue in 2020, the 2010 analogue also remains a probable guide for 2021. As displayed in the analogue above, indeed a downturn is supposed to commence on 1/19/2021, as it did on 1/19/2010. Just as the analogue for 2009 was a strong replication in 2020, it may prove to hold similar imperfections for the 2010 analogue related to path and plane/timing. So far in 2021, it seems the alignment is precise and if that persists it calls for an 8.2% total correction in the coming week/s. Such a correction also portends new highs thereafter from March into Q2 2021. One way or another, we’ll have more information regarding the 2010 analogue and 2016-2018 analogue this coming week.
Research Report Insight #9
When dissecting what went wrong for the category during the month it struck me that the calendar had shifted on a YoY basis. This is validate in the NOT SEASONALLY ADJUSTED Nonstore retail sales chart below:
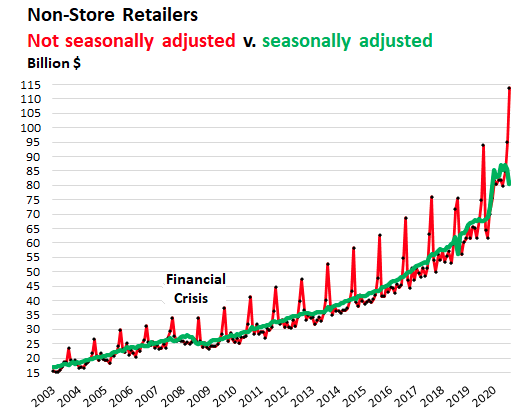
Not seasonally adjusted, sales at non-store retailers spiked by 19.7% in December from November to a new record of $114 billion, up 22.2% year-over-year, pushing them to a record share of 18.4% of total retail sales. For the entire year 2020, sales at non-store retailers jumped by 22.1% to $971 billion. This should have been realized by many economists and market participants given the economic environment.
In laymen’s terms, and if we didn’t have the actual sales totals disseminated from private companies, the calendar (seasonally adjusted) played tricks with the December retail sales. In 2019, Thanksgiving occurred in the last week of the month, pushing the last Sunday and full Black Friday weekend into December along with Cyber Monday. That was not the case in 2020, as the full Black Friday weekend and Cyber Monday were all condensed into the November calendar.
Thank you for joining us for another trading week and reviewing our weekly “Must Knows”! To receive and review our weekly, full-scale Research Report each Sunday and our State of the Markets weekly video analysis every Thursday, subscribe to our Contributor Membership level at just $7.99 monthly (Cancel any time)! With these two weekly deliveries, you’ll have all the unbiased and fact-driven market and economic data analysis at your fingertips. Don’t make capital allocation decisions based on headlines that brush the surface of what is and isn’t affecting markets. Let our deep-dive analytics supply you with bottom-up and top-down analytics. You won’t be disappointed. Upgrade today!!


