As we look to round out the trading week with U.S. equity futures seemingly brushing off failed votes to reopen the U.S. government and a mixed bag thus far through earnings season, investors will have ample time to study the technicals of the market throughout the weekend. And with that in mind it shouldn’t be lost on those investors/traders who desire to get a jump on next week’s earnings releases that will include a heavy dose of tech sector earnings releases. Apple Inc. (AAPL) will be the first of the FAANG stock’s to report next week and since Netflix (NFLX) reported, which was found to beat estimates but fall in price due to guidance. As it pertains to the FAANG stocks or stock index, the following chart is rather eye opening.
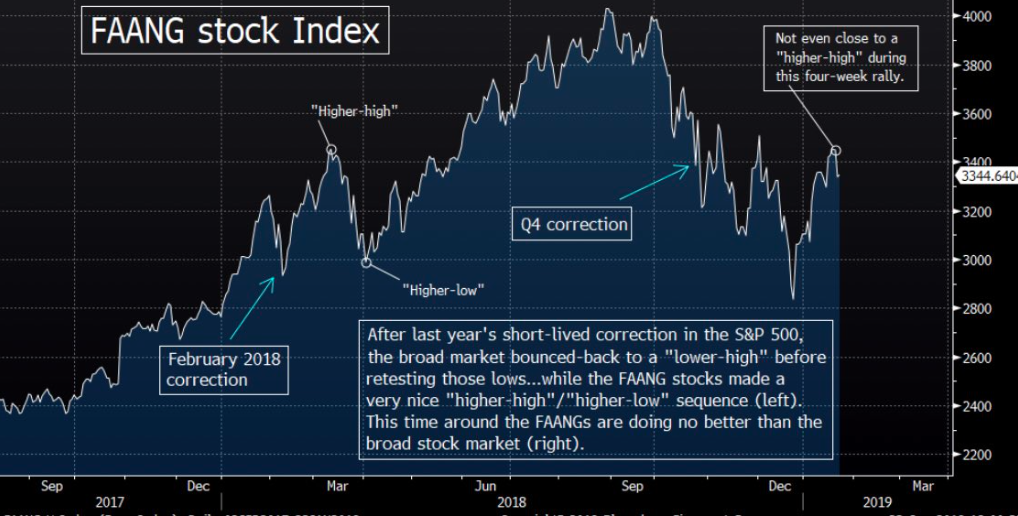
In our State of the Market weekly video-blog, whereby Wayne Nelson and I discuss the weekly issues facing the market and investors, we dive into the chart. At first glance what is eerily transparent in the FAANG index chart is the head-and-shoulders chart patter that seems to have begun in march of 2018 with the left shoulder, peaked in September with the head and is presently forming a right shoulder in January 2019. It will take some heavy lifting to change the presentation of the chart, but on a positive note, the same head-and-shoulder pattern was created in January 2018 through May 2018, also depicted in the chart. We’ll see how it shakes out starting next week, but if Netflix was any indication of what may come to FAANG…
The S&P 500 (SPX) enters Friday still attempting to claw its way back from a Tuesday sell-off. For the week, SPX is down $28/points. The weekly expected move is $41/points, which was actually achieved in a single day on Tuesday and as such it proves irrelevant Friday although we’d be of the opinion that the market will probably stay within the weekly move expectations for the week. This is suggested because Asian markets had a strong overnight session, coupled with a strong start to the European trading day. There’s not enough of a catalyst to produce an outsized move for the SPX today unless a headline of consequence, pomp and circumstance surfaces. As such, I’d be of the opinion the weekly expected move isn’t breached to any degree of significance. With that being said let’s look at some of the most recent economic data released.
One of the consequences from the prolonged government shutdown has been the lack of reporting of certain government, economic data. This article from Reuters outlines which pieces of economic data have gone unreported due to the shutdown.
“The first casualties were November’s new-home sales, advance trade, wholesale and retail inventories reports, which were scheduled for release in the last week of December. Publication of these reports for December is also likely to be delayed.
Also postponed was November’s construction report detailing the value of construction work on new structures or improvements to existing structures for private and public sectors. Trade data for November was also delayed.
November business inventory data as well as the factory orders report has been delayed. December’s retail sales, housing starts and building permits data have also not been released. It is unlikely that December durable goods orders, personal income and consumer spending reports will be published.”
On Thursday, we did get some indication on the strength or weakness of the economy through Initial Jobless claims. Initial jobless claims, a rough way to measure layoffs nationwide, fell by 13,000 to 199,000 in the seven days ended Jan. 19.

That’s the lowest reading since Nov. 15, 1969, and underscores the strength of a U.S. labor market that’s helped the U.S. economy grow for almost 10 years. Economists polled by MarketWatch had forecast a 218,00 reading.
As it pertains to the labor market, while you may hear and see media headlines touting the jobs data as being backward looking, this type of commentary seems illogical. Given the costs associated with hiring an employee (upwards of $2,000-$3,ooo), most employers are hiring based on what they see for their business going forward, not what has happened in the past.
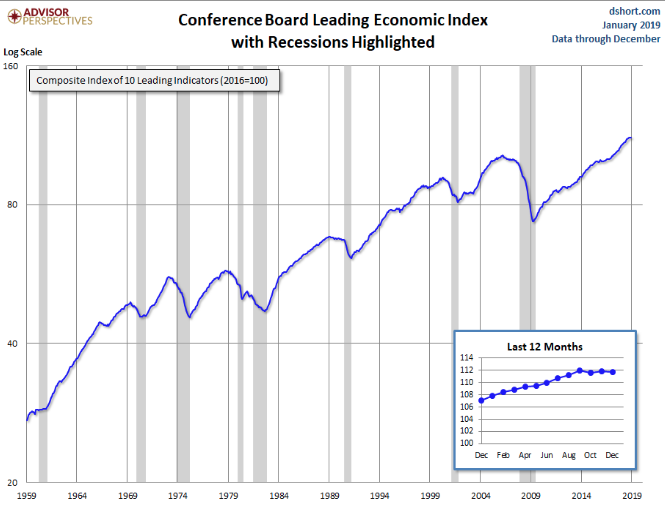
In addition to a strong Initial Jobless Claims report, Leading Economic Indicators data was released with little fanfare. We characterize it as such because much of the data that goes into the LEI is absent due to the government shutdown. Nonetheless, the data showed the economy was still in expansion mode, although the data did suggest slowing economic growth ahead.
The latest Conference Board Leading Economic Index (LEI) for December decreased fractionally to 111.7 from 111.8 in November. The Coincident Economic Index (CEI) came in at 105.1, up from 104.9 the previous month.
“Please note that due to the government shutdown, data for manufacturers’ new orders for consumer goods and materials for November and December and building permits were not published for December. The Conference Board has forecasted these series in order to publish a preliminary Leading Economic Index. Data for manufacturers’ new orders for nondefense capital goods excluding aircraft for November are from the advance report for Manufacturers’ Shipments, Inventories & Orders. In addition, The Conference Board is postponing the regularly scheduled annual benchmark revision of the composite indicators until all underlying data are available.
The Conference Board LEI for the U.S. declined slightly in December, according to preliminary estimates. Large negative contributions from stock prices and the ISM® New Orders Index more than offset the large positive contribution from average weekly unemployment claims. In the second half of 2018, the leading economic index increased 1.5 percent (about a 3.1 percent annual rate), slower than the growth of 2.7 percent (about a 5.5 percent annual rate) during the first half of the last year. However, the strengths among the leading indicators remain more widespread that the weaknesses.
The Conference Board CEI for the U.S., a measure of current economic activity, increased in December. The coincident economic index rose 1.2 percent (about a 2.3 percent annual rate) between June and December 2018, slower than the growth of 1.0 percent (about a 2.0 percent annual rate) in the first half of 2018. However, the strengths among the coincident indicators have remained very widespread, with all components advancing over the past six months. The lagging economic index continued to increase, but at a faster rate than the CEI. As a result, the coincidentto-lagging ratio is down moderately. Real GDP expanded at a 3.4 percent annual rate in the third
quarter of 2018, after increasing 4.2 percent (annual rate) in the second quarter.”
There are some ramifications from the government shutdown occurring beneath the surface of the stock market. While it’s apparent that we haven’t seen much reaction from the stock market to date, that may not be the case in the near future and as labor and employment data roll out next week. We’ve already seen some of the ramifications in the latest Consumer Sentiment report released last week.
“The shutdown hasn’t materially affected stock prices yet,” Ryan Nauman, market strategist with Informa Financial Intelligence, told MarketWatch. “But it has hurt consumer and business sentiment, and if continues another few weeks, it will start to have a measurable impact on the economy, and when investors see that impact, stocks will get hit,” he said.
“Because people are talking about the shutdown, it matters,” argued Michael DePalma, chief executive officer of PhaseCapital, in an interview with MarketWatch. “We see it influencing sentiment, but we’ve not yet seen it show up in the hard data,” like those describing GDP growth or the state of the labor market.
Kevin Hassett, chairman of the White House Council of Economic Advisers, told CNN on Wednesday that first-quarter gross domestic product growth could be near zero if the shutdown doesn’t end soon, but said much of the lost economic activity could be made up in the spring. We wouldn’t be of the opinion consumption rebounds that quickly without some other form of stimulus occurring simultaneously; possibly a trade deal announcement will be necessary to recapture the confidence of the consumer.
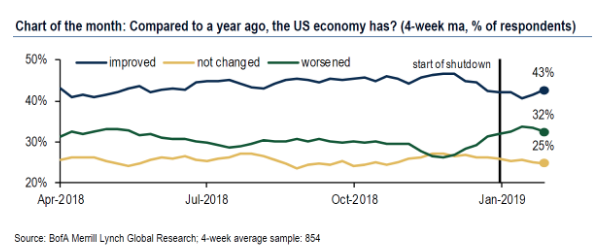
Bank of America Merrill Lynch economist Joseph Song warned that deteriorating consumer sentiment could mean that lost consumption won’t be recaptured so quickly. Song points to a recent consumer survey sponsored by the bank that shows a material worsening of consumer sentiment just as the government shutdown began. “Though the plurality of respondents still feel good about the economy, recent trends show sings of greater concern about the economy.”
While it may sound like we’re throwing “sour grapes” on the January market rally, we’re simply pointing out the potential pitfalls that may lay ahead for the market and investors/traders. When we review the macro risks near term and the tendency for market symmetry to be exercised, it pays to navigate the market rally with prudence and a certain degree of caution.
When we look for potential warning flags in the market we tend to look for disruptions in market correlations. By and large, most market correlations are in tact, but one is not necessarily in tact. The equity to bond market correlation shows signs of distress. While the S&P 500 has risen in January by more than 10%, the 10-year Treasury yield (TNX) has remained stagnant. When bonds are rising, yields go lower. When bonds are sold, yields rise. As such and with the SPX rising we would expect to see bonds reflect the “risk on” trade. As shown in the chart of TNX/SPX below, that simply hasn’t been the case of late.
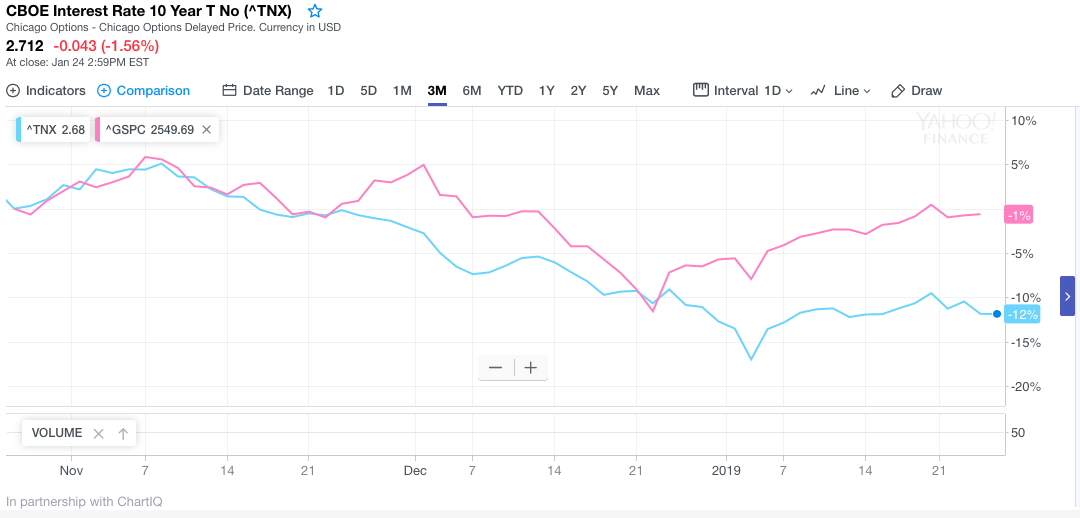
Given the usual correlation between SPX/TNX, it leaves us to question whether or not the bond market is pricing in risk to the equity market near-term. The correlation is flashing yellow, but not red at present and as such we’d keep a watchful eye on the correlation. Most other market correlations are in tact including the commodities to SPX correlation. As oil has risen in recent weeks, stocks have risen. As stocks have risen in recent weeks, precious metals have stagnated and/or fallen in price. These are the typical “risk on” correlations that we like to see.
The S&P 500 has performed well through the early portion of earnings season and post the financials reporting cycle. The financials have led the market as they constitute significant market capitalization value and weighting. In order for the S&P 500 to maintain its current upward trend it will not only rely on continued strength from the financial sector (XLF), but also strength from the tech sector when many of the tech heavy weights begin reporting next week. It’s a tall task to accomplish, but most obviously it’s been done before. Given the aforementioned market requirements, we take a look at where the S&P 500 is at present.
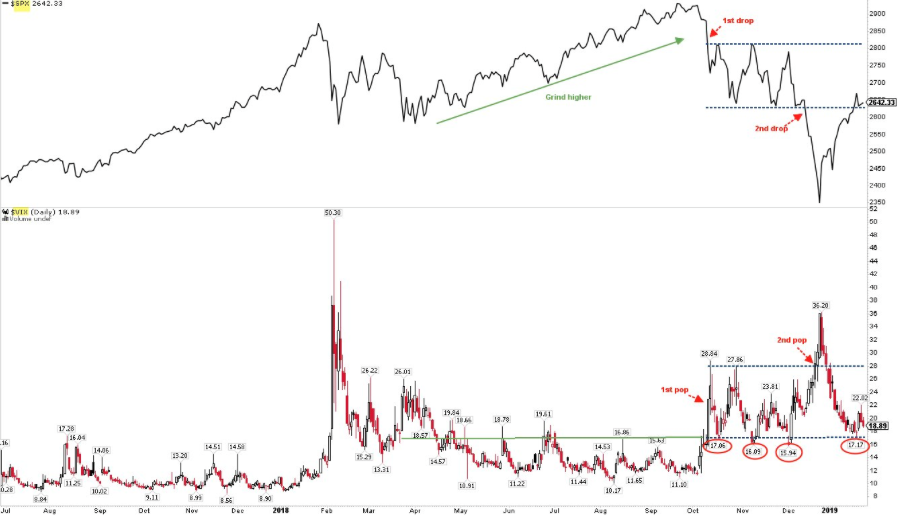
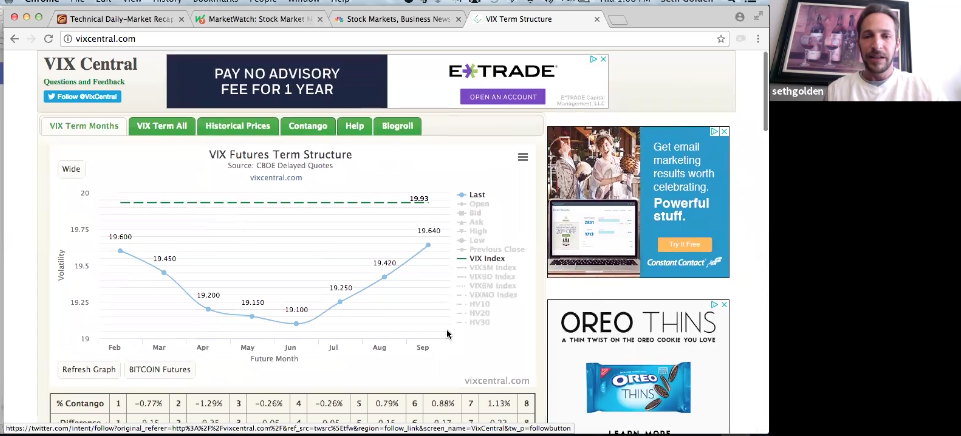
The chart above represents the longstanding S&P 500 BOX. Within the box resides where greater volatility (bottom chart VIX) has occurred in the market back in Q4 2018. As depicted, the S&P 500 has elevated back into the BOX, which defines resistance levels of significance. In order to travel to the upper bands of the BOX, we’ll need to see strong earnings guidance for 2019 and resolutions from the various macro-issues that have long since weighed on investor sentiment. In Finom Group’s latest State of the Market video blog, we discuss the various macro issues and overall market conditions. Additionally, within the video we firstly discuss the latest bouts of volatility in the market. Please click the link to access the video
Video Outline:
- Market volatilty, VVIX-VIX correlation and normal hedging activity, VIX Futures Term structure (1-13 minutes)
- VXX will be maturing on Jan 30 and replaced with VXXB
- Macro headline risk discussion, ECB holds rates steady w/rate hikes possibly not until the summer, Davos sentiment & tone concerning global economic slowdown (17-21 minutes in)
- Duration as a trader, cash is a position, China/U.S. trade headlines are confusing, Fed pause gives market & economy time to speak to Fed and lend to raising rates or not raising rates. U.S./China trade dispute will result in A DEAL, not a GREAT DEAL (22-30 minutes in)
- Economic data lapsing during government shutdown. Creates uncertainty around consumer spending, retail sales and housing sector. Market has stalled, hit $41 weekly expected move on Tuesday and now inside resistance zone. Some economic data is being released and is favorable i.e. PMI and Initial Jobless claims at lowest level since 1969. (30-39 minutes in)
- Tech earnings kick off next week and are presently driving market. FAANG Stock Index chart signaling head-and-shoulders pattern. (40-49 minutes in)
- Shorting Volatility as a natural order of market functionality. (50-54 minutes)
- XLF and SBUX 2018 investment thesis discussion. What went wrong and what went right with the experience. Risk management (55-60 minutes in)
- How to better navigate, send messages and post on Finom Group.com
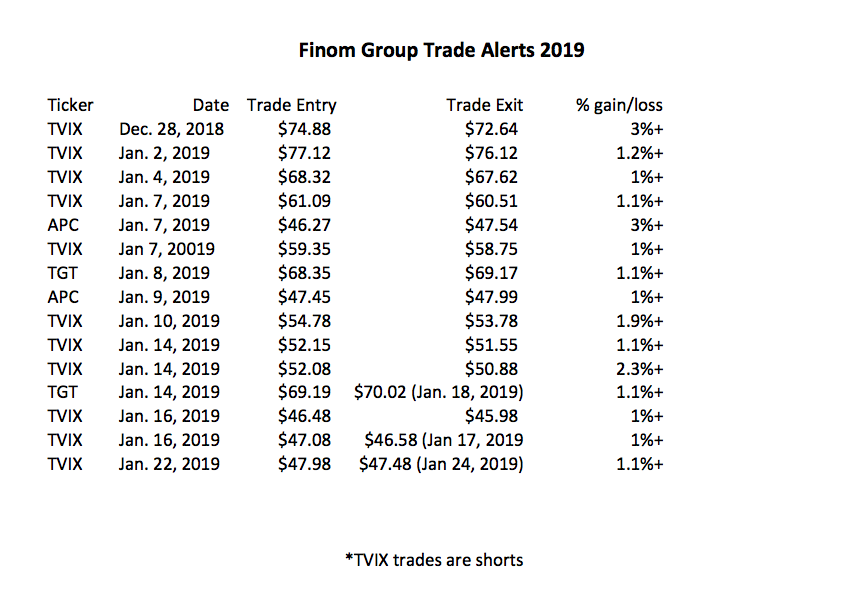
Thank you for reading and viewing our article and video blog. We certainly hope the information lends itself favorably to your portfolio management decisions. Subscribe to our Premium Membership today to access our trade alerts and research reports. Our year-to-date trade alerts have maintained a high rate of success and can be found in the table below.