Research Report Excerpt #1
We often hear that if you bought the peak in 2000 or peak in 2007 you would have had to have waited X number of years until the index got back to break-even, or its former high. While that’s a measured understanding of price, that doesn’t have to be the measured representation of your portfolio. That’s where Time and Cash come in handy. Every correction/bear market has rallies.
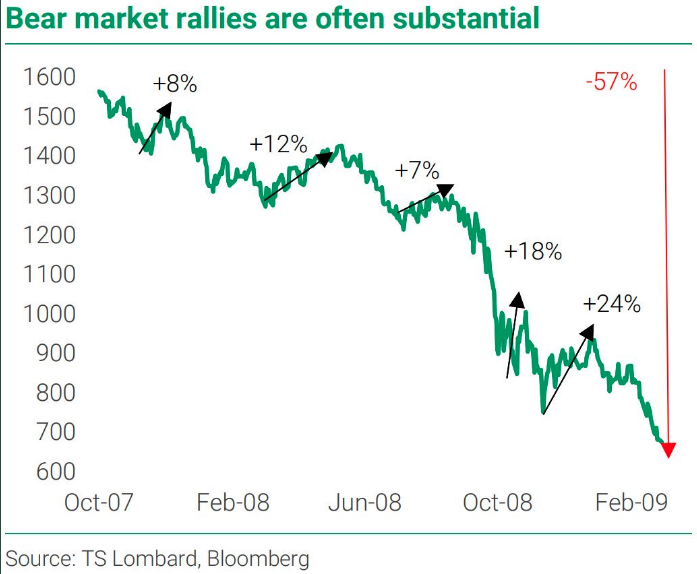
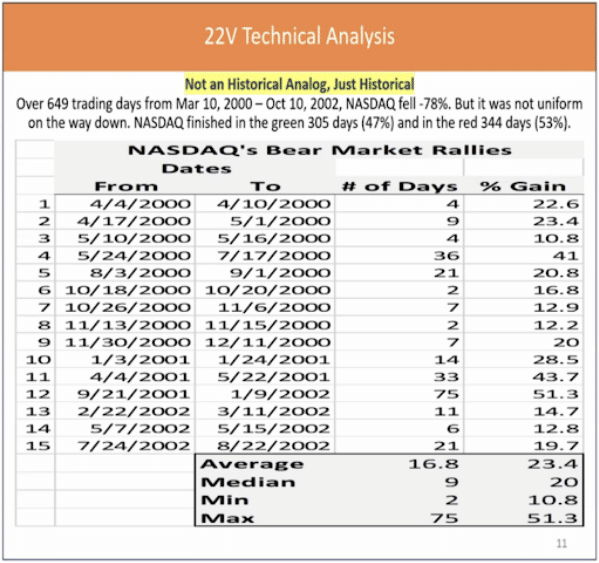
During corrections/bear markets, countertrend rallies can prove fiercely profitable, reducing or mitigating drawdowns in one’s portfolio from such corrective phases. This is just one reason active portfolio managers should remain engaged, holding a game plan and cash that recognizes a certain degree of cash SHOULD benefit from interim swing trades within the context of oversold conditions that warrant and usually produce countertrend bounces/rallies.
Research Report Excerpt #2
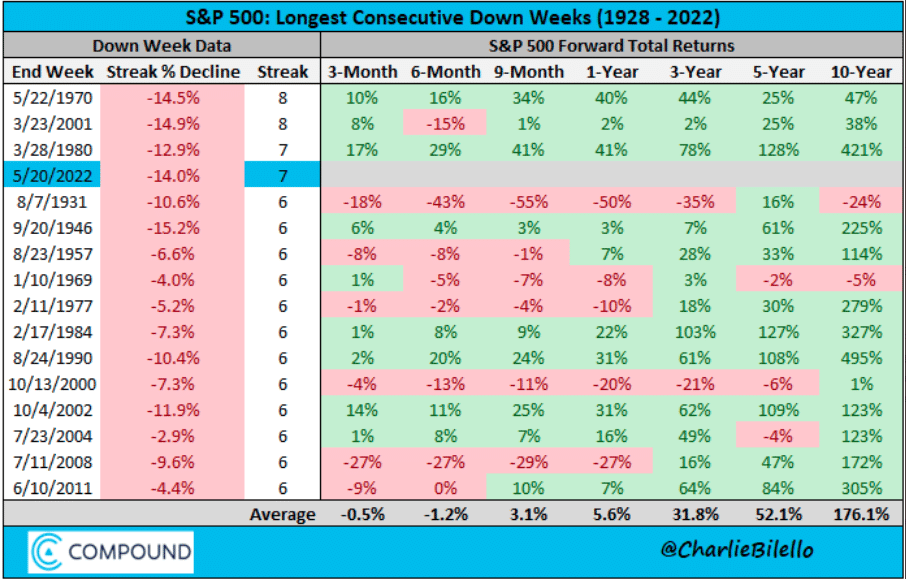
Seven consecutive down weeks is a lot for the S&P 500 and the Nasdaq. Only 3 other instances ever for the S&P 500. For the Nasdaq, it is the first time since 1978 and there are only two other 7-week losing streaks, 3/23/2001 and 4/4/1980. There was never an 8-week losing streak for the Nasdaq since inception. Silver lining… or “there is a first time for everything?” The answer to this question may reside within the belief of investors regarding recession probabilities.
Interestingly, the amount lost over the 7 weeks, for the S&P 500, was very similar each time (top 4 rows in chart above). There is seemingly an error in the calculation of the 7-week decline, as it truly tallies a -15.7% drawdown (chart Charlie Bilello). So yea, this is the worst ever. If the 7-week decline isn’t enough, it has the potential to also be the worst start to a calendar year for the S&P 500 through May’s close. The previous worst years were 1970: -16.85% and 1962: -16.66 percent. The index is currently down -19.31% as of Friday’s close, and with 7 trading days to go in the month.
Research Report Excerpt #3
The NAAIM Exposure Index provides insight into the actual adjustments active risk managers have made to client accounts over the past two weeks. The trend in the NAAIM Index chart below depicts the consistent selling since the peak in April’s exposure.
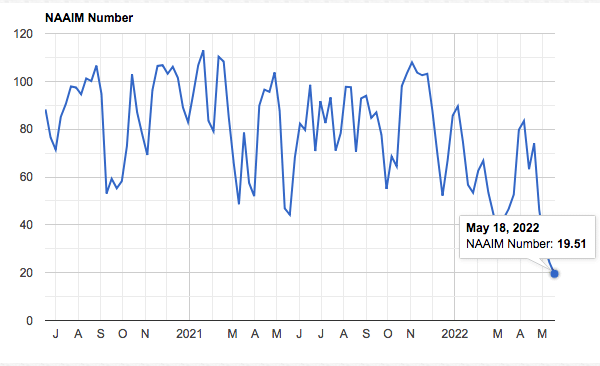
At 19.51, the NAAIM Index is at the lowest level since March 2020, when the bear market bottomed. Could the selling or deleveraging continue? It could, but bottom picking isn’t a task that offers a high probability achievement. What all the supplemental research offers is that, at the very least, the bottom is far closer today than in Mach or even April.
Research Report Excerpt #4
As always, we desire to know the forward potential returns and positivity rate for such bearish breadth in the Nasdaq 100. The following study comes from Jonathan Harrier, shared this past Friday:
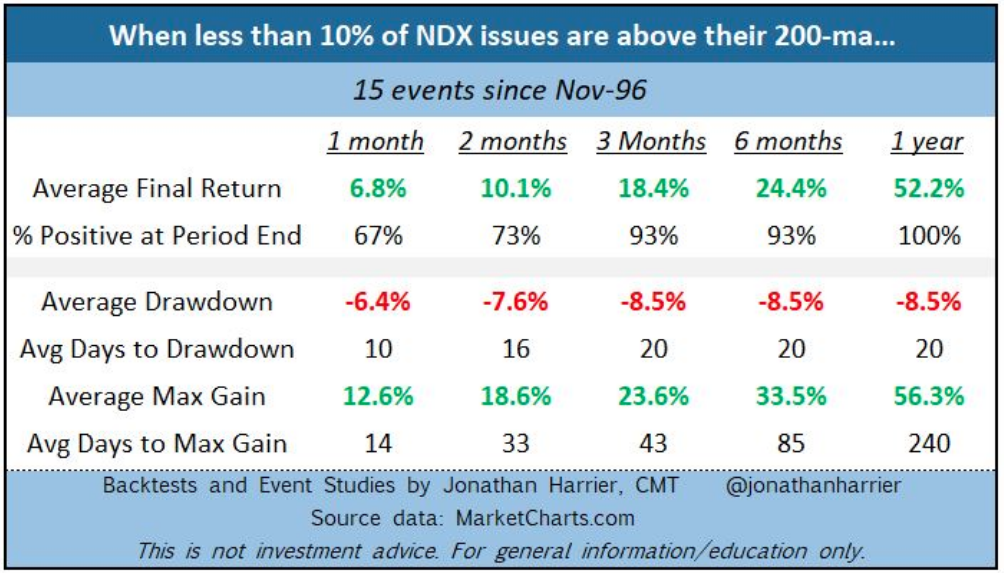
Since 1996, or the Dotcom era, the percentage of Nasdaq 100 stocks trading above their 200-DMA was as 10% just 15 times. Of the 15 occurrences, all but once was the Nasdaq 100 higher 3 and 6 months later. The average return over the following 3 and 6 months was very favorable. This speaks to buying the dip near-term, mitigating drawdowns year-to-date, and compounding returns over time. Every single occurrence found the Nasdaq 100 higher than the signal date 12 months later. What you should also notice is that average drawdowns are smaller (not non-existent) than average returns over any time period within the study.
Research Report Excerpt #5
The New York Fed index of supply chain pressures shows order backlogs and shipping delays are down from the December peak. This is in keeping with manufacturers trimming their delivery times. The number of ships queued in waters off the Port of Los Angeles has also fallen by 50% since November 2021.

And then there is supporting evidence, based on Census Bureau retail sales that informs of the consumer spending habits shifting back to the former trend. Through the post-Covid period, many consumers remained reluctant to visit and patron service industry establishments surrounding hospitality, leisure, travel, sporting, and dining industries. Once it became more clear that mass vaccinations levels had been achieved along with the passing of the Omicron-wave, U.S. consumers have become increasingly mobile and spending more on services.
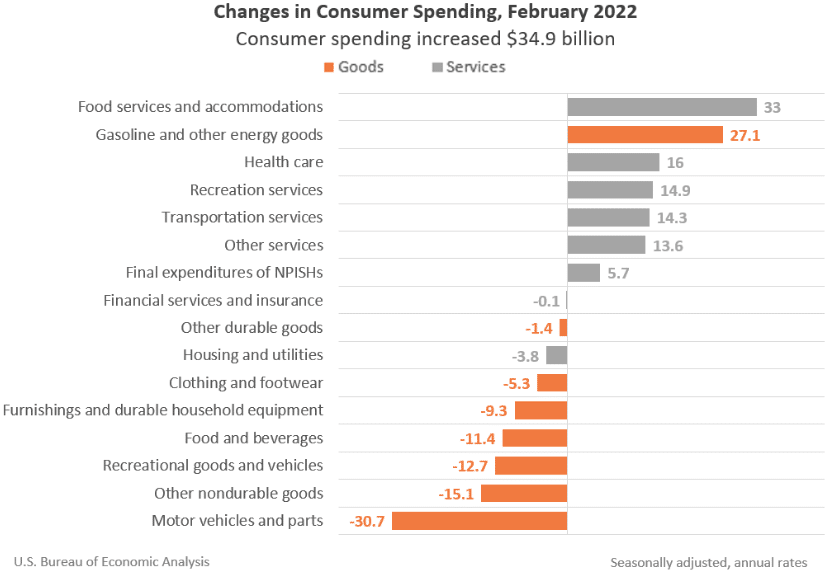
As we can see in the recent data from the U.S. Bureau of Economic Analysis, most of the increases in consumer spending are indeed taking place in service industries and/or categories of spend.
Research Report Excerpt #6
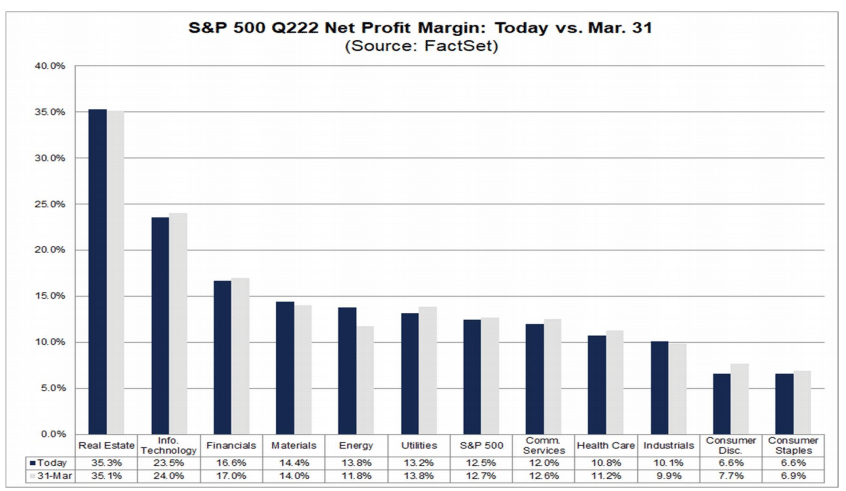
Walmart and Target both discussed and outlined the shortcomings in their gross profit margin performance as it related to their Q1 margin contractions. For the most part, consumer mix-shift was a minimal impact as foot traffic and total sales grew nicely on a YoY basis. Most of the margin contraction was a result of backend or logistics and transportation costs. Given the high number of S&P 500 companies that have cited “supply chain” on Q1 earnings calls, we ask if net profit margin expectations for the S&P 500 for Q2 2022 and CY 2022 have been revised? The current net profit margin estimate of 12.5% for Q2 2022 is below the estimate of 12.7% on March 31, while the current net profit margin estimate of 12.6% for CY 2022 is also below estimate of 12.7% on March 31.
Research Report Excerpt #7

If it feels like this time is different, it’s not. The only time its different is every time, therefore different doesn’t have any contextual purpose. The price action is generally the same, as human behavior rarely changes. Low and behold, it’s a midterm election year and we naturally find market angst once again. History is repeating the price action of the past, regardless of the circumstances highlighted. It’s the circumstances that are always different. The above bar chart identifies the market corrections during midterm election (in blue) years since 1962.
Research Report Excerpt #8
As noted previously, we don’t know if an “official” bear market will be found for the S&P 500, but we do know what to expect if one occurs. The data below almost begs of such a bear market, even if it proves fleeting like 1987 and 2020. These bear markets produced, on average, a nearly 40% return from the lows 12-months later.
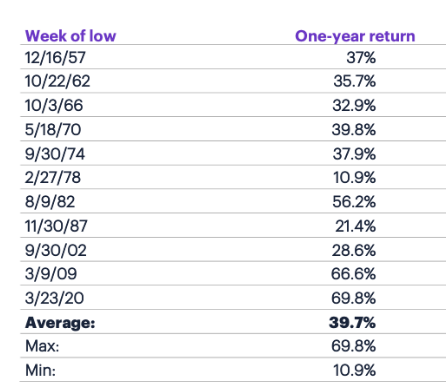
Of note: The table does not state or define new all-time highs for the S&P 500 1-year later, it simply depicts the average return for capital invested in the index ETF, at the very least approximating the ultimate bear market low.
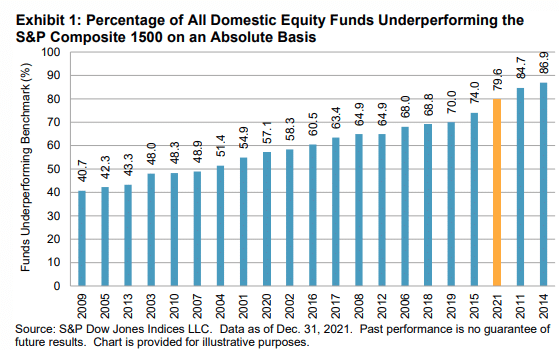
Research Report Excerpt #9
Stock picking is hard. Close to 90% of professional money managers underperform index funds over 10 and 20 year periods because they are constantly attempting to increase their stock picking prowess, to no avail.