
Welcome to this week’s State of the Markets. Please click the following link to review the SOTM video . Our emphasis in this week’s SOTM video concerns the geopolitical issues around trade, underlying economic data that gathers less attention due to the flare-ups on the trade front and certain of the details coming out of the Jackson Hole summit. Global equities and bond yields tumbled on Friday, as exogenous tweets continue to disrupt markets.
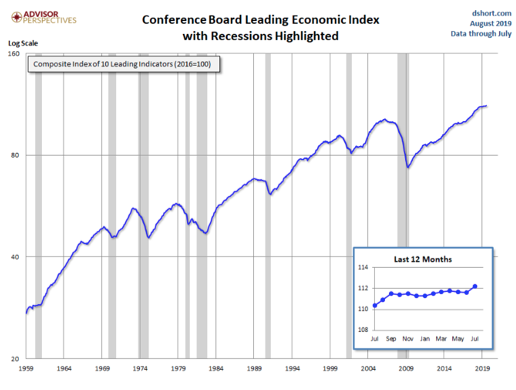
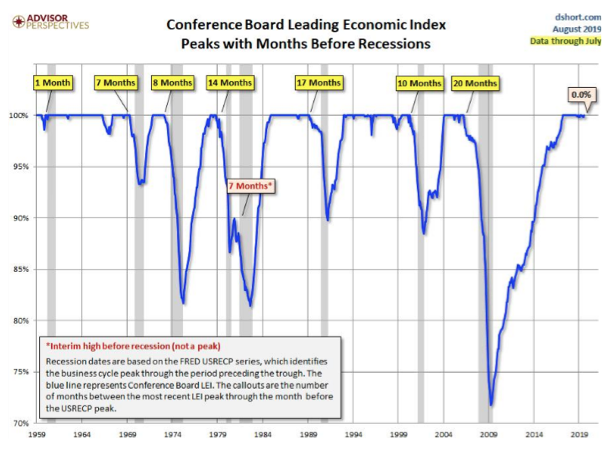
- LEI is at a new cycle high in July. In the past 50 years it has peaked a median of 10 months before the next recession and 3 months before S&P 500.
- Jeff Gundlach: “There is a real risk of rising rates,” he said, which would slow economic growth and contribute to a more destructive recession. If a recession comes this year, the yield curve will steepen, he said. Indeed, that steepening has already started.
- “But there has never been a recession in the post-war period without the LEIs first going negative.”
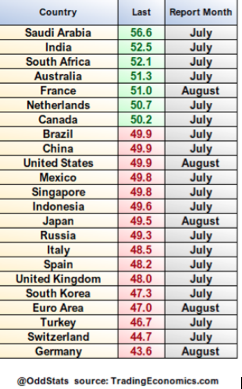
- Markit manufacturing purchasing managers index fell to 49.9 in August. Any reading below 50 reflects a slowdown in economic activity.
- Please review the latest report from J.P. Morgan’s quant team, led by Marko Kolanovich.
Market and Volatility Commentary: Despite fundamental risks, recent equity and bond moves were mostly technically-driven. Tue Aug 20 2019
Last week brought another surge in market volatility driven by Trump’s trade war and the related sharp drop in bond yields. Many investors asked to what extent the magnitude of moves in bond yields and equities reflect fundamentals or technical drivers. In other words, how much of the move can be attributed to increased recession risk vs. technical flows in an environment of poor liquidity? Our colleagues in interest rate research estimated that more than half of the recent move in interest rates and inversion of the yield curve was caused by technical drivers – i.e. convexity hedging of mortgages, bank portfolios, and variable annuities in poor liquidity conditions – and less than half of the move can be explained by fundamentals such as the growth, inflation and monetary policy outlook. This is an important data point for equity investors, as moves in rates (e.g. yield curve inversion) significantly impact investment sentiment. By looking at various systematic flows in equity markets, we find similar results – i.e. that more than half of equity moves were driven by systematic rather than fundamental trading.
If we look at the systematic equity flows during (and as a result of) the Wednesday 8/14 selloff, we estimate ~$75bn of programmatic selling, with ~50% of it coming from index option delta and gamma hedging, ~20% from trend-following strategies, ~15% from volatility targeting strategies and the remaining ~15% from other products (e.g. levered/inverse ETFs, etc.). While these outflows would have represented ~25% of futures daily volume, in an environment of low liquidity they can be a dominant driver of price action. In particular, during the month of August, market depth of S&P 500 futures dropped to near December (all-time) lows. Within one index point on the S&P 500 (from mid-market), on average there were just ~900 e-mini futures contracts bid/offered – i.e. a ~$130M sell order could have moved the market by ~1 index point. We estimate that S&P 500 index option hedging flows were likely the single most important driver of price action during both the selloffs and rallies last week.
What is the current investor positioning, and what type of flows can we expect going forward? Hedge fund equity beta (as measured by the HFRX Global index) is currently near all-time lows, in its ~4th %ile. Trend following strategies and volatility targeting strategies also have low exposure, both in their respective 27th percentiles. All else being equal, such low positioning is positive for equity performance going forward. Low positioning also reflects negative market sentiment, with the past two readings of the AAII Bull-Bear spread at -22% and -27%, not far from the lows seen in Dec’18 (-28%) and Feb’16 (-29%) that both marked market bottoms.
Equity flows will to a large extent be driven by developments around trade, and hence the market will likely continue to be dominated by market disruptive tweets and announcements related to the trade war. Those are likely impossible for anyone outside of policymakers’ inner circle to forecast. On the positive side, we expect some stabilization in market volatility as dealers’ gamma positioning is now close to neutral (from a sizable short position last week), and this may reduce volatility and marginally improve liquidity. We also expect some marginal stabilization and perhaps reversal of volatility targeting outflows. Given the large outperformance of bonds over equities this month, equity inflows are likely to occur next week. In our last note (here) we discussed that fixed-weight trigger rebalances may have cushioned the market selloff even before calendar month-end (given the large divergence between stock and bond prices), but typically portfolio rebalances happen at month- or quarter-end (e.g. see here). Even after the stock market recovered some of the losses from last week, we could still see equity inflows and outperformance into month-end. Bonds delivered their strongest performance in over 7 years and are up ~5% MTD, and equities are down ~2% MTD. As things stand, this performance divergence leaves fixed weight portfolios ~2% underweight equities and suggests they are likely to do a sizeable rotation out of bonds and into equities into month-end. Our model suggests that these flows could drive a further ~1.5%-2% outperformance for equities next week. Please note that this figure could change (i.e. it’s a ‘moving target’) based on this week’s performance of stocks and bonds.


