

Research Report Excerpt #1
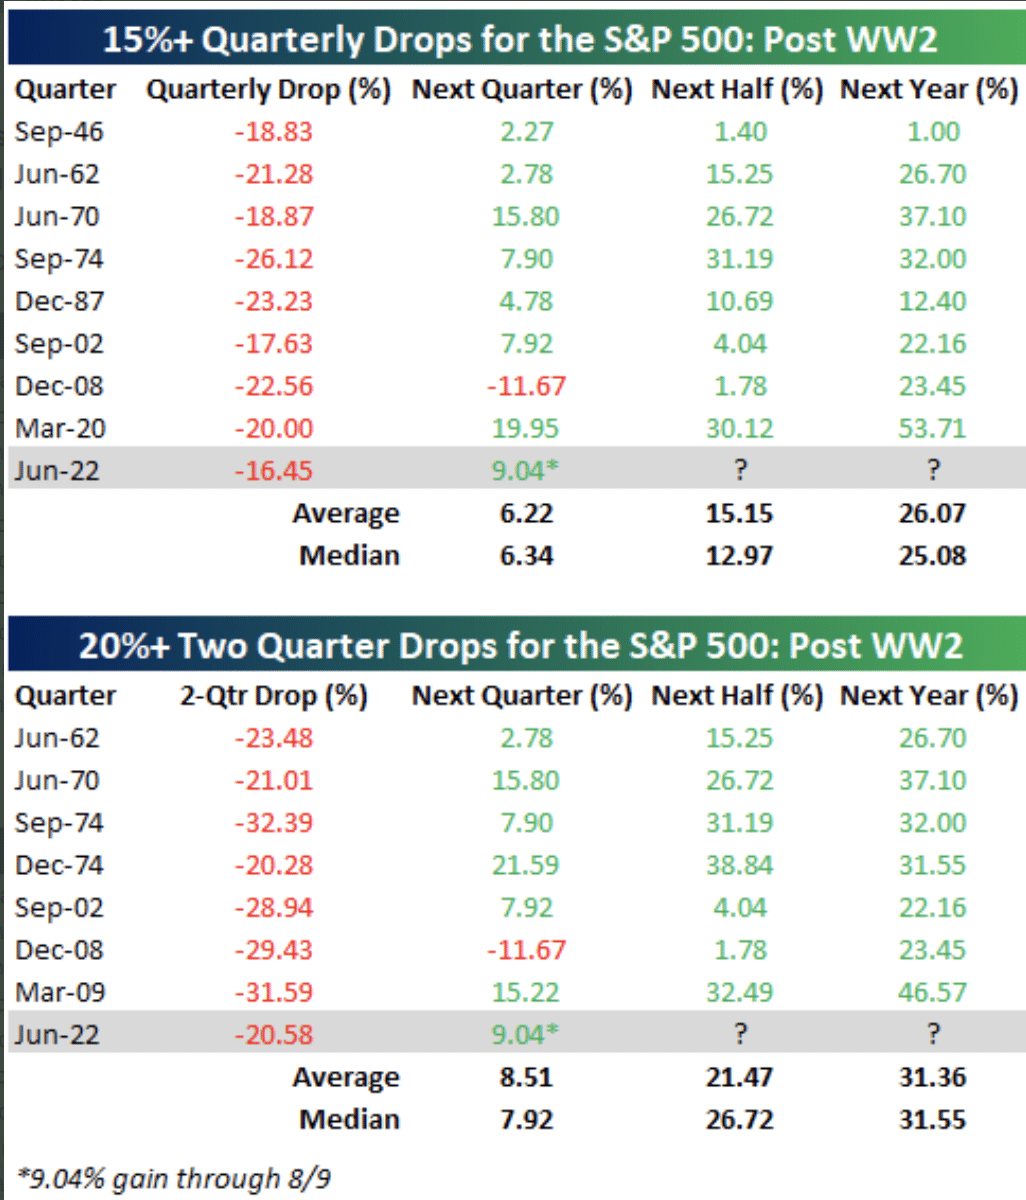
At the end of the second quarter, the S&P 500’s price was 3,785. There’s still another month left to go in the quarter that currently followed that 15%+ drop. We’ll have another 23 trading days to see if the markets can lean into the greater probability identified in the data sets above, and remain higher than 3,785, where it closed on June 30, 2022.
Research Report Excerpt #2
It could be argued that regional Fed Presidents had indeed been pushing back on the idea that there was going to be some form of a dovish pivot to come in 2023, but that push back became more real by the Chairman himself on Friday, and during his Jackson Hole speech. The following passage was extrapolated from Chairman Powell’s speech:
“Restoring price stability will take some time and requires using our tools forcefully to bring demand and supply into better balance. Reducing inflation is likely to require a sustained period of below-trend growth. Moreover, there will very likely be some softening of labor market conditions. While higher interest rates, slower growth, and softer labor market conditions will bring down inflation, they will also bring some pain to households and businesses. These are the unfortunate costs of reducing inflation. But a failure to restore price stability would mean far greater pain.
July’s increase in the target range was the second 75 basis point increase in as many meetings, and I said then that another unusually large increase could be appropriate at our next meeting. We are now about halfway through the intermeeting period. Our decision at the September meeting will depend on the totality of the incoming data and the evolving outlook. At some point, as the stance of monetary policy tightens further, it likely will become appropriate to slow the pace of increases.
Restoring price stability will likely require maintaining a restrictive policy stance for some time. The historical record cautions strongly against prematurely loosening policy. Committee participants’ most recent individual projections from the June SEP showed the median federal funds rate running slightly below 4 percent through the end of 2023. Participants will update their projections at the September meeting.”
The positioning of the verbiage may have been different and more emphatic when compared to the July FOMC meeting and press conference, but the words are very much the same as offered at the July FOMC press conference.
Research Report Excerpt #3
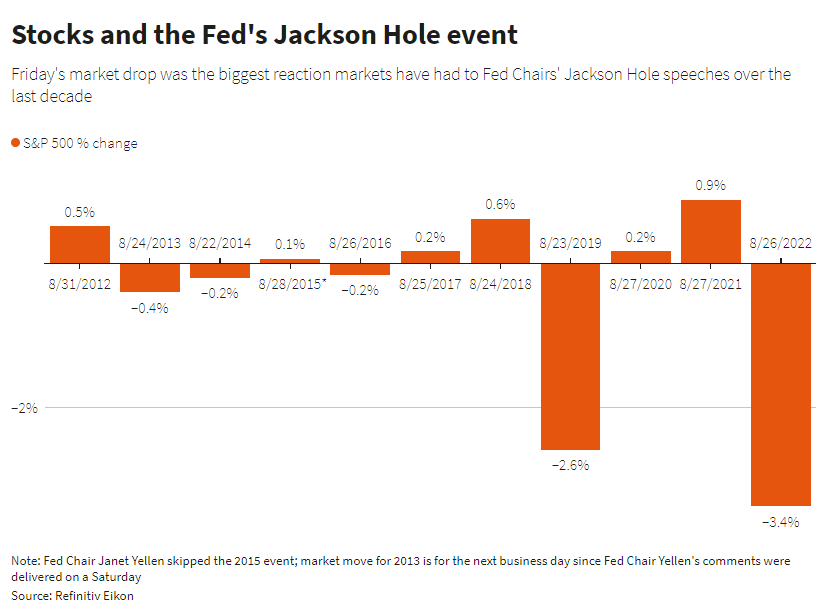
Going into Friday, the options market wasn’t really primed for a big move for stocks. Certainly not for the largest market reaction stocks have had to a Fed Chairman’s Jackson Hole speeches over the last decade, but that is exactly what investors and traders achieved.
Research Report Excerpt #4
With the data above, now let’s look at how markets broke down this week, and with much of the breakdown occurring on Friday. We’ll stick with the S&P 500, as it will prove a more useful guide for most investors/traders.

It proved a relentless sell-off Friday. During the week, the S&P 500 attempted to maintain above its 20-DMA, but come Friday it quickly fell through and kept falling. As shown in the chart above, by the end of the day the benchmark index also fell through the 100-DMA at 4,075 and before finishing down more than 3% on the day. Last, but certainly not least, the index also finished the day below its 38.2 Fibonacci level of 4,097, if we use the top/down approach from the January high to the June low.
In the chart below we’ll look at the Fibonacci levels from the bottom/up approach, using the June low to the most recent rall high.
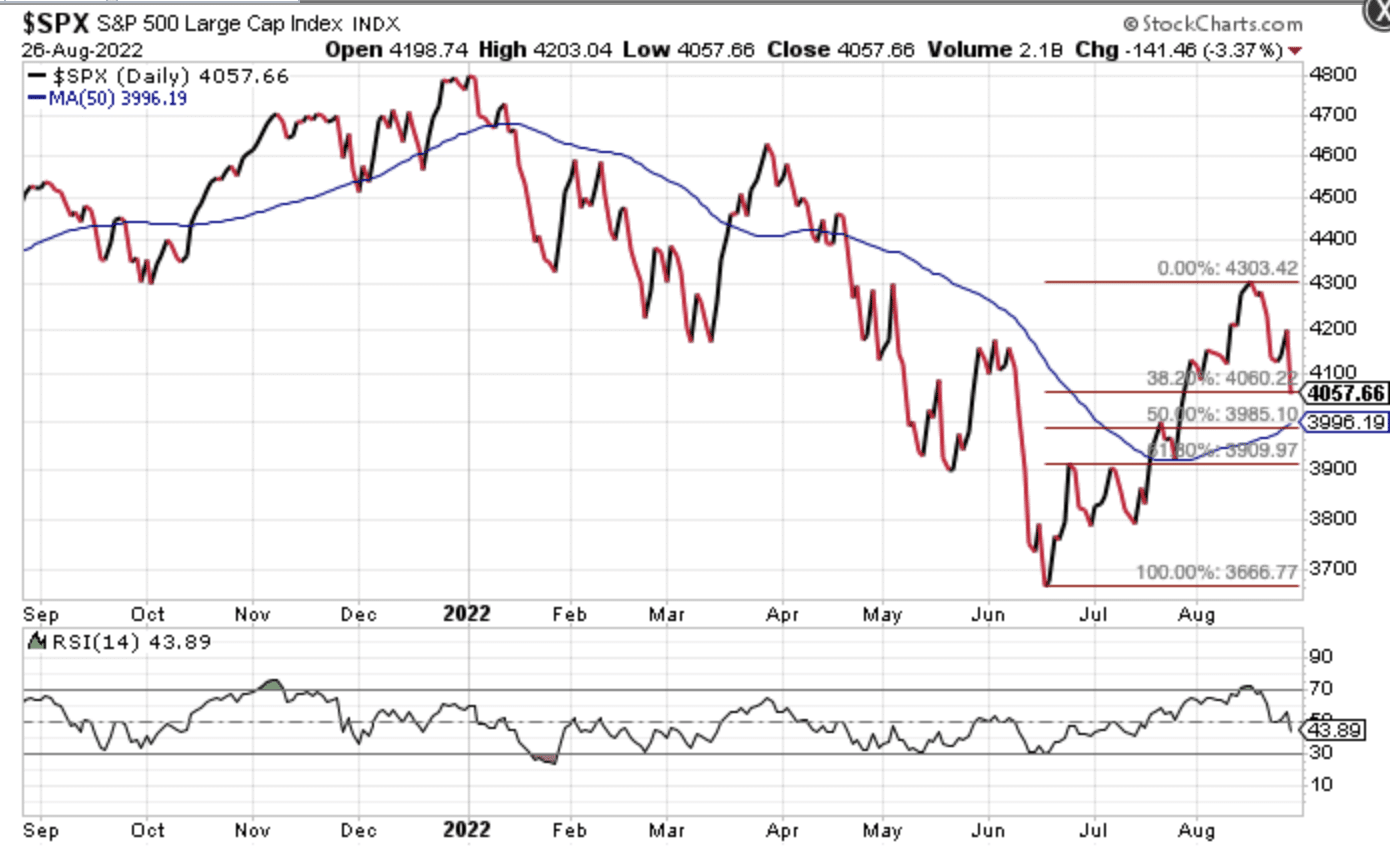
Given that the market is mostly focused on the recent rally off the June lows, if we look at the Fibonacii levels from this vantage point, the S&P 500 violated the 38.2% retracement level of 4,060. The next potential level of support comes in at the 50-DMA of 3,996 or the 50% Fibonacci retracement level of 3,985.  Momentum and relative strength indicators suggest more downside should be anticipated.
Research Report Excerpt #5
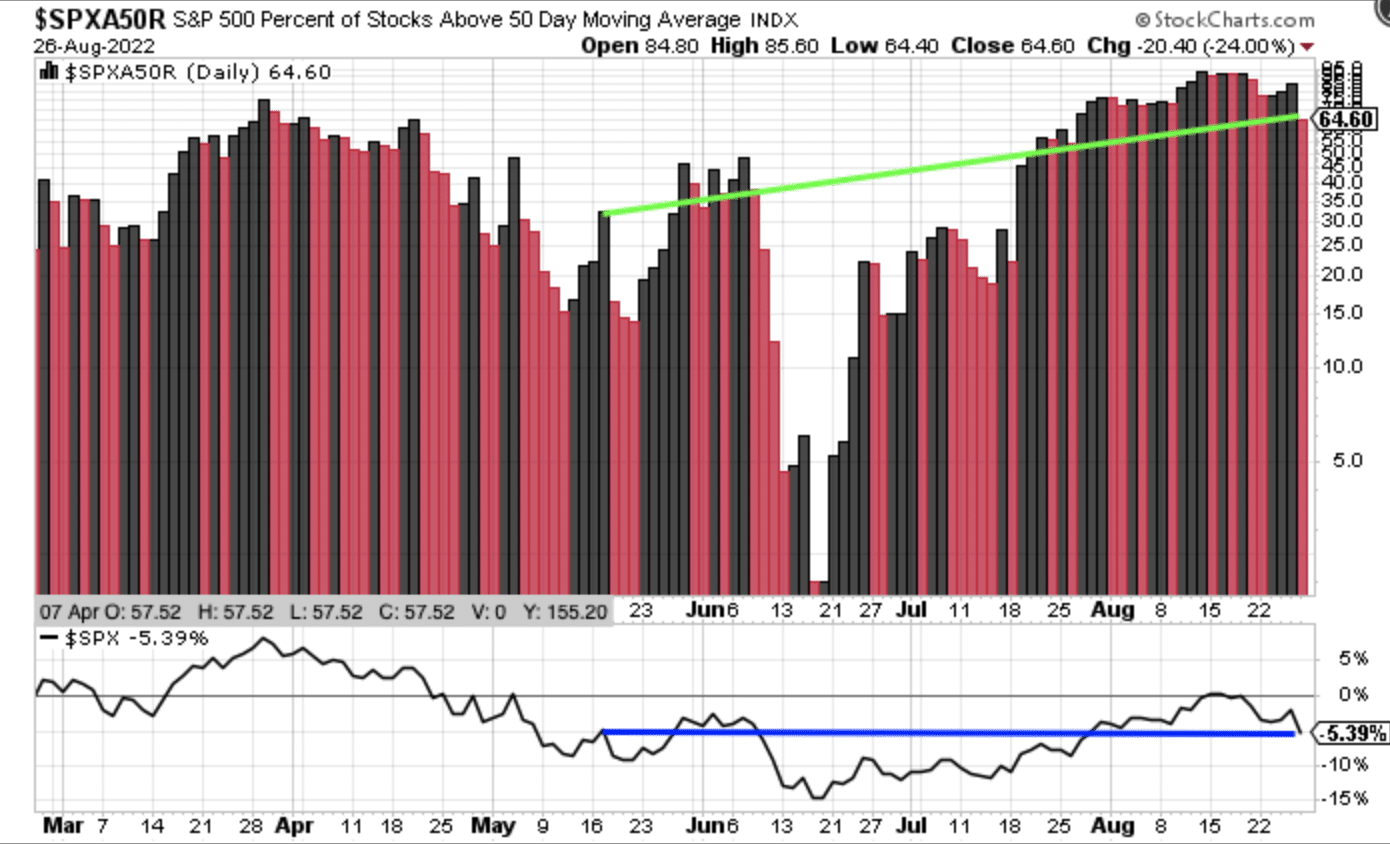
If there is one piece of technical analysis and market breadth that also suggests the market has more participation and support today than when the market was at the same level back in May and/or June of this year, it’s the percent of stocks above their 50-DMA. Essentially, there will need to be that MUCH MORE selling activity just for the market to retest the lows from June, given most stocks were trading below their 50-DMA then and are trading above their 50-DMA today. It begs of investors/traders to not just be sellers, but increase their selling activity above and beyond that fromt he May and June periods. Do you believe that this is likely?
Research Report Excerpt #6
Historically, this metric has helped to distinguish between a recession and expansion cycle. In the chart below we can see that GDI remains above the pre-pandemic level trend and continues to expand
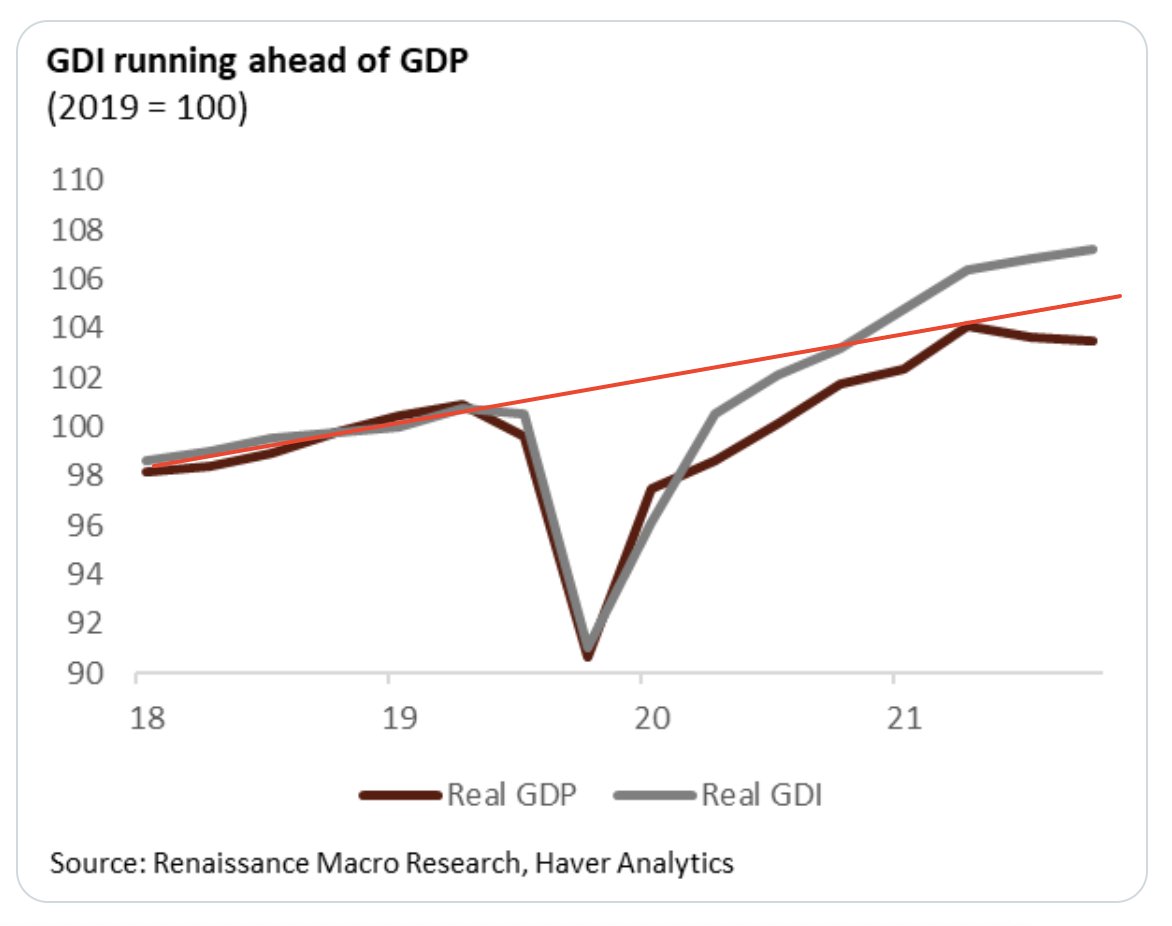
In Q2, real Gross Domestic Income rose 1.4% SAAR following growth of 1.8% in Q1. That’s a notable step down from the 5.8% growth in 2021. Still, in recent years, GDI has been telling a somewhat better story about growth than GDP, climbing about 4 percentage points more since 2019.
With real incomes rising, again, it is incredibly unlikely that the NBER will label the first half of 2022 a recession. Gross Domestic Income is an economic input the NBER uses to distinguish and label recessionary conditions.
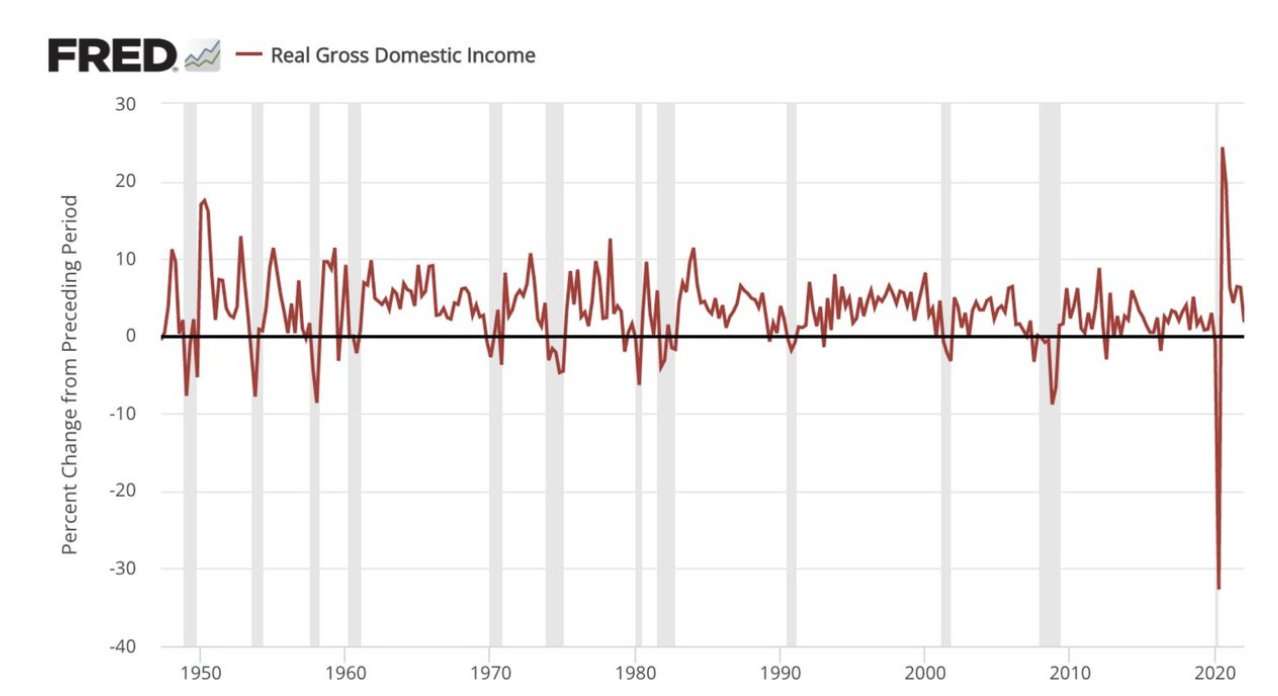
As shown in the GDI chart above, when GDI is above zero (black horizontal line) it has indicated an expansion cycle and when the metric was below zero it has indicated a recession (grey shaded perpindicular bars) was afoot. At present, one might accurately suggest that the Fed would like to see GDI weaken in the back half of 2022, and we think this is a likely outcome.
Research Report Excerpt #7
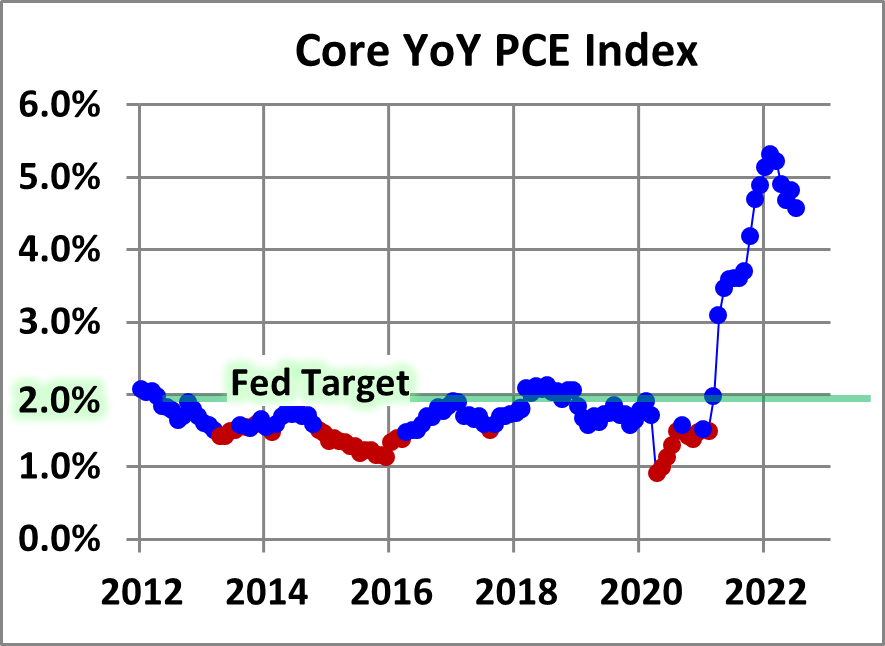
As we can determine from the last couple monthly declines in Core PCE, inflation has begun a process of reverting to a disinflationary regime. Having said that, the absolute level of inflation remains elevated, and not consistent with the Fed’s target rate of 2 percent. As such, market participants should anticipate further rate hikes from the Fed in upcoming FOMC meetings for September and November, at the very least.
Research Report Excerpt #8
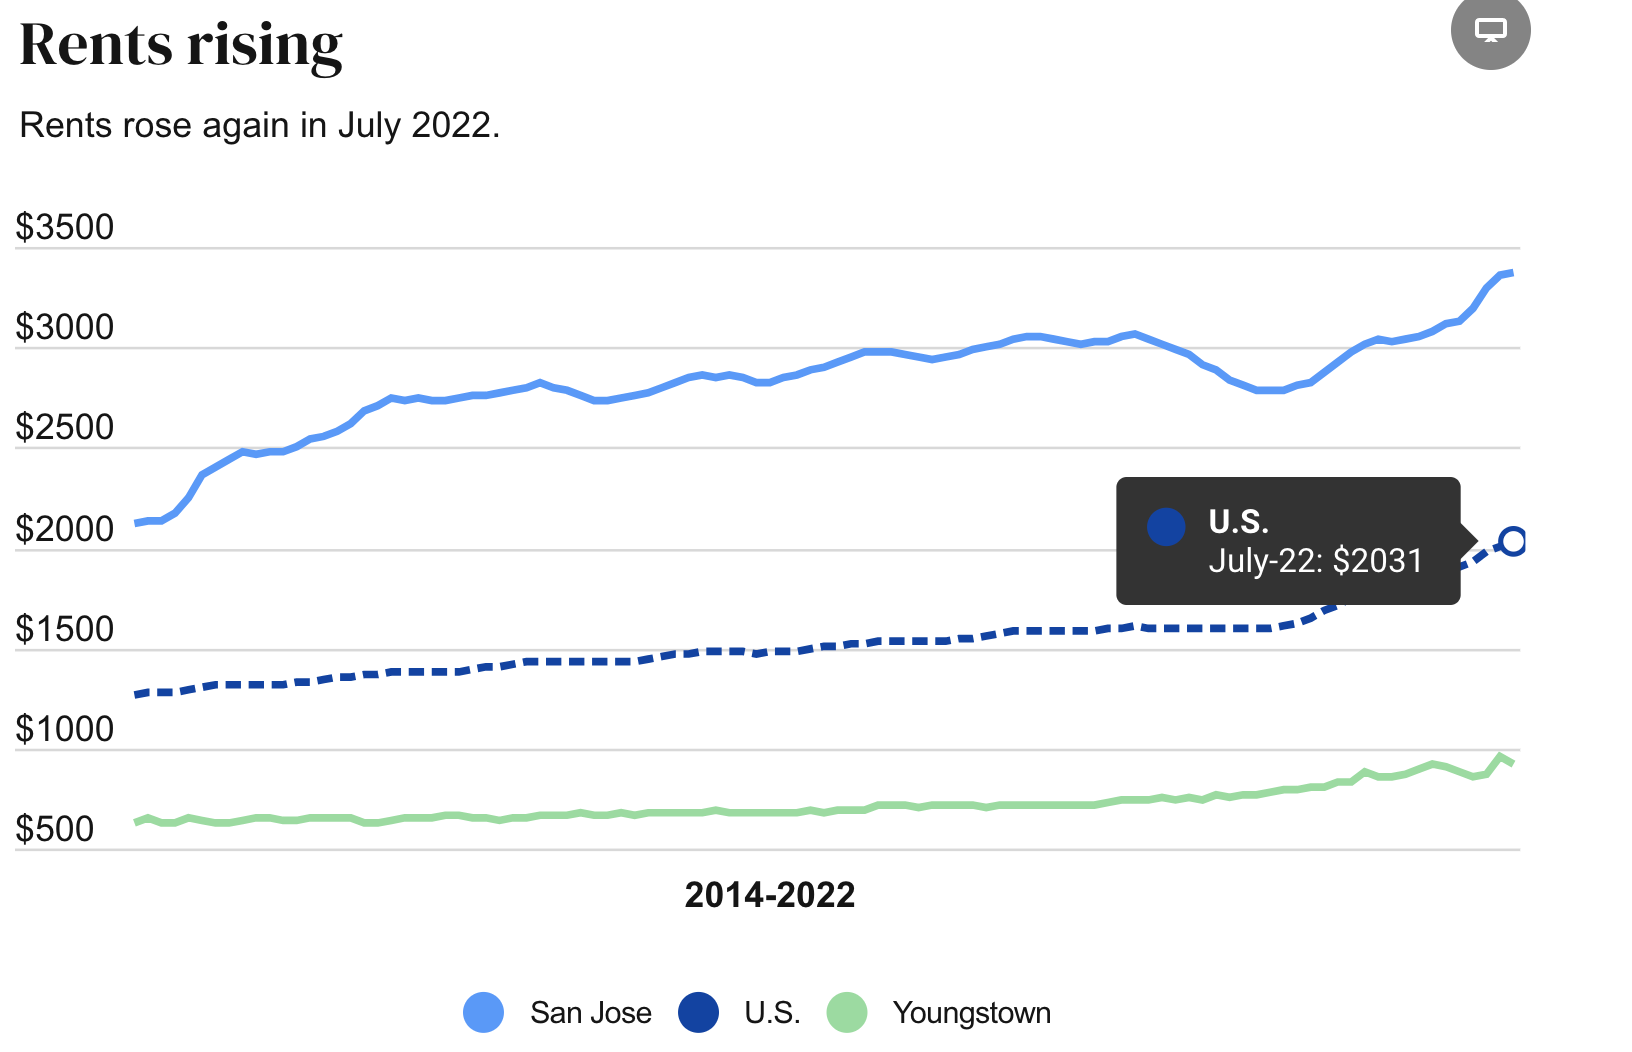
While the growth in rents is still growth, the average in July only rose modestly from June, according to Zillow’s Observed Rent Index (ZORI). Last month, rents rose to an average of $2,031 nationally from $2,007 in June. Given the rate of change, this would actually see the Owner’s Equivelent Rent fall in the CPI reading, not rise. Remember that CPI measures rate of change, not up or down.
Research Report Excerpt #9
While the aforementioned is absolutely true of investor performance over time, investors and traders are likely focused on one thing:
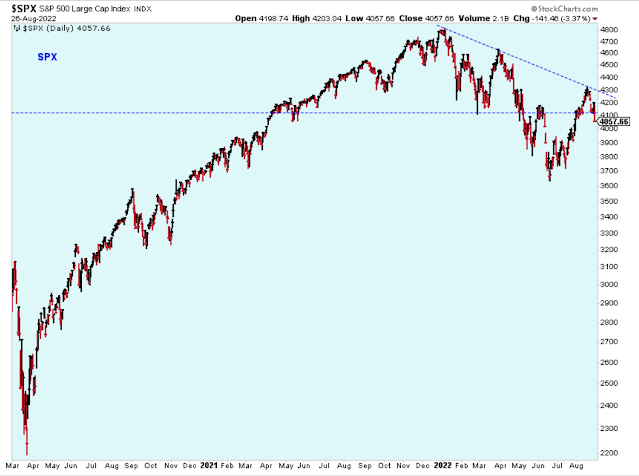
This is the S&P 500 chart since the start of the COVID-19 pandemic in early 2020. What a rally. Now we must watch to see if the S&P 500 challenges the June lows or has some sort of retest. If it does reach down that far, we will watch to see if it can hold above that level. Right now, most investors will likely benefit from any back and filling of price action, given a recession is still an unlikely occurrence by year’s end and earnings are still growing.


