
Welcome to another trading week!! In appreciation of all of our Basic Membership level participants and daily readers of finomgroup.com content, we offer the following excerpts from our Weekly Research Report. Our weekly Report is extremely detailed and has proven to help guide investors and traders during all types of market conditions with thoughtful insights and analysis, graphs, studies, and historical data/analogues. We encourage our readers to upgrade to our Contributor Membership level ($7.99 monthly, cancel any time) to receive our Weekly Research Report and State of the Market Videos and take advantage of this ongoing promotional event today! Have a great trading week, be in touch, and take a look at some of the materials in this weekend’s published Research Report!
Research Report Excerpts #1
It’s easy to see why this rally is different, however, based on where it stands versus other “bear market rallies”: (LPL Financial)

The stock market was on sale back in March. Human behavior can be funny sometimes. Think about this way: Macy’s has a 50% storewide sale! Now ask yourself if this would be something you’d fear or relish for opportunity to grab household items and apparel at discount prices. Clearly, we’d probably head to our local Macy’s store and buy those goods. How come it doesn’t often work the same way in the stock market? Aside from a few short stents of pension fund rebalancing at the end of Q1 and even briefer stents of net inflows to the market, much of the rally has been a short-covering rally peppered with low participation and mixed sentiment. People seem to always run, screaming from a market downturn rather than buying at discount rates. It has only been over the last 30 days or so that we’ve seen buyers of consequence.
Research Report Excerpts #2
The NAAIM Exposure Index has only broken above 100 for the 8th time in its short history. The top panel chart below is of the S&P 500 and the bottom panel is of the NAAIM.

As we can see, given the 7 previous times NAAIM had been 100 or greater, 2 times the market advanced near-term and 5 times the market consolidated near-term. The more capital exposure to the market, once something proves to drive fearfulness, the greater the likelihood that some of this exposure will be curtailed.
Research Report Excerpts #3
As it pertains to the Consumer and Producer Price Index readings coming in hotter than forecast for the reported period this past week, we tend to give these little attention, as the economy has yet to fully reopen and the readings are artificially inflated due to the pandemic. Long-term, we understand and have recognized limited inflation potential, on the whole, in the information technology era where consumers have price transparency tools at their fingertips, “like never before”.
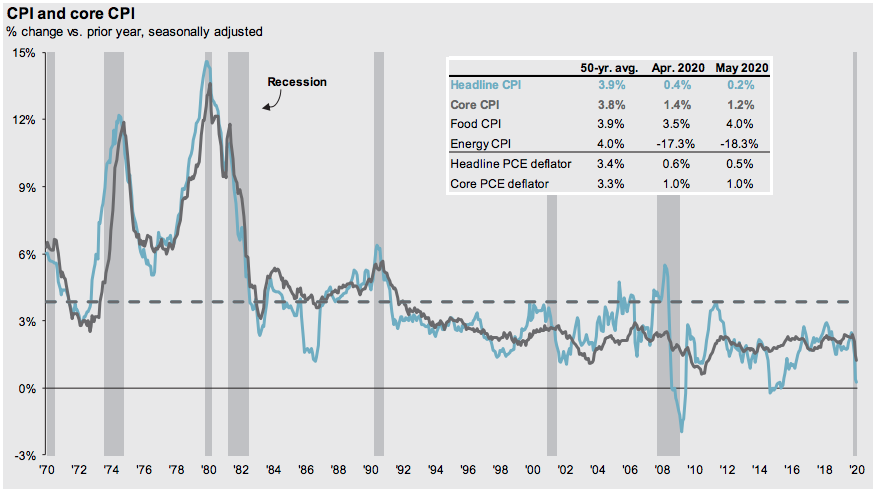
The bottom line is that the information technology era has proven to lower overall core CPI and has been doing so since the 1990s. Moreover, as identified in the chart above, the U.S. typically does see a bump in CPI coming out of a recessionary period.
Research Report Excerpts #4
If we look at some of the categories within the July retail sales report, the trends are clear. It helps to perform this exercise as an investor to understand where and how consumers are spending their paychecks.
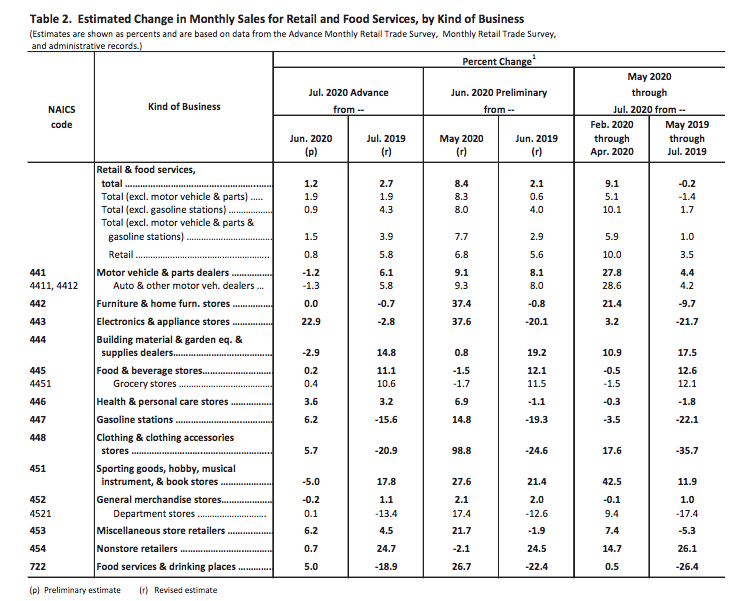
While the retail sector and individual stocks have performed rather well over the last several weeks, the categorical sales suggest there is real pain in certain categories that may never reverse. Probably the most glaring pain continues to come from specialty apparel/clothing and department store segments. As noted in the table above, department stores had some of the smallest contribution to month-over-month retail sales and was one of the biggest drags (-13.4%) during the month of July on a YoY basis. Nonetheless, stocks like Macy’s (M), Dillards’s (DDS) and Kohl’s (KSS) have all risen sharply in recent weeks. This goes to show how a rising tide (S&P 500) can intermittently lift all boats (individual stocks).
The other glaring category that continues to show outsized growth is consistently coming from Nonstore retailers (e-commerce). This segment grew off of a very large base in June at .7% for the month of July. More eye-opening was the YoY gain of 24.7% for the category, the strongest of all categories within the report. Nonstore retailing has been a huge boon and accelerant of categorical sales through the COVID crisis. More and more people were forced to transact commerce online than ever before during the pandemic shutdown. They have now likely realized it is convenient, price effective and less cumbersome than formerly assumed.
The trend away from traditional brick and mortar retail sales has been in place for more than 8 years now, and based on a variety of factors that include consumer demographics, I think the trend will prove irreversible. The issues and weakness in specialty and department store retailing has been a troubling sign of further weakness to come, as retailers like Toys R Us, HHgregg, The Sports Authority, Sears, Dress Barn, Forever 21, Payless Shoe Source, J.Crew, J.C Penney and more file for bankruptcy and liquidate.
Research Report Excerpts #5
Refinitiv offers their latest tracking results as follows:
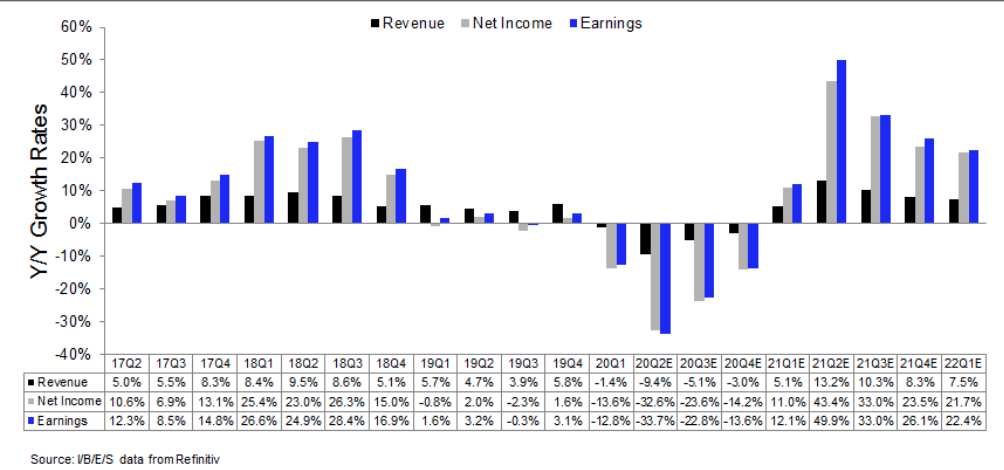
Aggregate Estimates and Revisions
- 20Q2 earnings are expected to be -33.6% from 19Q2. Excluding the energy sector, the earnings growth estimate is -27.2%.
- Of the 457 companies in the S&P 500 that have reported earnings to date for 20Q2, 81.4% have reported earnings above analyst expectations. This compares to a long-term average of 65% and prior four quarter average of 71%.
- 20Q2 revenue is expected to be -9.4% from 19Q2. Excluding the energy sector, the growth estimate is -4.8%.
- During the week of August 17, 18 S&P 500 companies are expected to report quarterly earnings.
Research Report Excerpts #6
Relative to the peak on February 19th, nominal 10-year yields are 90 bp lower (from 1.6% to 0.7%). With breakeven inflation unchanged (at 1.7%), the key interest rate change has been a fall in real yields from -0.1% to -1.0%. While the Fed balance sheet has exploded by 66%, the policy uncertainty index has surged from 131 to 295 alongside lingering concerns about the virus, the election, and US-China trade. On net, the ERP has increased by nearly a full percentage point, to 6.3% from 5.4%. But falling bond yields means the effective cost of equity is unchanged at 7.0% (Ex. 9).
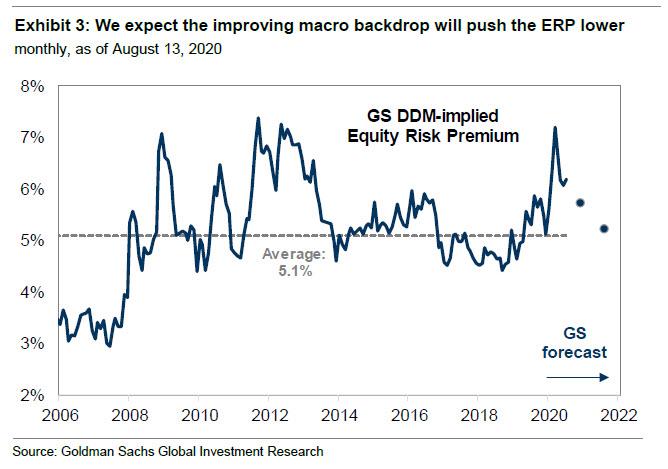
A fall in ERP will be partially offset by a rise in bond yields but the combination will ultimately boost the S&P 500 index to 3600 by year-end (+7%) and to 3800 (+6%) in 12-months’ time.
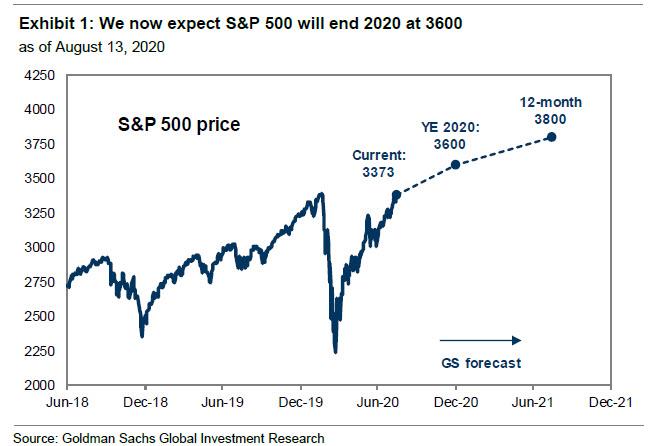
Our revised year-end 2020 price target represents a significant increase from our previous forecast of 3000, driven by valuation. In February 2020, the S&P 500 traded on a FY2 P/E multiple of 17x consensus 2021 EPS. Today, the market trades at 20x consensus 2021 EPS. Our year-end target of 3600 implies a P/E multiple of 21x our 2021 EPS estimate.
Thank you for joining us for another trading week and reviewing our weekly “Must Knows”! To receive and review our weekly, full-scale Research Report each Sunday and our State of the Markets weekly video analysis every Thursday, subscribe to our Contributor Membership level at just $7.99 monthly (Cancel any time)! With these two weekly deliveries, you’ll have all the unbiased and fact-driven market and economic data analysis at your fingertips. Don’t make capital allocation decisions based on headlines that brush the surface of what is and isn’t affecting markets. Let our deep-dive analytics supply you with bottom-up and top-down analytics. You won’t be disappointed. Upgrade today!!


