
Another rollercoaster ride on Wall Street yesterday and after the first of the major FAANG stocks reported earnings. Alphabet (GOOGL) reported earnings and revenues that beat analysts’ expectations by a wide margin, producing a rally on Wall Street. But by mid afternoon, the Nasdaq Composite Index, which hit a record earlier, pulled back from highs to end marginally lower and off 1.11 points to 7,840.77 on the day. The Dow Jones Industrial Average rose 197.65 points, or 0.8%, to finish at 25,241.94, as three of its components reported earnings, ending a three-day losing streak. The S&P 500 index gained 13.42 points, or 0.5%, to close at 2,820.40.
Broadly speaking, the market is responding in kind with earnings results, but trade concerns remain and will be a focus on Wednesday with President Donald Trump meeting with European Union trade officials. Investors and traders might expect to see headlines breaking or tweets being tweeted on the subject matter some time during the trading session today. As such, markets may find a good deal of hedging activity ahead of any such headlines and tweets.
Despite the continued consternation surrounding trade negotiations, headlines and potential economic impact, investors have been buying the corporate earnings picture. But they’ve been doing so with some level of added protections, as can be seen through the volatility marketplace. The VVIX or “volatility of volatility index” identifies that investors are still a bit weary of the recent equity market rally. They have been buying VIX call options, pushing the VVIX to levels above 100. And it’s been a relatively inexpensive source of portfolio protection with the VIX in the 12-13 range over the last couple of weeks. In yesterday’s trade, however, VVIX did dip below 100 ever so slightly. We’ll discuss this a bit further after getting back to the bear-hated FAANG narrative that is playing out in this week’s earnings results. Alphabet has already dealt a blow to the bears, but after the closing bell today, Facebook (FB) will report it’s latest quarterly results. Either the bears will rebound off the proverbial mat, or they will need an “8 count”.
One of the faster-growing segments of Facebook Inc. is Instagram. According to analysts, it is one of the areas the company is looking to in order to sustain its trajectory. Facebook does not break out Instagram revenue, but analysts have estimated it will end up somewhere between $4 billion and $16 billion for 2018.
During the Q2 period, Facebook launched Oculus Go, its $199 virtual reality headset. This will be the first quarter of substantial sales for the consumer product. According to SuperData, the company sold roughly 290,000 headsets during the second quarter, which would equal $57 million of revenue.
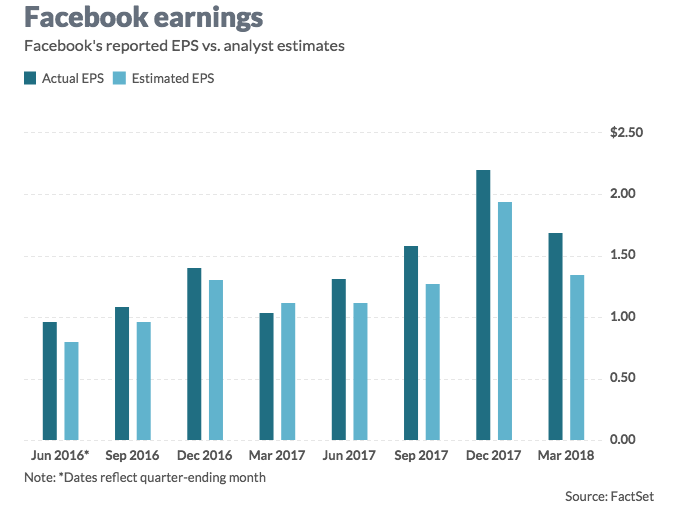
On average, analysts polled by FactSet model Facebook second-quarter earnings of $1.71. Contributors to Estimize, which crowd sources estimates from analysts, fund managers and academics, predict adjusted earnings of $1.81 a share, on average. The chart below identifies earnings results from Facebook since 2016, comparing estimates vs. actual reported earnings results. Facebook has proven to consistently beat analysts’ estimates, however, the share price doesn’t always appreciate in value post reporting such outsized results in the near term.
Analysts estimate Facebook second-quarter sales of $13.34 billion, the bulk of which is mobile ads, according to FactSet. Mobile ads will account for sales of $11.88 billion, desktop ads will be responsible for $1.18 billion and the company’s payments and other fee segment will log $157 million.
Of the 47 analysts that cover Facebook, 42 have the equivalent of a buy rating on the stock, three rate it a hold and two have a sell rating. The average target price is $225.81.
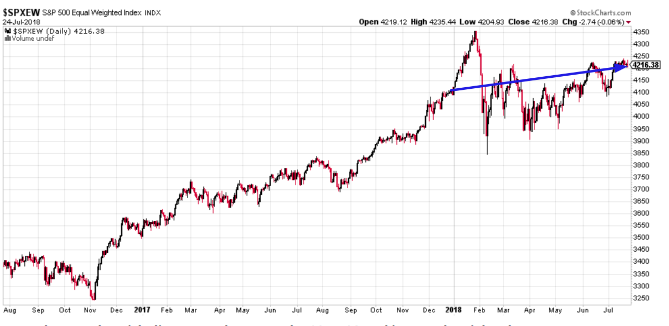
With regards to the FAANG stocks, market pundits and detractors continue to beat the drum that suggests the market is completely driven by the FAANG stocks. This is factually incorrect. FAANG accounts for a big portion of the stock market’s gains merely because FAANG has a big market cap. Big market cap companies ALWAYS account for the bulk of the index’s gains. That’s simply how market cap-weighting works. But the reality is that the S&P 500’s gains are widely dispersed. Below is the chart of the S&P 500’s equal-weighted index. Notice how this equal-weighted index is trending up year-to-date in 2018, just like the S&P 500 itself. This would not be the case if gains were not more widely dispersed.
Earnings season has been, like Q1 2018, better than anticipated thus far. According to data from Charles Schwab, with 22% of the S&P 500 having reported thus far, 91% of companies have topped earnings expectations, while 75% have come in ahead of revenue forecasts. Given the continued outperformance from earnings being reported during the busiest week of the earnings season, Finom Group expects Thomson Reuters and FactSet Q2 2018 S&P earnings forecasts to be revised higher coming out of the week.
While we maintain one eye and ear on earnings at Finom Group we also maintain an eye and ear on the Fed (FOMC). Fed tightening and/or rate hikes will impact certain metrics of economic activity and investor sentiment. As such we continue to comb over Fed speeches, meeting notes and the Fed’s Beige Book.
Given the view of a fully employed American economy and firming inflation, the Fed seems securely on track to continue raising interest rates over the next two years. On June 13th the Fed’s FOMC Committee voted to raise the target range for the federal funds rate by 25 basis points to between 1.75% and 2%. The Fed also updated its forecasts for economic growth and inflation. As the statistics in the following table indicate, officials raised the GDP growth projections for this year to 2.8% from an earlier previous projection of 2.7%. The Fed projects the U.S. economy to grow 2.4% in 2019, 2% in 2020, and 1.8% over the long run. Arthur Donner of TalkMarkets.com offers the following review from the most recent rate hike and meeting of FOMC officials in June.
“Examining the data in the following table, and focusing on the median projections, one can see that the Fed officials lowered their median expectation for the unemployment rate this year to 3.6% from 3.8% in March. The Fed also reduced its projections for the unemployment rate in 2019 and 2020 to 3.5% from 3.6%. Over the longer run, Fed officials still expect the unemployment rate to be 4.5%.

“Inflation also received a small boost in the Fed’s median projections, with officials now expecting that core PCE inflation, the Fed’s preferred inflation reading which strips out the more volatile costs of food and gas, to be around 2% this year. The Fed maintained its view that core PCE inflation would be 2.1% in each of the next two years.”
As noted within, the Fed has a significant impact on investor sentiment through their monetary policies and balance sheet activity. With the Fed providing a backstop for the economy during the 2008 financial crisis, the economy was able to bottom and investors gained confidence. From there, the economy is largely left to the consumer, which guides GDP and corporate earnings by and large. Against this backdrop, investor sentiment indicators have come down dramatically since their January peaks and as shown in the chart below from Goldman Sachs.

Goldman Sachs offers that “most US sentiment measures remain relatively bullish” and it’s important to remember that these indicators “were at their most bullish reading ever in January and have since come down toward more ‘normal’ levels.”
With that being offered by Goldman Sachs, one indicator does denote some concern. In Finom Group’s weekly research report, we recently discussed the SKEW index breaking above 150, which has only happened a few times prior to the most recent achievement. We recommend subscribers review the material within the research report for additional details and beyond the definition of SKEW as noted below.
“Skew is the measure of OTM puts vs. OTM calls, when skew is high (just shy of record amounts recently) there are buyers of puts in SPX who are also sellers of calls, which causes a distortion resulting in the skew metric. The activity drives implied volatility higher in the S&P 500. So why is the SKEW so high (above 150)? It is high due to hedging activity: Record numbers of traders are hedging. So let’s look at just how high SKEW is presently or has risen to recently.”
While the SKEW reading may seem a bearish indicator on the surface, forward 6-month S&P returns have been roughly 5% after each occurrence whereby the SKEW was at or above 150. Nonetheless, what the SKEW and higher levels of VVIX are indicating is that at present they are to be monitored closely, as volume protection is being employed by investors of size and scale. Goldman Sachs characterizes the current SKEW reading as follows:
“The only US sentiment indicator that seems to have turned very bearish is the CBOE SKEW index, which reached its highest level since 1990 (Exhibit 3). This could either suggest that investors are looking to buy S&P 500 hedges to protect portfolios or less willingness to buy call options to position for upside.”
In speaking about investor sentiment and the volatility complex, Mad Money host Jim Cramer recently compared the January period to that of the present. The comparison focuses in on S&P 500’s correlated move to the VIX itself. In general, a healthy market assumes a negative correlation between the two indexes whereby if the S&P 500 is rising, the VIX is falling or if the S&P 500 is falling the VIX is rising.
Drawing the conclusions noted and reviewing the January period, the negative correlation between the aforementioned was broken; the S&P 500 was rising alongside the VIX rising. This was, in hindsight, a warning flag that investors were buying protection in great quantity, preparing for a potential pullback in the S&P 500. And that is just what happened in February; a large pullback in the S&P 500 that reconnected the correlation with the VIX. As the S&P 500 spiraled lower, the VIX spiked sharply and produced a more than 100% intraday gain in the fear gauge.
Moreover, what Cramer identified in reviewing the S&P 500 and VIX chart from January, he suggests is not present in the charts during the current market’s rally.
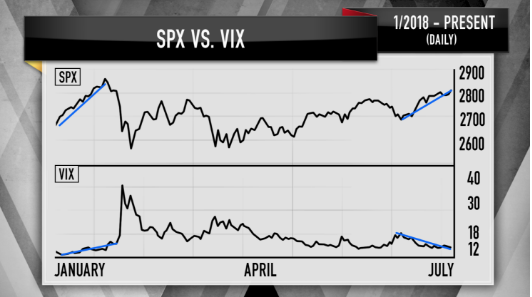
The chart above depicts that during the current S&P 500 breakout, the VIX is still negatively correlated. But, Cramer also discusses the elevated VVIX that demands attention… just in case. An elevated VVIX and SKEW, may not be ominous signs, but the proof is in the pudding and with the added benefit of hindsight. So in short, investors should remain vigilant and monitor all the aforementioned indexes and metrics as the general market carries forward through earnings season.
Yesterday’s mid-session market sell-off that found the Dow’s gains cut and half and the Nasdaq reversing all of it’s gains produced a volatility spike above 13 intraday. Finom Group used the opportunity to alert subscribers to a potential trade that ultimately came to fruition. (See trade alert below)

We expect the market to remain choppy for the foreseeable future given the geopolitical headwinds and fundamental corporate earnings tailwinds tugging at investor sentiment. Subscribe to finomgroup.com today and join our elite, trade alert service and gain access to our weekly research reports.


