
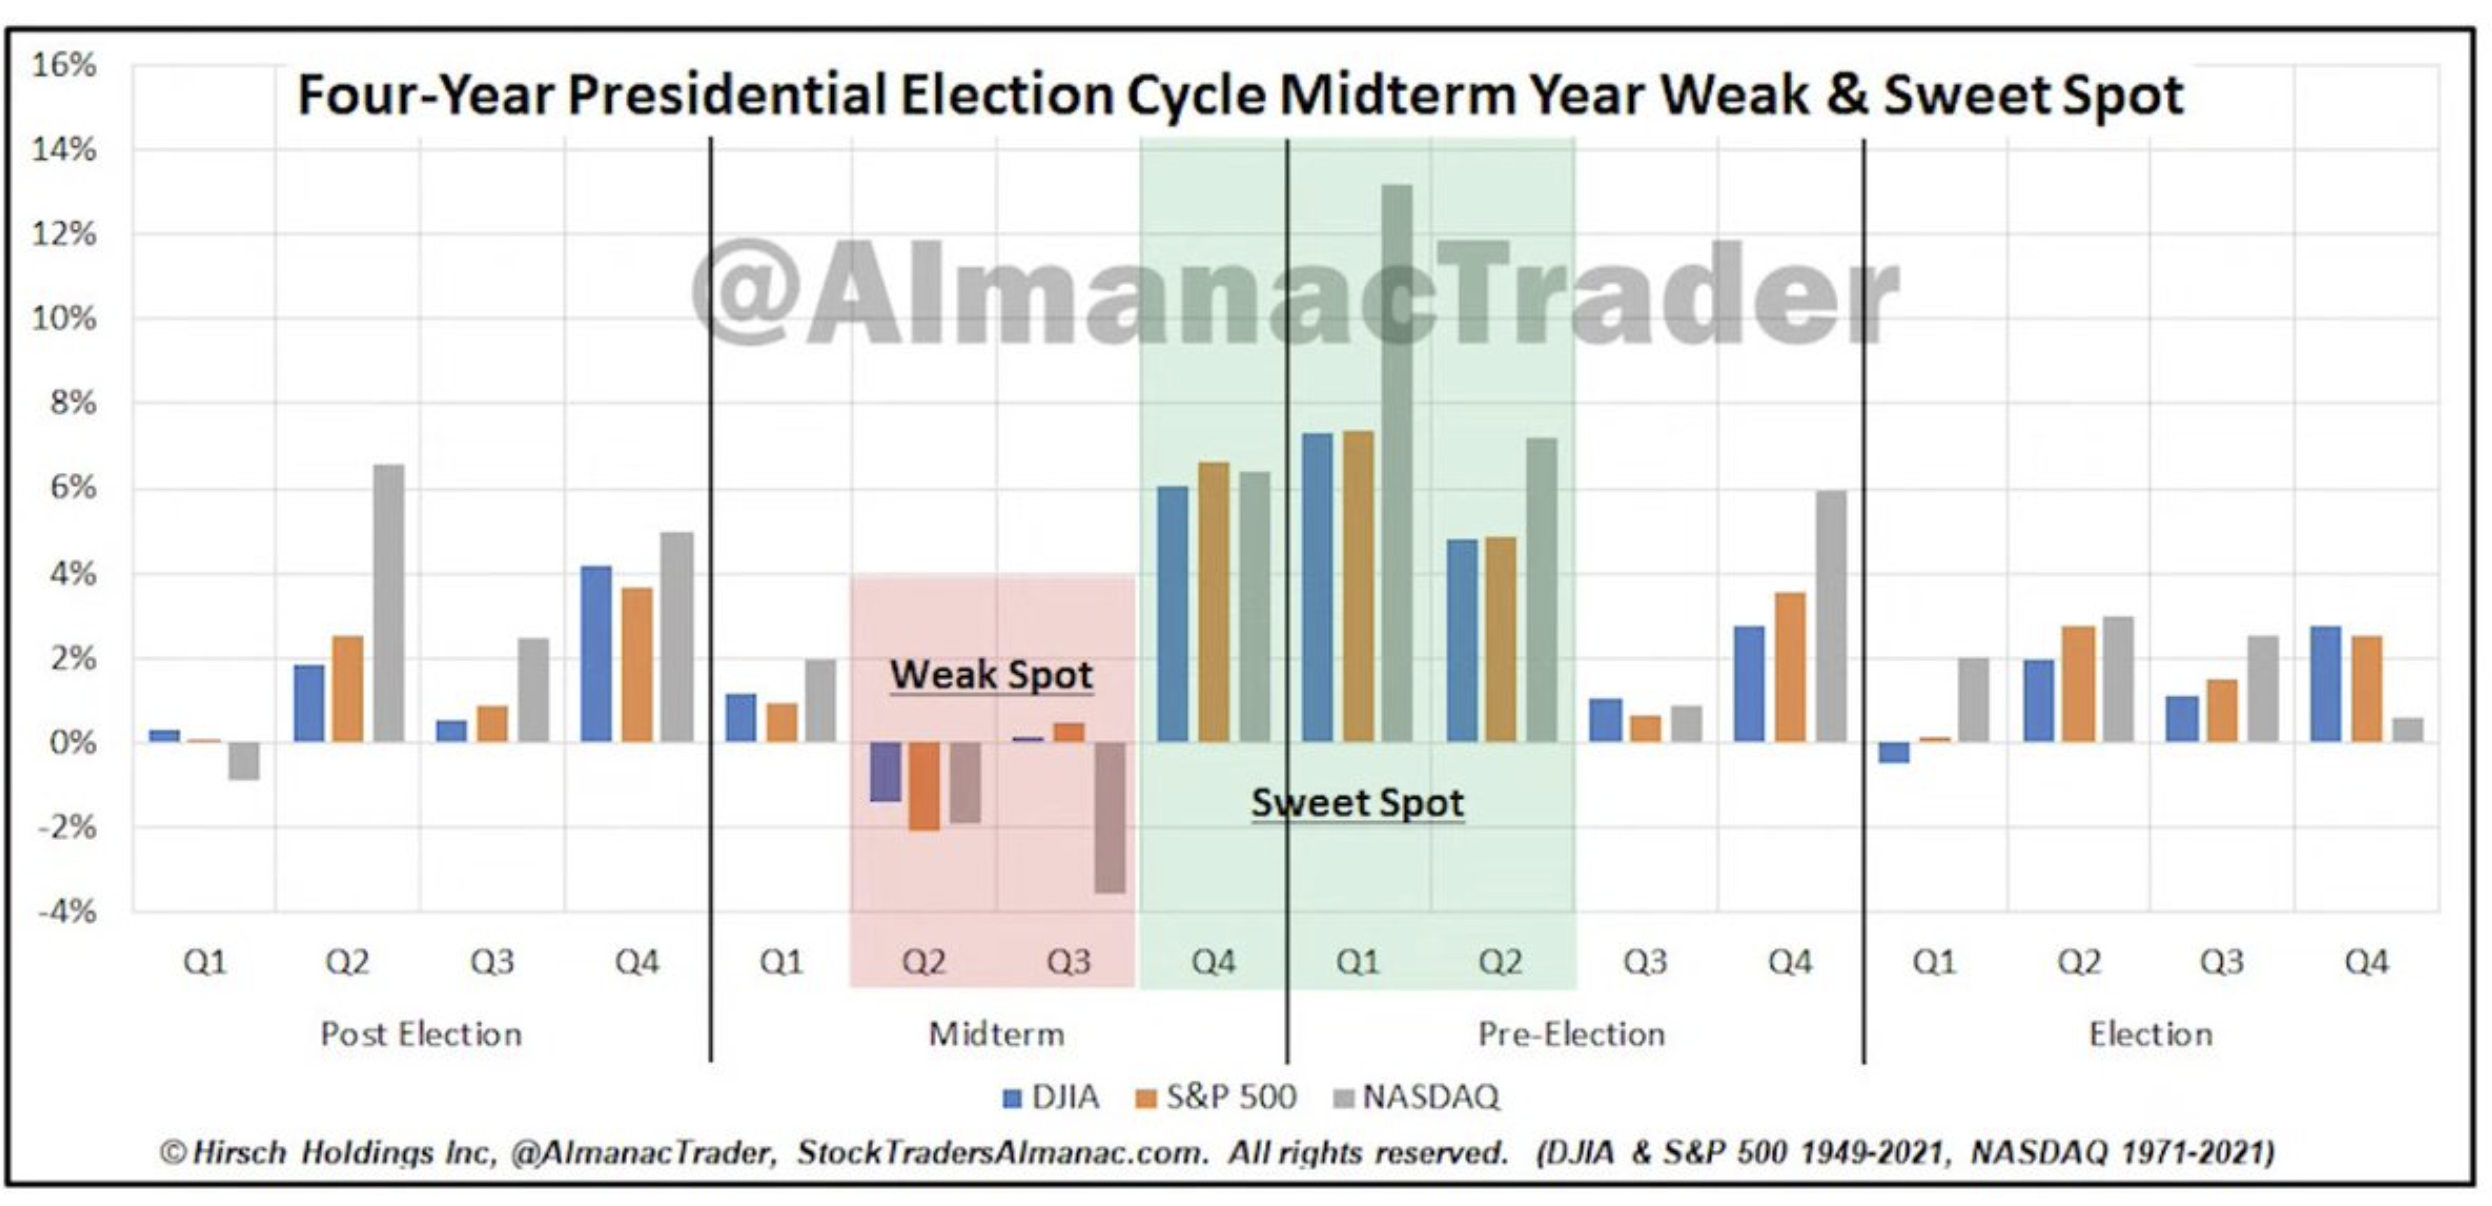
Within this past week’s State of the Market video, our focus suggested that the market has stepped through the open window and into a relatively protracted period of opportunity for investors. It is during the November – April period of the following year that, within a Midterm Election cycle and 4-Year Presidential Cycle, the greatest potential returns are historically offered to savvy investors. This period is otherwise known as “The Sweet Spot.” No guarantees can be offered that the cycle will repeat or if it does to what degree.
And while we don’t mean to be as repetitive as it could be perceived to be, these concepts are worth, well, repeating. When we practice or work on our craft, whatever craft that may be, it develops muscle or cerebral memory/recall. Eventually the “practicing” produces memory/recall from forming/formed connecting of chemical synapses. Seriously, bro? We’re doing Anatomy & Physiology 101 today? Can we please… Okay let’s move onward! (Well excusssssseeeee ME!)
House Keeping Notes
- In December, our chief market strategist Seth Golden will be taking his usual vacation and out for the month. His dedication will provide Finom Group members with consistent weekly SOTM videos, trade alerts/investment ideas, and participation in the Telegram app, per usual. Our final weekly Research Report for 2022 is still being considered, as our monthly reporting cycle ends this week and rubs up against the holiday week. An update will be provided before December 2022.
- Finom Group’s monthly subscription fee/rates will be moderating higher in the new year, per usual. We encourage existing members to maintain your current membership or upgrade if desired ahead of the increase. Existing members will not be impacted by future rate increases with respect to their current membership.
- If you need any assistance with the Finom Group platform, please feel free to contact us at support@finomgroup.com with any questions or platform needs. I (Edward Cordoba) will be able to assist the team with any needs.
Going According To Plan
The major moving averages delivered another strong week of significant upside, after a setback in the previous week. The biggest weekly large-cap index gain was had by the Nasdaq Composite (COMPQ), gaining more than 8% on the week.
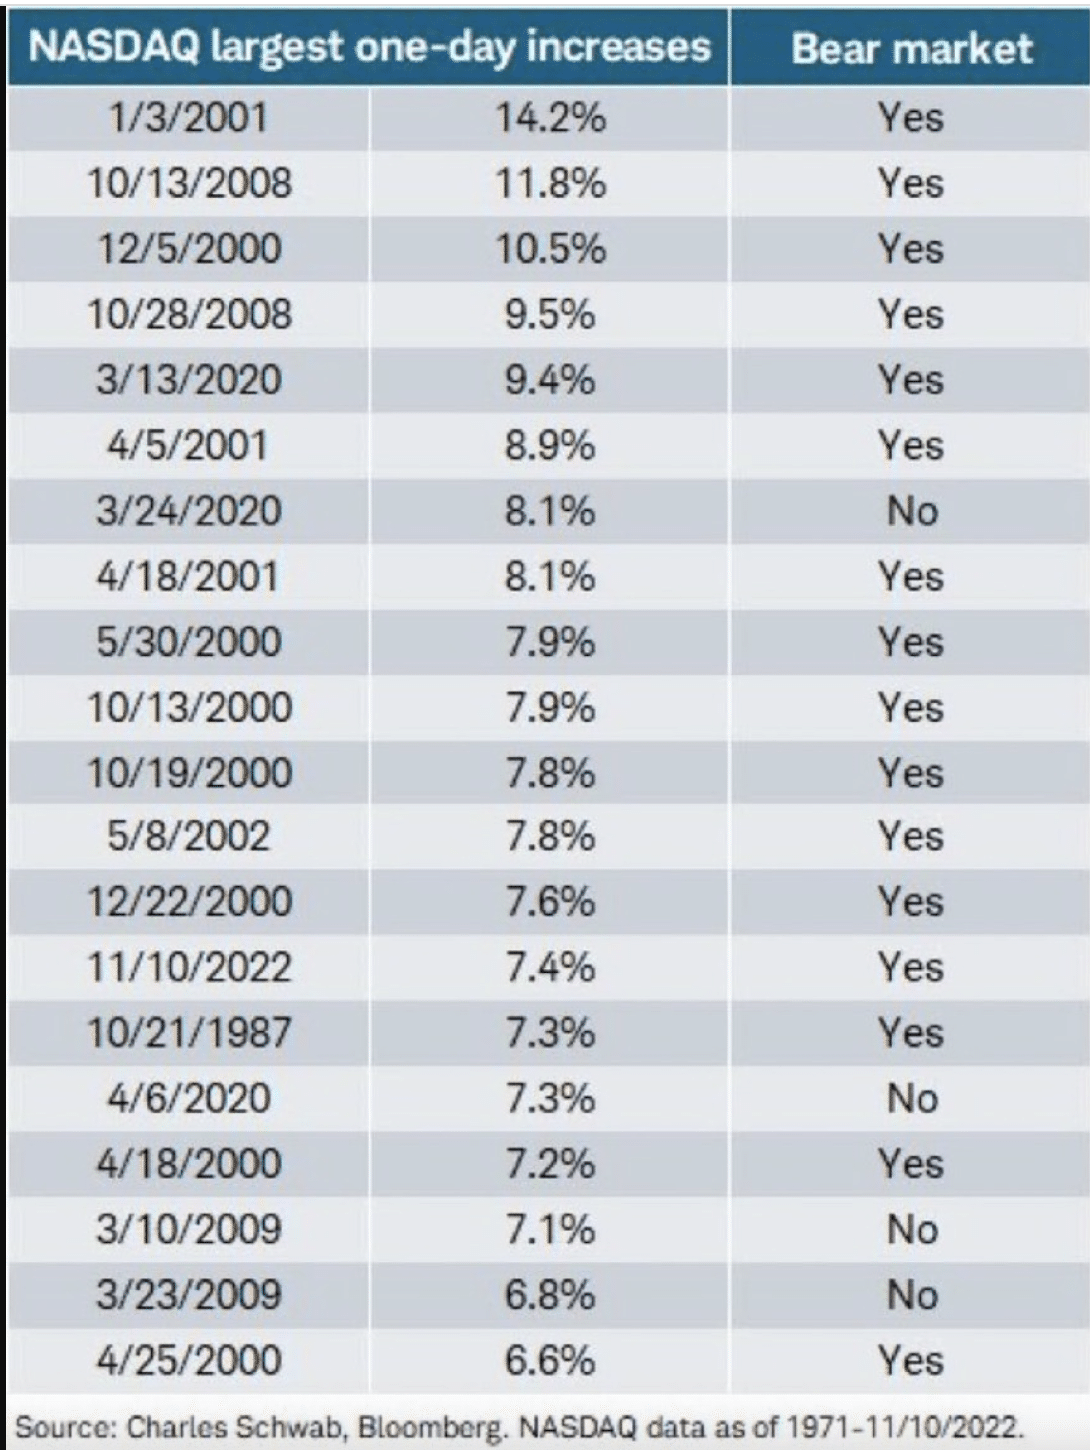
This past Thursday’s release of the highly anticipated Consumer Price Index (CPI) helped to produce the outsized 1-day and full week gains in the Nasdaq and peer large-cap indices. On Thursday alone, the Nasdaq rallied 7.4%, one of its largest 1-day gains in history, as noted in the table above. Year-to-date, however, the index is still the laggard, down more than 27 percent. The S&P 500 (SPX) rallied just over 5% for the week, and the Dow Jones Industrial Average (DJIA) rallied over 4.5% for the week.
These 1-day and weekly gains will be heavily scruitinzed given the bear market and downtrend that has persisted throughout 2022. We don’t know for sure whether or not this week’s rally, or the rally that actually commenced in October, is the start of a new bull market without hindsight; frankly nobody does and that is how it works. What we do know, however, is what history suggests we should be looking for to confirm a new bull market. A move above the 200-DMA with supporting breadth would more concretely certify a new bull market. The table below, from Ryan Detrick, contextualizes the potential of a new bull market, given past percentage gains off of the bear market lows 1-12 months out.
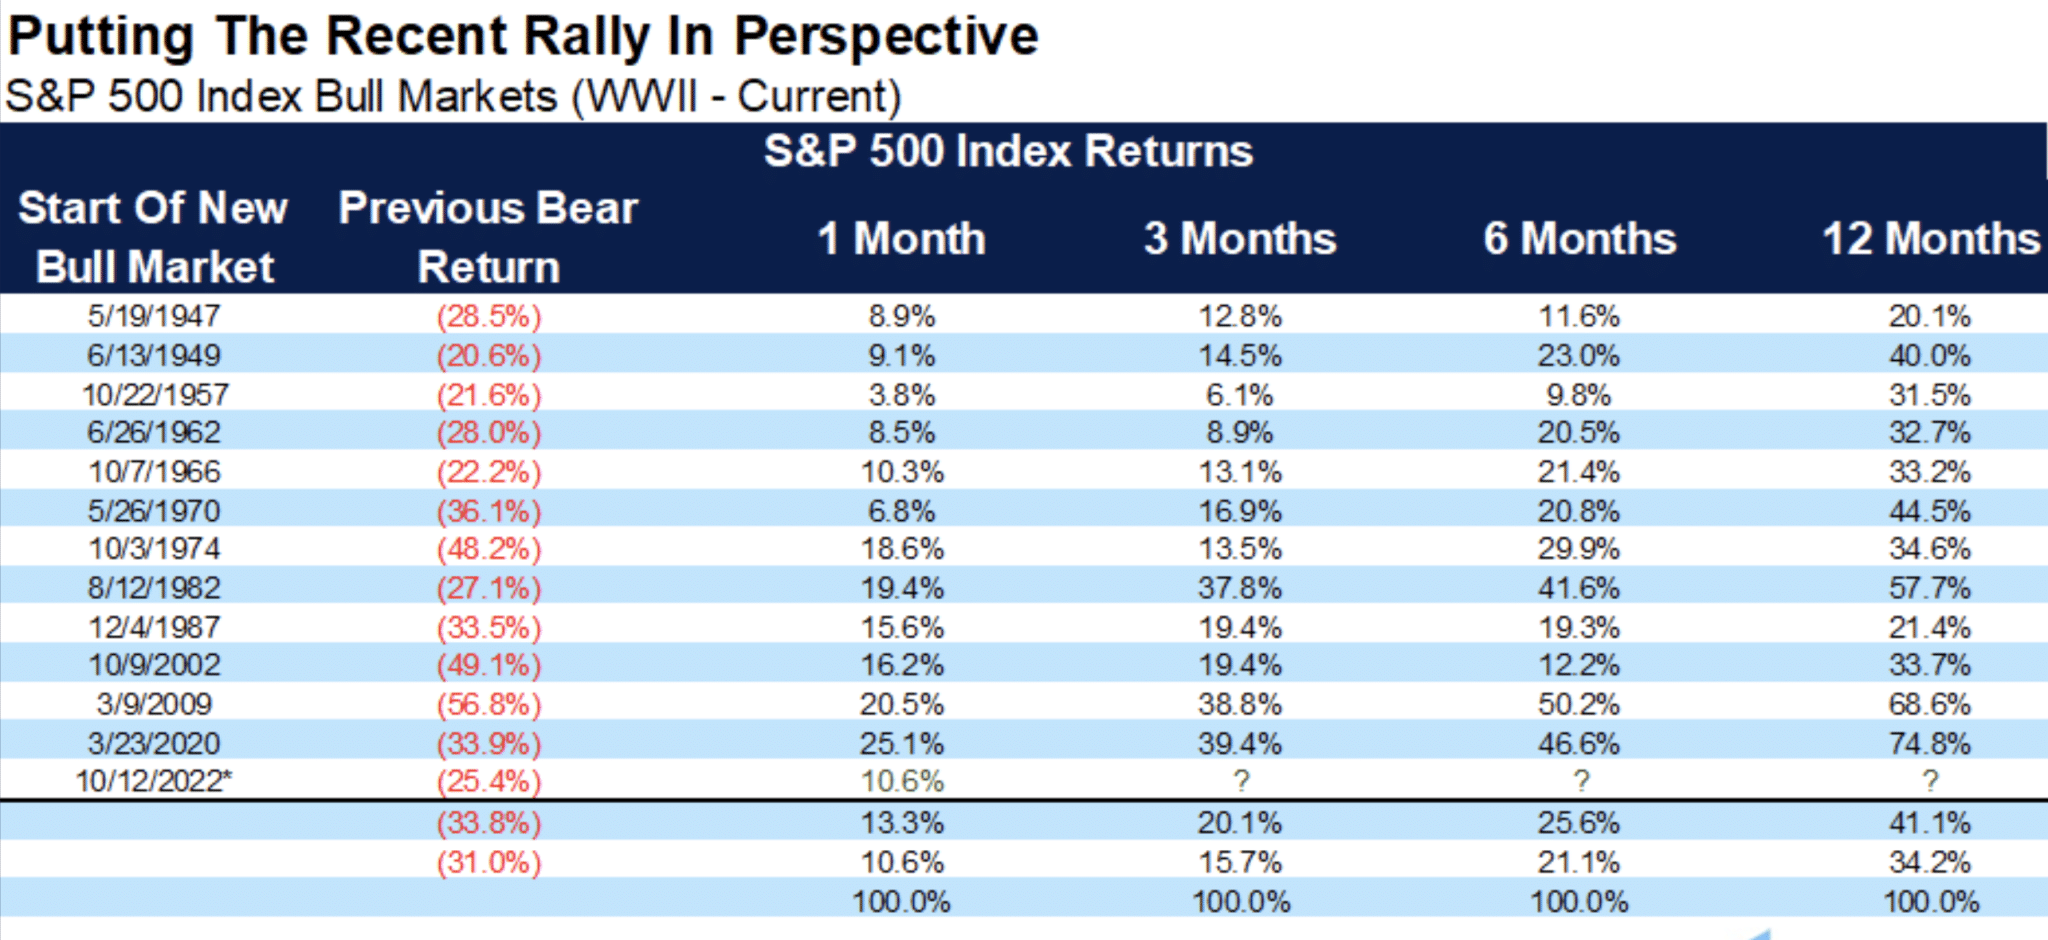
I think it’s pretty clear, from the table, that markets have significant gains off the lows, but need to see those gains carry forward for several months, if not a couple of quarters. Speaking of quarters…
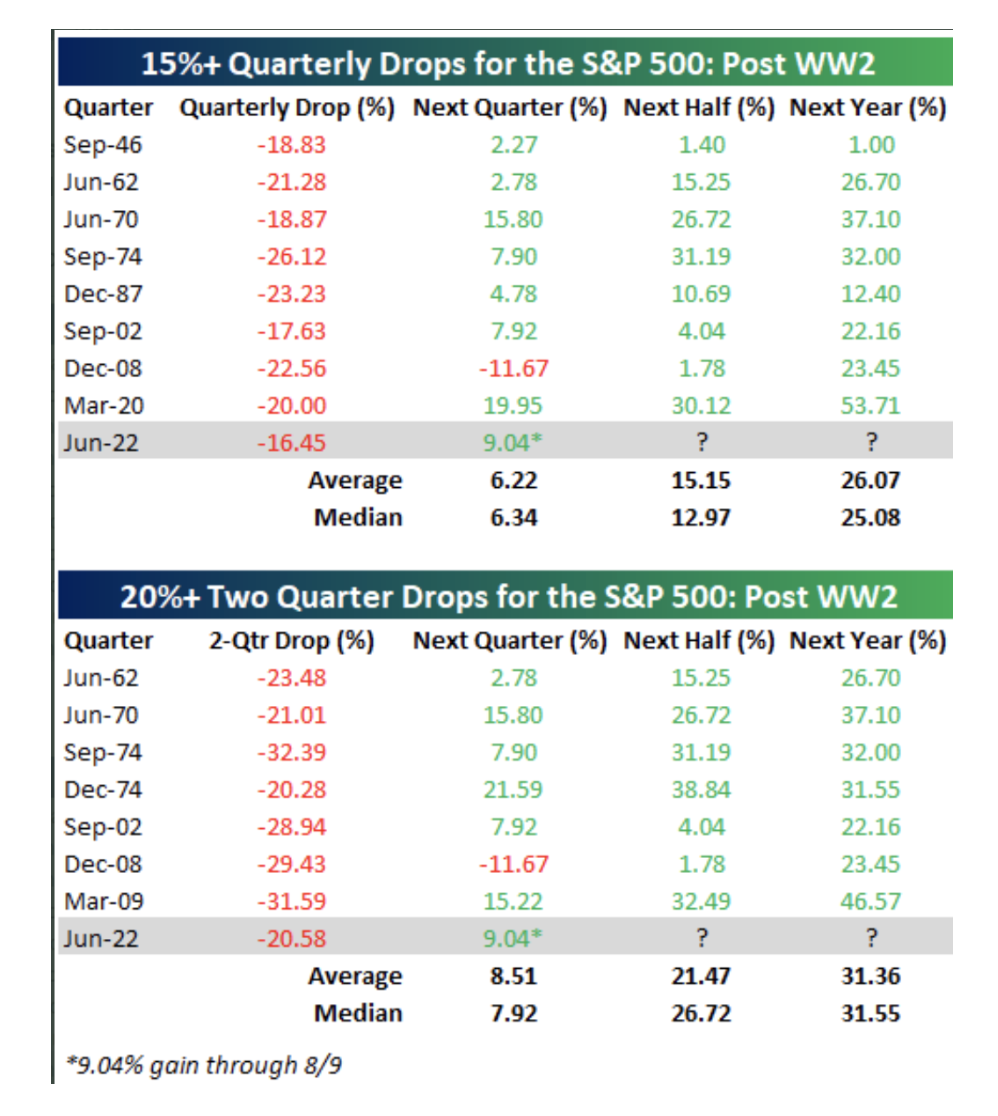
Recall that the market had been down for 3 consecutive quarters, which is quite rare for any calendar year or market status. In 2022, the S&P 500 had been down through the first half of the year (2 consecutive quarters) by slightly more than 20 percent. The only other times this feat of bearish price action has been seen is noted in the revisited table below from Bespoke Investment Group:
- Q2 fell 15%+.
- Q1 & Q2 combined fell 20%, in 2022.
- Historically, this has happened only 8 other times.
- Only 2008 had more declines after either a 1-Quarter decline of 15%+ and/or a 2-Quarter decline of 20%+, until 2022 of course.
- Given the data above, it would have been suggested that it was unlikely or a lesser probability that Q3 2022 would deliver a negative return, but it happened. We might consider the variable that helped to deliver even greater value for the savvy investor as being a causation of the tighter Fed policy.
- Nonetheless, two Quarters after a 2-Quarter drop of 20%+ the market has never delivered a negative return over the following two Quarters later, which would be the pending Q4 2022 period. In other words, the probabilities are that 100% of the time after a 2-Quarter 20%+ drop, the market has been higher two Quarters later.
- At the end of Q2 2022, the S&P 500’s price was 3,785.
- While the historic data is a reasonable guide, we can’t suggest it’s the Gospel.
- History suggests that such data proves consistent and the savvy investor should generally lean into the higher probability returns. If they don’t bear the fruit of such higher probabilities, time is still the best friend of the savvy investor.
- Lastly, note from the table above that all occurrences were positive 2, 3, and 4 Quarters later.
At the end of Q3 2022, investors were forced to recognize just how powerful the Fed’s bully pulpit had become, as the S&P 500 fell further and finished the quarter at 3,585 (*table does not reflect as it was issued during August 2022, during mid-year rally). This was an additional quarterly decline of over 5 percent. The only time the S&P 500 fell 3 consecutive quarters since 1962 and after already falling 20% proved the lesser probability, but that’s 2022 in a nutshell, delivering the lesser probable outcomes. With all that under review, there is definitely good news from within the same study as we continue through the Q4 2022 period, and window of opportunity recognized by “The Sweet Spot”. Never, never has the S&P 500 been down in the 4th straight quarter, after a two quarter 20%+ decline. Moreover, never has the S&P 500 delivered a negative return 12 months after a two quarter 20%+ decline. This final statistic would take the market into June of 2023 with a positive return from June of 2022. We don’t know the path for which the S&P 500 would necessarily travel between now and June of 2023, but history suggests that the market would be higher than 3,785, where it finished June of 2022.
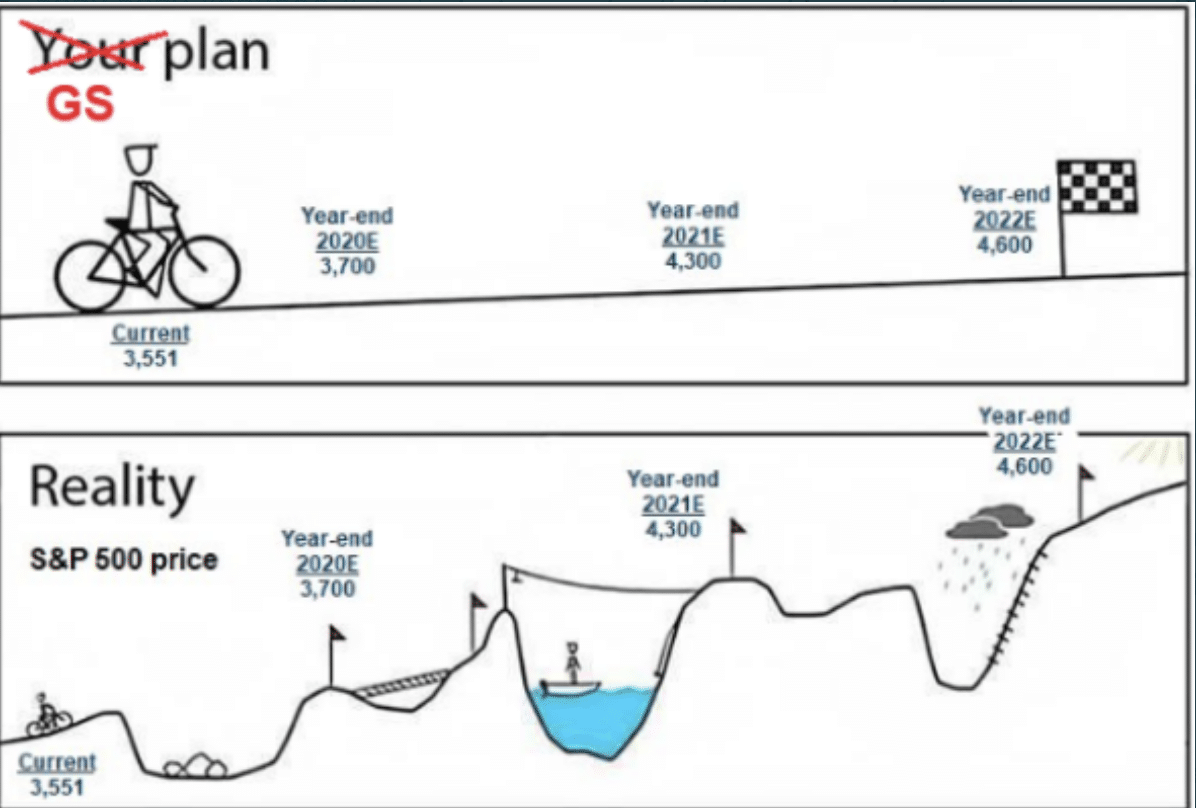
The graphic above helps us to put into perspective the differences between the ultimate destination of markets and the reality of how markets get to that ultimate destination, which is higher-highs over time. This graphic tends to remind me of something I have learned througout my spiritual journey, which is a saying that gets pushed around religous circles: “Humans love to plan, and God simply laughs at our plans.” In other words, destination is rooted in destiny. It may not prove terribly beneficial for investors to focus and act squarely on the potential potholes, pivots, volatility, and pullbacks along the way to the destined destination.
“The one thing that gets in the way of investing is the stock market itself” ~ Jack Bogle
The good news is that the market is developing strength, and has been since the October lows were set. What may prove to be extremely coincidental is that the lows of March 2020’s bear market and the lows of the 2022 bear market will have both ended with the same digits. In 2020, the bear market trough was 2,191 and to-date the bear maket trough was 3,491. And to reiterate, I am of the opinion the trough in the bear market for 2022 will hold. Recall from within last weekend’s Research Report:
“At the June 2022 lows, I emphasized that I was not convinced the lows for 2022 had been achieved. Unfortunately, this was proven right in early October with the new year-to-date low of 3,491. Market seems to like that _ _91 level, does it not? Recall that the ultimate March 2020-low was 2,191. That’s both funky and cold; hold the Medina please! With this I am more comfortable suggesting the lows are now set for 2022. This doesn’t suggest the market only goes higher, that revisiting the lows can’t happen, or even that I will prove right with this thesis. I’m simply laying my beliefs out for future reference along with my rationale.”
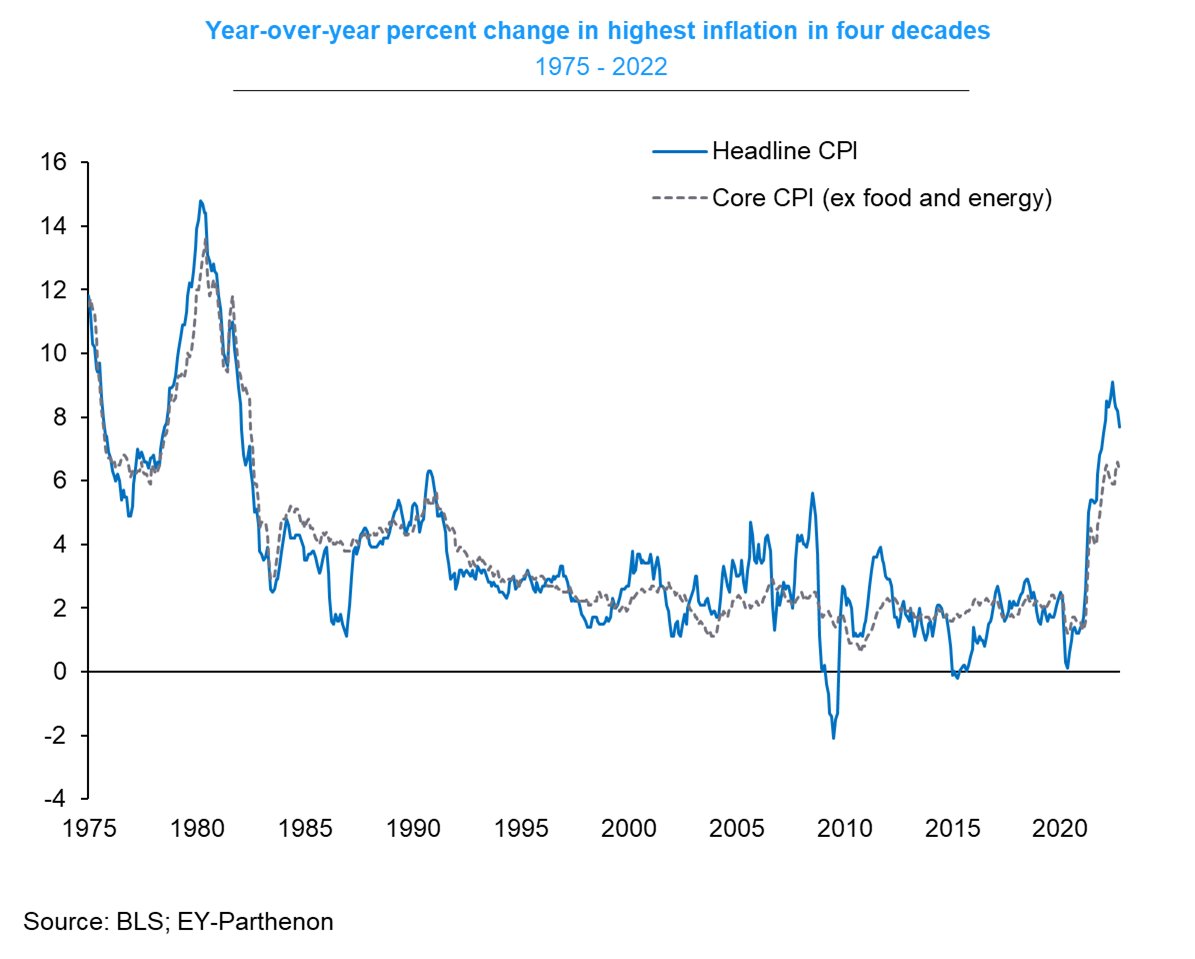
I am actually more confident that the 2022 lows are in place given the macrofundamentals surrounding inflation, as we learned with this past week’s release of the October Consumer Price Index. While economists were favoring and forecasting a YoY headline decline in CPI, the decline proved larger than economists’ estimates. Headline inflation was down -0.5ppt to 7.7% y/y (still near highest level since 1982, but lowest since Jan 2022).
While we have known for some time that the private data was showing and evidencing a peak in actual inflation occurred likely this past June, much of the lagged data is only “starting” to reflect in the CPI presently. And we don’t think that this is just a “one-off” disinflation print. We think this is the mouse sneaking into the house through a door only slightly cracked open, which will eventually lead to the floodgates opening, and more downside in the CPI into 2022. We are not the only one’s in the camp that believe this is just the first of many disinflationary prints ahead. Below is a breakdown of the individual components in the October CPI:
Core CPI +0.3%
Food +0.6% food🍔 Energy +1.8% ⚡️ (gas -4.9%)
Goods +0.5% New 🚗 +0.4% Used 🚙 -2.4% Apparel -0.7% 👕
Services +0.4% (cooling) Shelter +0.8% 🏠 Rent +0.7% 🏚 OER +0.6% 🏚 (cooling) Med -0.6% 🚑 Air -1.1% ✈️
There’s some really good news in the data above and from within the October CPI that should prove the new trend. FIRST, the greater than forecast decline in headline and core CPI came WITHOUT Shelter and OER yet reflecting the dowturn in rental prices that we’ve previously outlined via the monthly private data. The biggest part of the inflation basket is Shelter, including rents on primary residences and something called “Owners’ Equivalent Rent” (OER), which is the “implied rent” that owner-occupants would have to pay if they were renting their homes. The latter is also determined using rents of equivalent homes. In other words, OER is effectively a measure of rents, and altogether rents make up a whopping 40% of the core inflation basket.
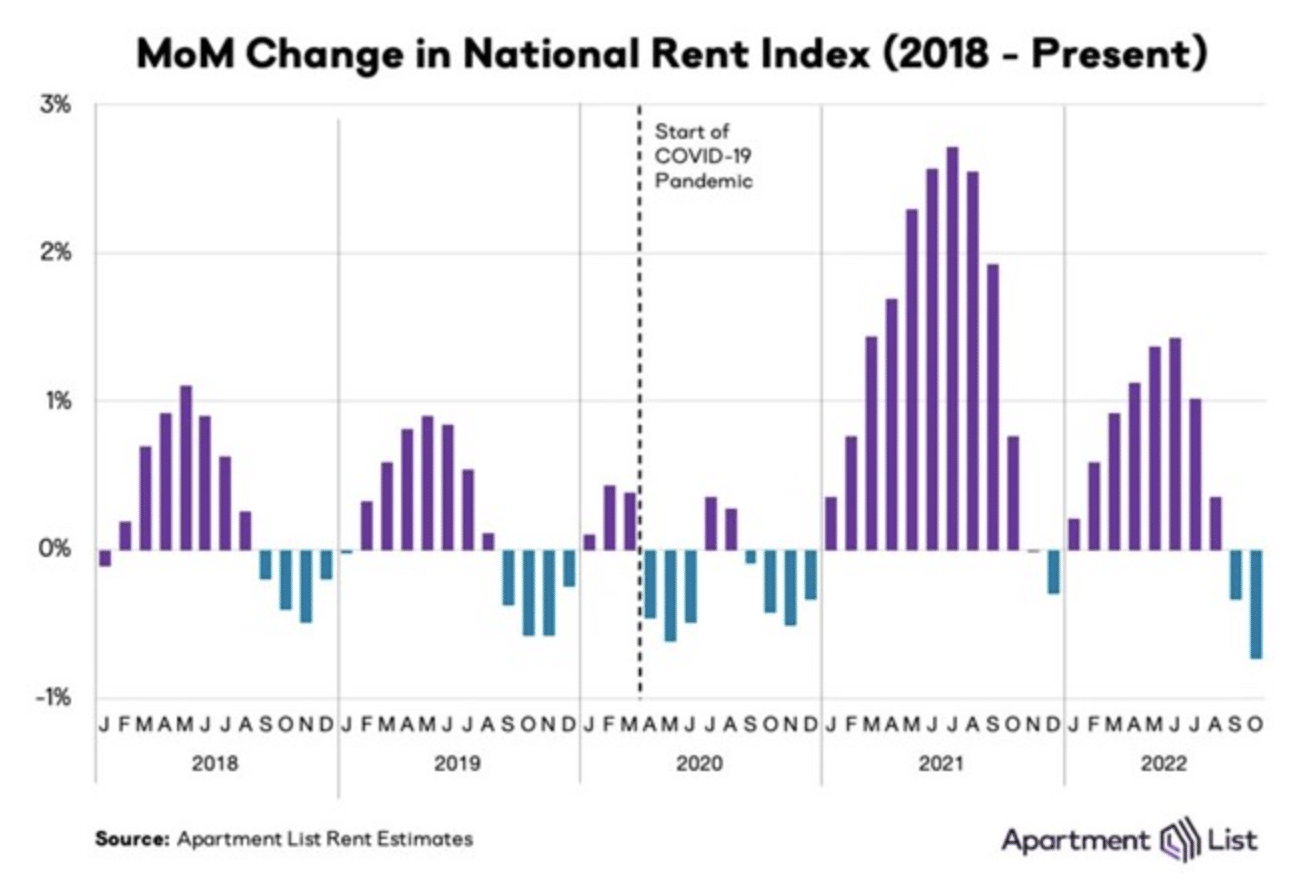
And rents have been rising within the CPI, putting a lot of upward pressure on core inflation. You can see the gray bars in the chart below from Carson Wealth, Shelter/Housing growing larger and larger over the past year. However, market rents have been decelerating quite rapidly over the last few months. The problem is it hasn’t shown up in the official inflation data because of methodological reasons. (apartmentlist.com)
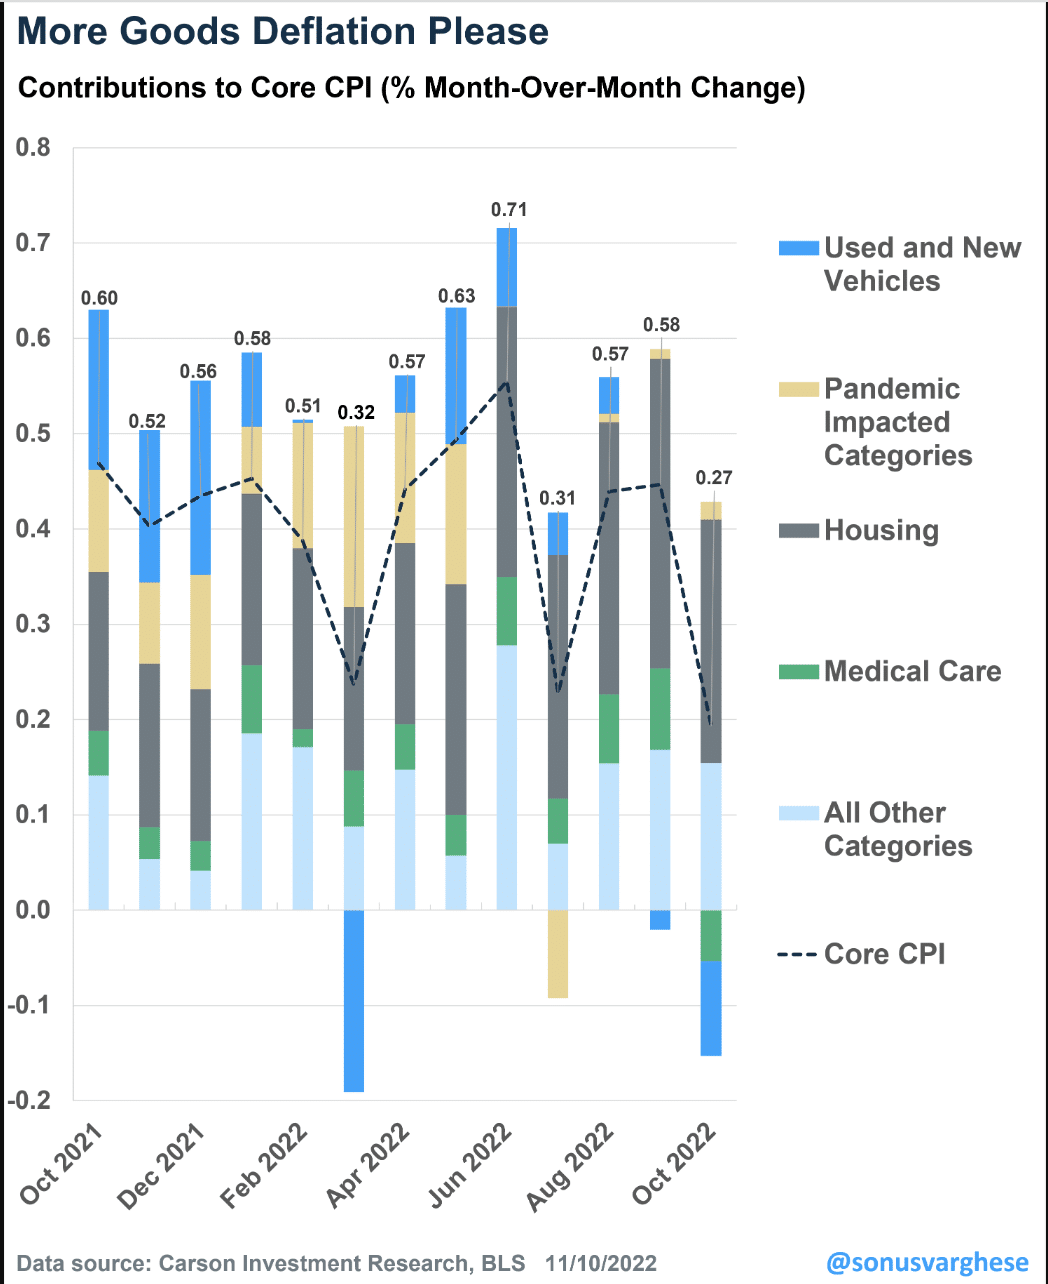
But the official rental data may be beginning to turn, as we have been anticipating. Rent of primary residence rose 0.7% m/m and OER rose 0.6% in October, which is lower than what we’ve seen over the previous couple of months. Make no mistake, a 0.7% rise is still a lot, and that translates to an annualized pace of 9%, which is why the Fed is concerned aboiut this category. But hopefully, the October data is a sign that the official data is beginning to turn and follow the private data, lower into Q1 of 2023.
SECONDLY, look at the Medical Care (green bar) category within CPI. Notice that it actually fell in October and for the first time during the inflationary period. Is this a one-off type of situation that will actually detract from a disinflationary trend we forecast? It’s a reasonable question given the trend, and as we know, one month’s worth of disinflation does not prove a trend. So here is what we researched and found to be the answer to this very question, as outlined by the Labor Department:
“The Labor Department bases the price of health insurance in large part on health-insurer profits, which are reported with a lag of about 10 months. Thus, data in the October 2022 CPI reflect what happened in 2021. In 2020, lockdowns, limited healthcare capacity and consumer reluctance to seek care translated to lower healthcare spending and thus reduced benefits paid by insurers and commensurately increased net premium income. That showed up as skyrocketing health-insurance prices starting in October 2021, when the 2020 data were incorporated. This year’s updated data are based on 2021, when consumers caught up on preventive care and elective procedures, eating into insurers’ premium income, which should translate to a drop in health-insurance prices in the CPI.”
Omair Sharif, founder of Inflation Insights LLC, estimated the health-insurance index will decline 38% by September of next year from this past September. That would mean health insurance would go from adding around 0.38 percentage point to the 12-month increase in core inflation as of last month, to subtracting about 0.42 percentage point by next September, Mr. Sharif said.
The change to the one-month rate that shows up in October will continue at a fairly consistent pace for the next 11 months. “When we establish that new trend, this trend is likely to persist for a full year,” said Ryan Wang, U.S. economist at HSBC. “That’s one of the aspects of this methodological quirk.”

What you will likely here more often and going forward is the colloquial, “We’re not out of the woods yet.” That’s fair! Inflation remains at 40-year highs, but it is definitively moving in the right direction, and has proven the peak in inflation was this past June. From this point forward, it becomes the investor’s objective to ensure that they are positioned well for the disinflationary period taking hold. Recall what we outlined previously with respect to what delivers market liquidity, in part, lower inflation/disinflation.
“Annual CPI inflation is set to fall substantially in the coming months, which greatly increases the odds that real liquidity growth is currently at or near its lows. Indeed, major tops in the inflation rate have historically marked the lows in real liquidity growth, and as they inflect higher. The Fed halting rate hikes is not necessary for liquidity growth to resume, although it can spur it further. Inflation peaked when real liquidity growth bottomed in 1966, 1970, 1974, and 1980. The CPI is now at 8.2%, but if it decreases to 3-4.5% in the coming year, real liquidity growth will rise even if the nominal money supply contracts (which seems doubtful).”
Certainly, we can look at a variety of factor performance variables that suggest “you need to be in this sector and out of this sector, in this index and out of that index”, but such exercises in factor performance will likely prove a poor discipline and beg of investors to focus on POTENTIAL potholes along the pathway to the ultimate destination. With that being said and to repeat, simply be invested and continue to manage your cash wisely, allocating as value opportunities present themselves. Thist past week’s price action likely proved the point that moving entirely to cash, in order to avoid greater drawdowns, ultimately proves wasteful. After a 10% move off the October lows and a 5%+ gain this past week, most of these sidelined investors/traders are likely convincing themselves that the market is too expensive once again, and heralding the downturn in earnings for 2023 making the recent rise in prices… UNREASONABLE… “and so I’ll wait for another pullback or the ultimate lows”.
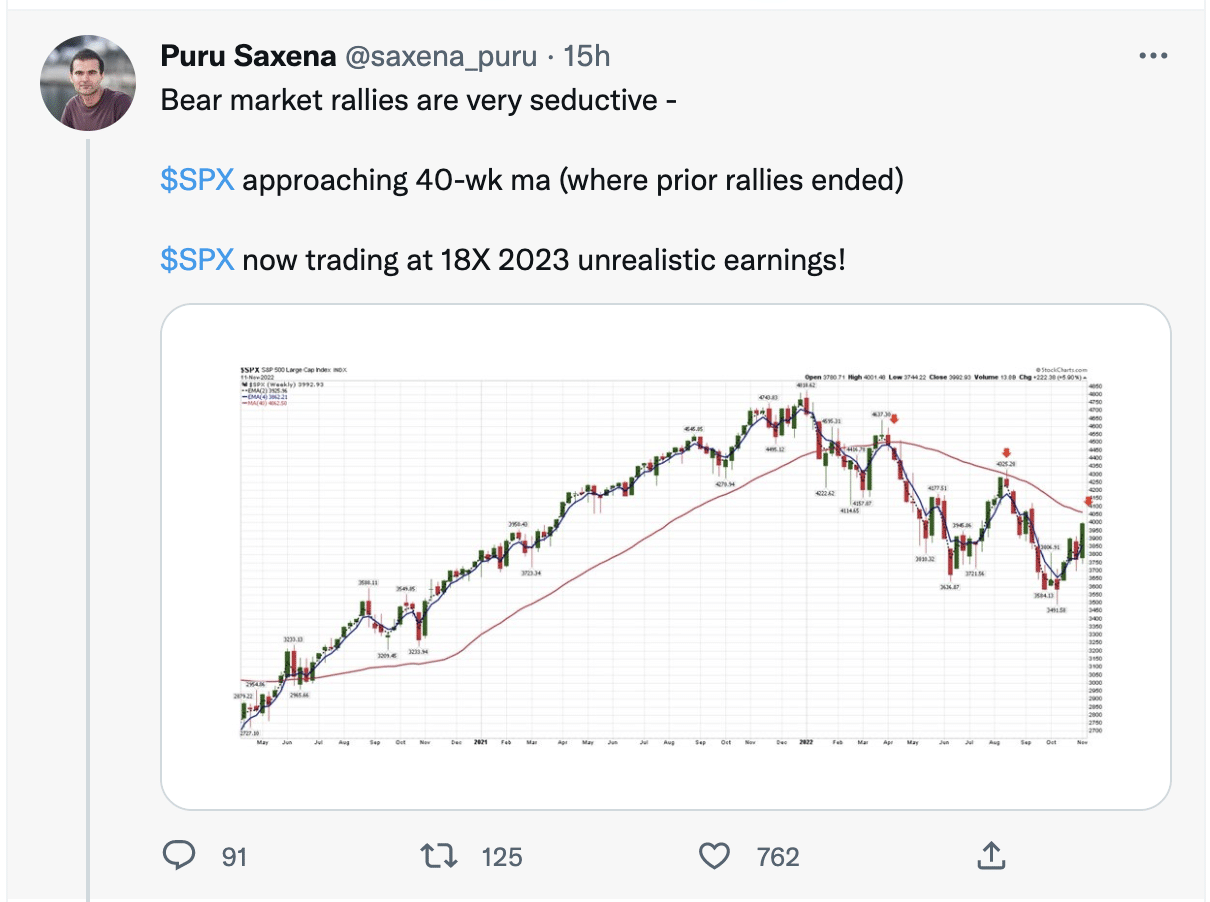
In the same vein that folks will suggest we’re not out of the woods yet regarding inflation, I would assert that same colloquialism when it comes to suggesting the bottom for 2022 (MAY) NOT YET PROVE THE ULTIMATE BOTTOM OF THE BEAR MARKET! So I’m not picking on Puru, here. I’m actually “featuring” his sentiment and/or analysis. The fact is that he may be proven right, if economic conditions worsen from here into early 2023. Additionally, and as we’ve been stating with respect to our long-term Recovery Road Map, having cash positioned for a potential market move down to 3,200s is still a reasonable game plan, until the macro-fundamentals suggest otherwise.
Moreover, as convincing as Puru may be with respect to his social media presence and experience, we would also find history of actual market performance to hold equal and/or greater influence. Consider the fact that, and as we’ve outlined in the past, October tends to be a “bear market killer.”
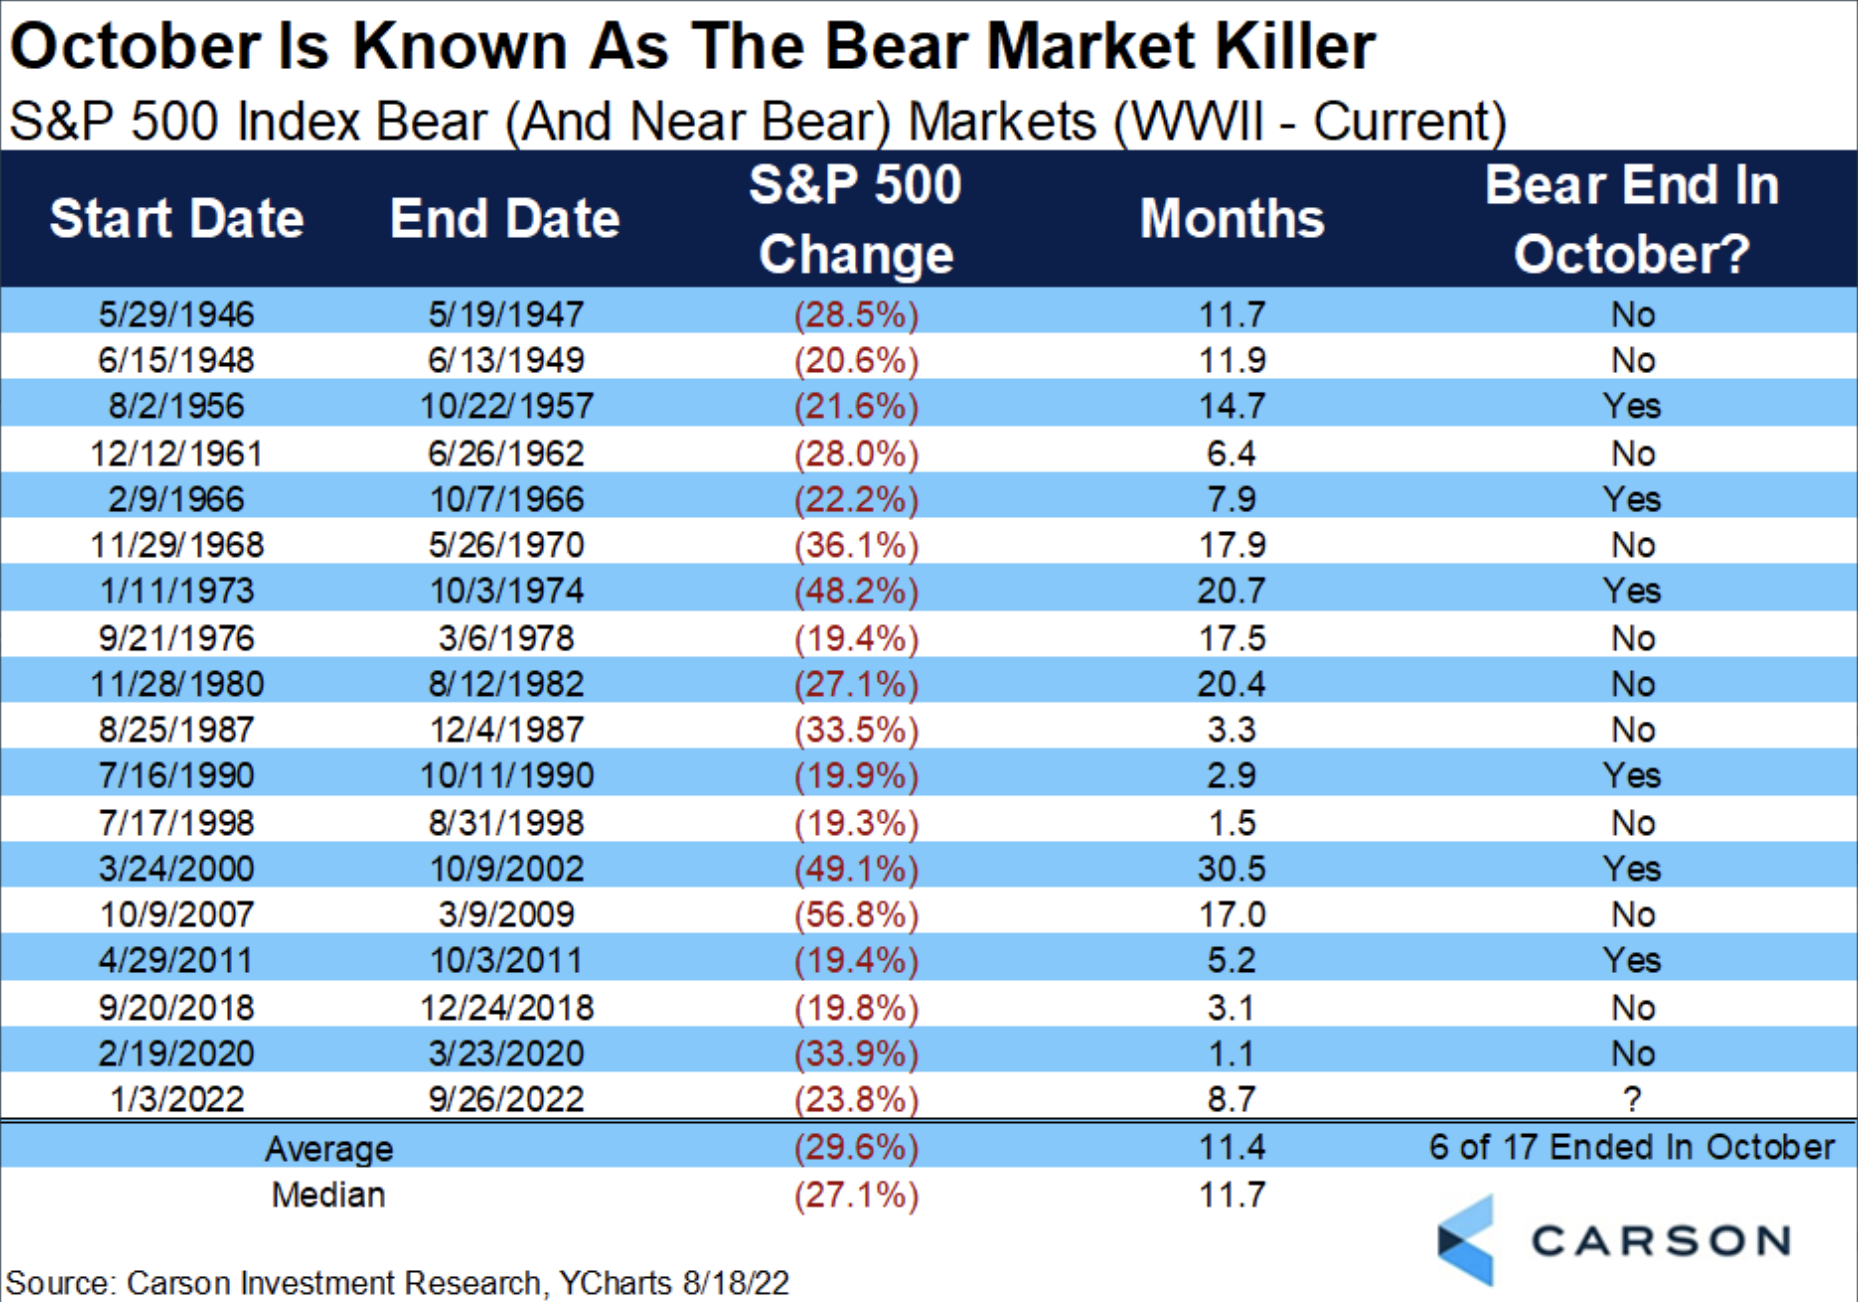
A total of 6 bear markets ended in October, since 1956. Several found their greatest declines in the month of October, most notable the 1929 and 2008 crashes. (Carson Wealth Group)
- The 1974 Bear Market Bottom. The entire year was rough for stocks. But the fall of 1974 was particularly terrible and, by the time October rolled around, stocks had lost nearly 50%. The markets didn’t find their upward momentum again until December 1974. Obviously, a few months is a lot faster than a few years. But it’s still a lot longer than expecting stocks to head back up after the initial crash.
- Black Monday. In 1987, the markets experienced another October wipeout. It was named Black Monday, and the setup was similar in many ways to what’s unfolding now. Inflation was hot, economic growth had stalled, and the strong U.S. dollar was wreaking havoc on international sales. Ultimately, it caused valuations to expand to unsustainable levels. And it took months for the market to find its footing after the October blowout occurred.
- Early 1990s Recession. A few years after Black Monday, the market fell 20% in a short span, ending in October 1990. While it started to turn around in the middle of that month, things didn’t get going until the following year. A similar pattern played out in 2008.
- The Great Recession. The market plunged 40% in 2008, with most of the fall taking place in October. But the market didn’t hit its lowest point until March 2009, about five months later. Of course, as we know now, that recovery became the longest-running bull market in history.
There is more history to reflect upon in our weekly analysis. Through the first 187 days of the trading year, only 1974 and 2002 held equal or greater declines on a year-to-date basis (chart below does not reflect the total peak drawdown on closing basis of 24.95%). Both of these calendar year drawdowns were in the previous study outlined by Bespoke Investment Group, and guess what…
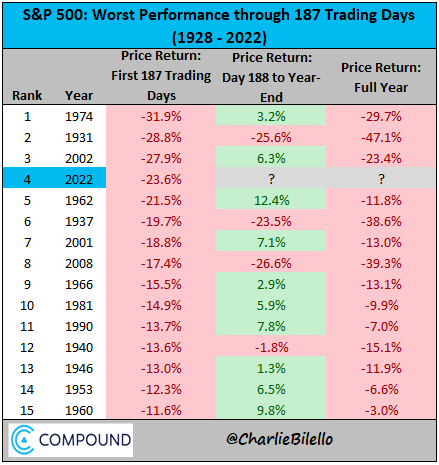
- 2022 has been the worst start to a year for the S&P 500 since 1974 and 2002, through September and with a nearly 25% bear market.
- Only 2 times in post WWII era has the S&P 500 had an equal or greater decline compared to today.

… the funny thing is, for both 2002 and 1974, October marked the ultimate bear market lows. And yes; both years were also midterm election years. The new bull market started on the 1st trading week of those 2 calendar years. No other month has more than 2 bear markets ending in October. Years that end in “2”, tend to bottom in October actually (either bears or corrections): 1962, 1972, 1982, 2002, and 2012 
Another piece of market history that could potentially point to a new bull market is the October Bullish Outside Reversal. Bullish outside reversal days from a 52-week low have only happened 7 previous times since 1978. The last one that occurred, which makes 8, took place this past October 13th. Table below from Schaeffer’s Analytics:

- This table shows the individual dates of bullish outside days that occurred alongside a new 52-week low. The last occurrence in 2018 marked a great buying opportunity with stocks gaining 5% over the next two weeks and 14% over the next three months. The signal before that happened all the way back in 2008 and the market fell almost 20% over the next week. Generally, however, these signals have been good times to buy. (Schaeffer’s Analytics)
- In looking at the dates above and recognizing that only 2008’s signal found the S&P 500 down 3 months later, I wen’t back to 1975 to recognize that never had an outside bullish reversal day from a 52-week low found the S&P 500 down 6 and 12 months later, except from 1/23/2008.
From a 52-week low, a bullish outside reversal has typically spoken to a capitulatory moment and marked the bottoms of corrections or bear markets. While it has proven popular to suggest a VIX of 40+ is necessary to confirm capitulation, we encourage investors to recognize the difference between what’s popular and what’s factual. Since 1990, the average VIX high at the S&P 500 low/correction low has been 37. It all depends on positioning and the rapidity of a market decline/correction. Slower and persistent corrections with light positioning don’t typically deliver a VIX above 37, let alone 40. And for those who suggest the bottom is in when “retail investors” finally sell; the J.P. Morgan notes below suggest they were selling heavily and ahead of the latest CPI reading for October:
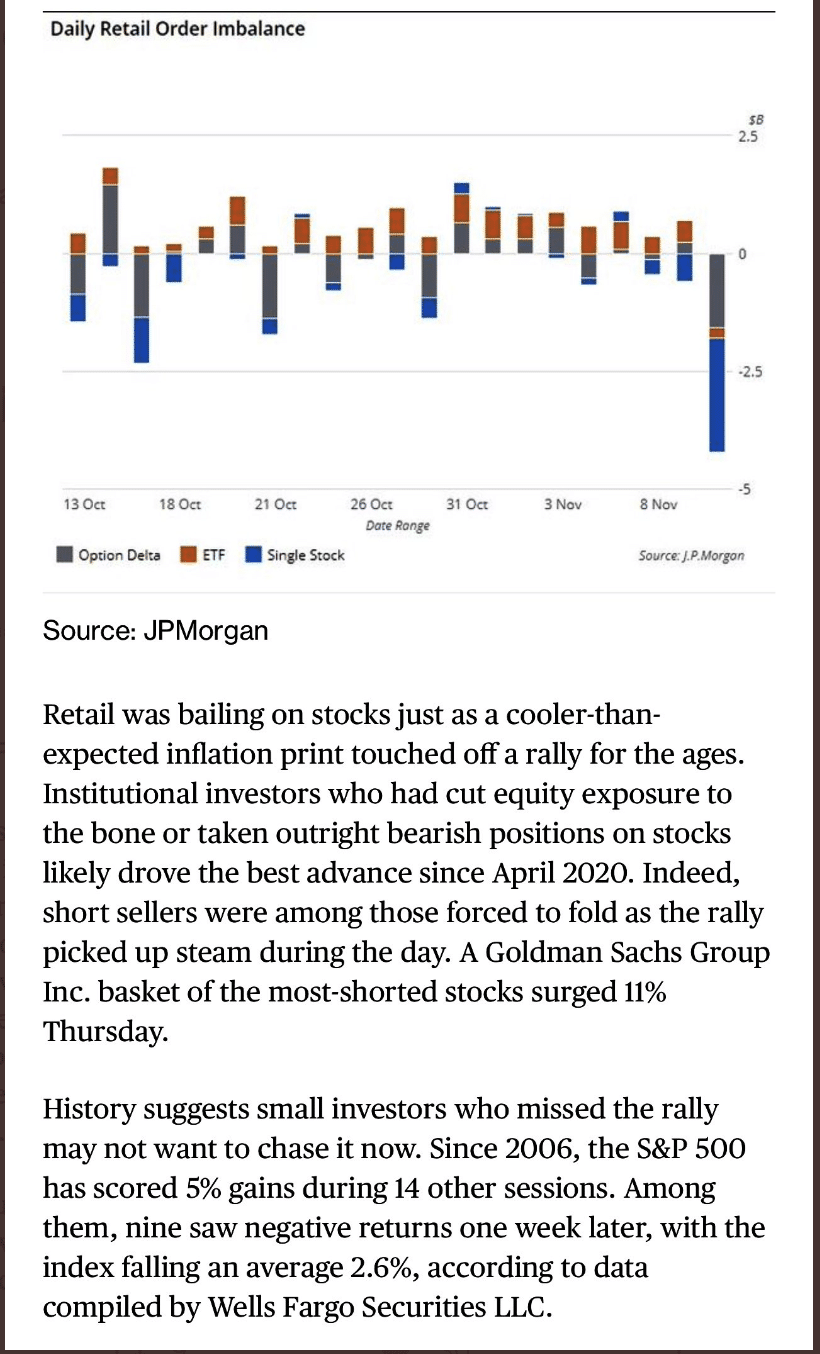
That last sentence within the J.P. Morgan notes likely speaks volumes with what investors might expect going into the coming trading week. Typically a big day and/or week finds a goodly amount of price consolidation i.e. negative returns. This does not discount the “window of opportunity”, however, and we would encourage investors to review the long-term potential outlined in the various pattern recognition data from the studies above and “The Sweet Spot”. In other words, the savvy investor would actually find consolidation of the recent up-move since October of great benefit, buying value on pullbacks.
As the Carson Wealth table above shows, near term market performance after a daily gain of 5% or greater can prove cumbersome, but longer-term the trend of returns proves far more favorable and in-line with what we see from *bullish outside reversal days. If not for the near-term potholes, right?
You Scared Bro?
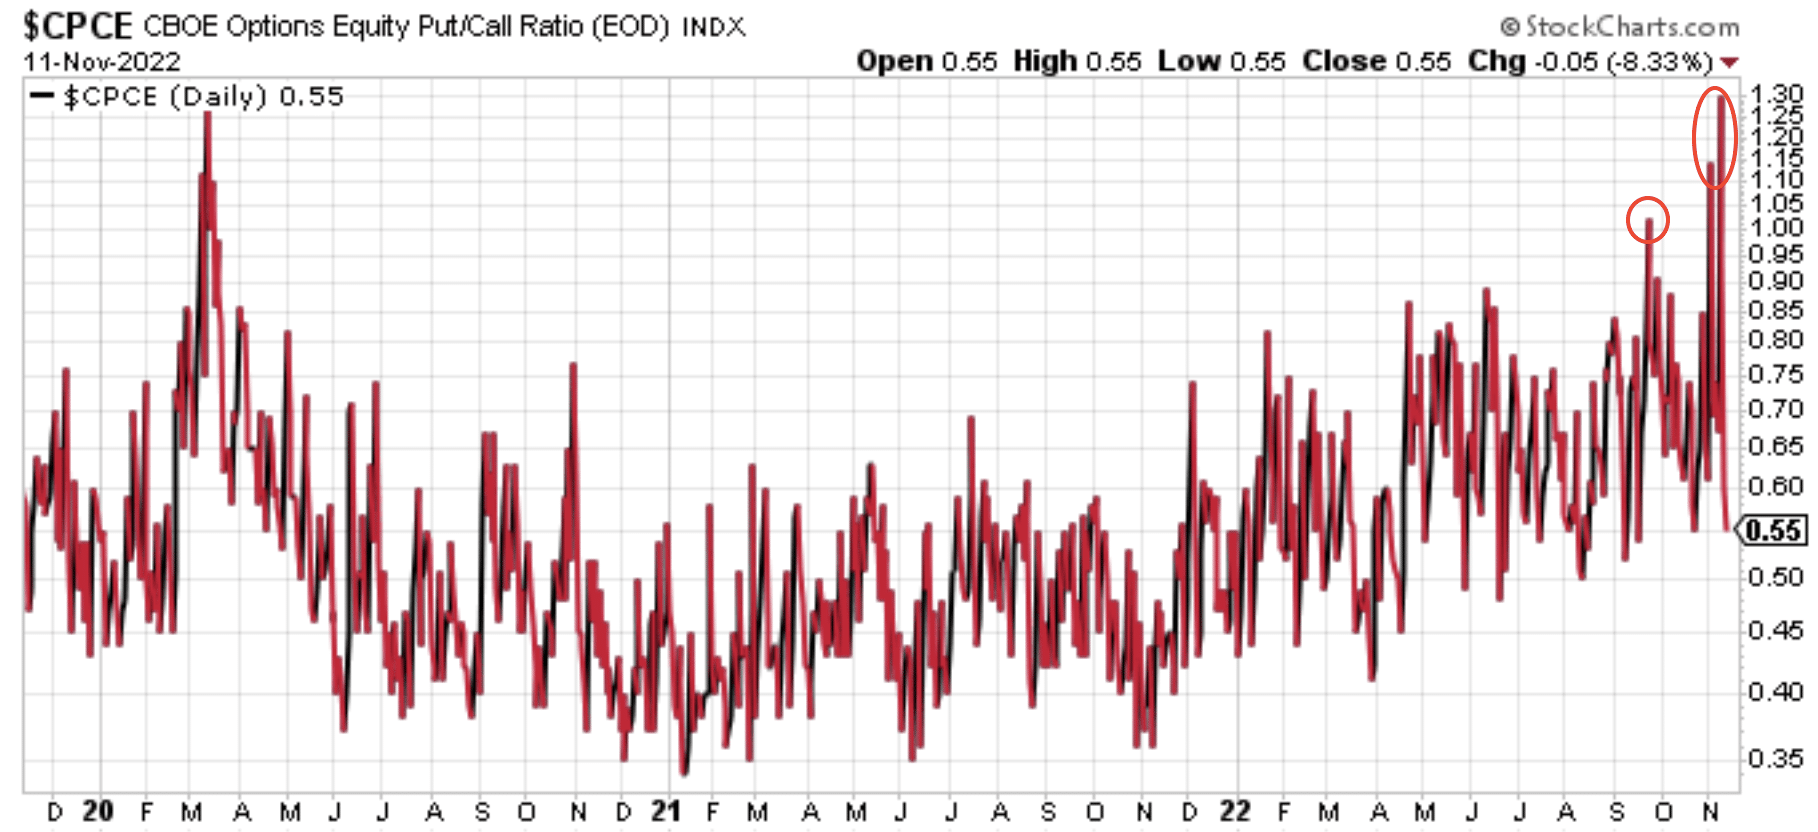
There remains an ample amount of fear in the market today and for fear of the future economy. That fear can be gauged better through market sentiment and via the Put/Call Ratio, rather than just the current VIX regime, which proves a better gauge of volatility than fear. Recall from September that the Put/Call Ratio spiked above 1.0 for the first time since March 2020.
- From inside September 25th Research Report:
- Kind of an eye-opener when looking at the candlesticks and the Put/Call ratio at multi-year highs also. Two things to add with respect to the technicals presently: Investors have grossly deleveraged as the Fed has overshot even the more hawkish expectations since Jackson Hole and investors are aggregiously leveraged to the downside in the market, ie. the tremendous “Put” buying activity outweighing “Call” buying to the greatest degree since the Covid Crash.
- With this in mind, 2 things can be true at the same time: 1) Markets can still go down, and they did, especially considering seasonality and the extremes in Put/Call Ratio 2) Markets can express a massive short squeeze first, or shortly after any more significant downside. The sequence of future price action is always unknown, but augers for a catalyst of consequence.
- The S&P 500 was 3,693 when the Put/Call Ratio signal was taken*. The study above recognizes such historic occurrences when the Put/Call Ratio spikes above 1.0.
- Since then, the S&P 500 fell more than 100 points or nearly 3% to its 2022, bear market lows of 3,585, on a closing basis.
- Nonetheless, after the signal the returns were all positive 3 months later, but drawdowns were also considerable between the signal date and the highly positive returns.
- The broad takeaway here is that, indeed, many investors/traders thought there would be at least one more capitulatory move lower.
The data proves compelling, and since the 1st signal of the calendar year, the market is higher nearly 7 weeks later. What’s even more interesting is that just ahead of the October CPI report (released November 10, 2022), investors/traders were once again hedging at extreme levels as indicated by the Put/Call Ratio achieving the highest level since 2008. Yes, the day before the CPI data was released, the Put/Call Ratio was higher than even the highest reading from March 2020 highs, and only surpassed by the highs during the Great Financial Crisis of 2008.
💎 Update: “I spoke about this to a hedge fund client recently. There’s an ANOMALY in the open interest. The interest rate arb on deep ITM puts is never making it to the OI calc., superficially elevating the reading/s. Hard to ignore and assign the typical forward looking outcomes.”
What has been outlined for much of 2022 is that this bear market and slowing of economic growth is an operation spirited by the Federal Reserve. It’s part of the Fed’s need to contain the wealth effect, as a means to tackling inflation. Nothing new here, and not something that most institutional investors perceive to be feared. Regardless of what we characterize the VIX to be, a volatility index or gauge of fear, it does depict a greater operational objective by markets than a measure of uncertainty about the market and macro-fundamentals. Let’s face it, we all see what is going on here, we all witness the Fed’s actions and rhetoric supporting its actions and/or ongoing efforts to de-risk the economy from embedding inflation at elevated levels. What we have are known knowns, not unknowns or uncertainty. The VIX and SKEW index have been explaining this to us all year long.
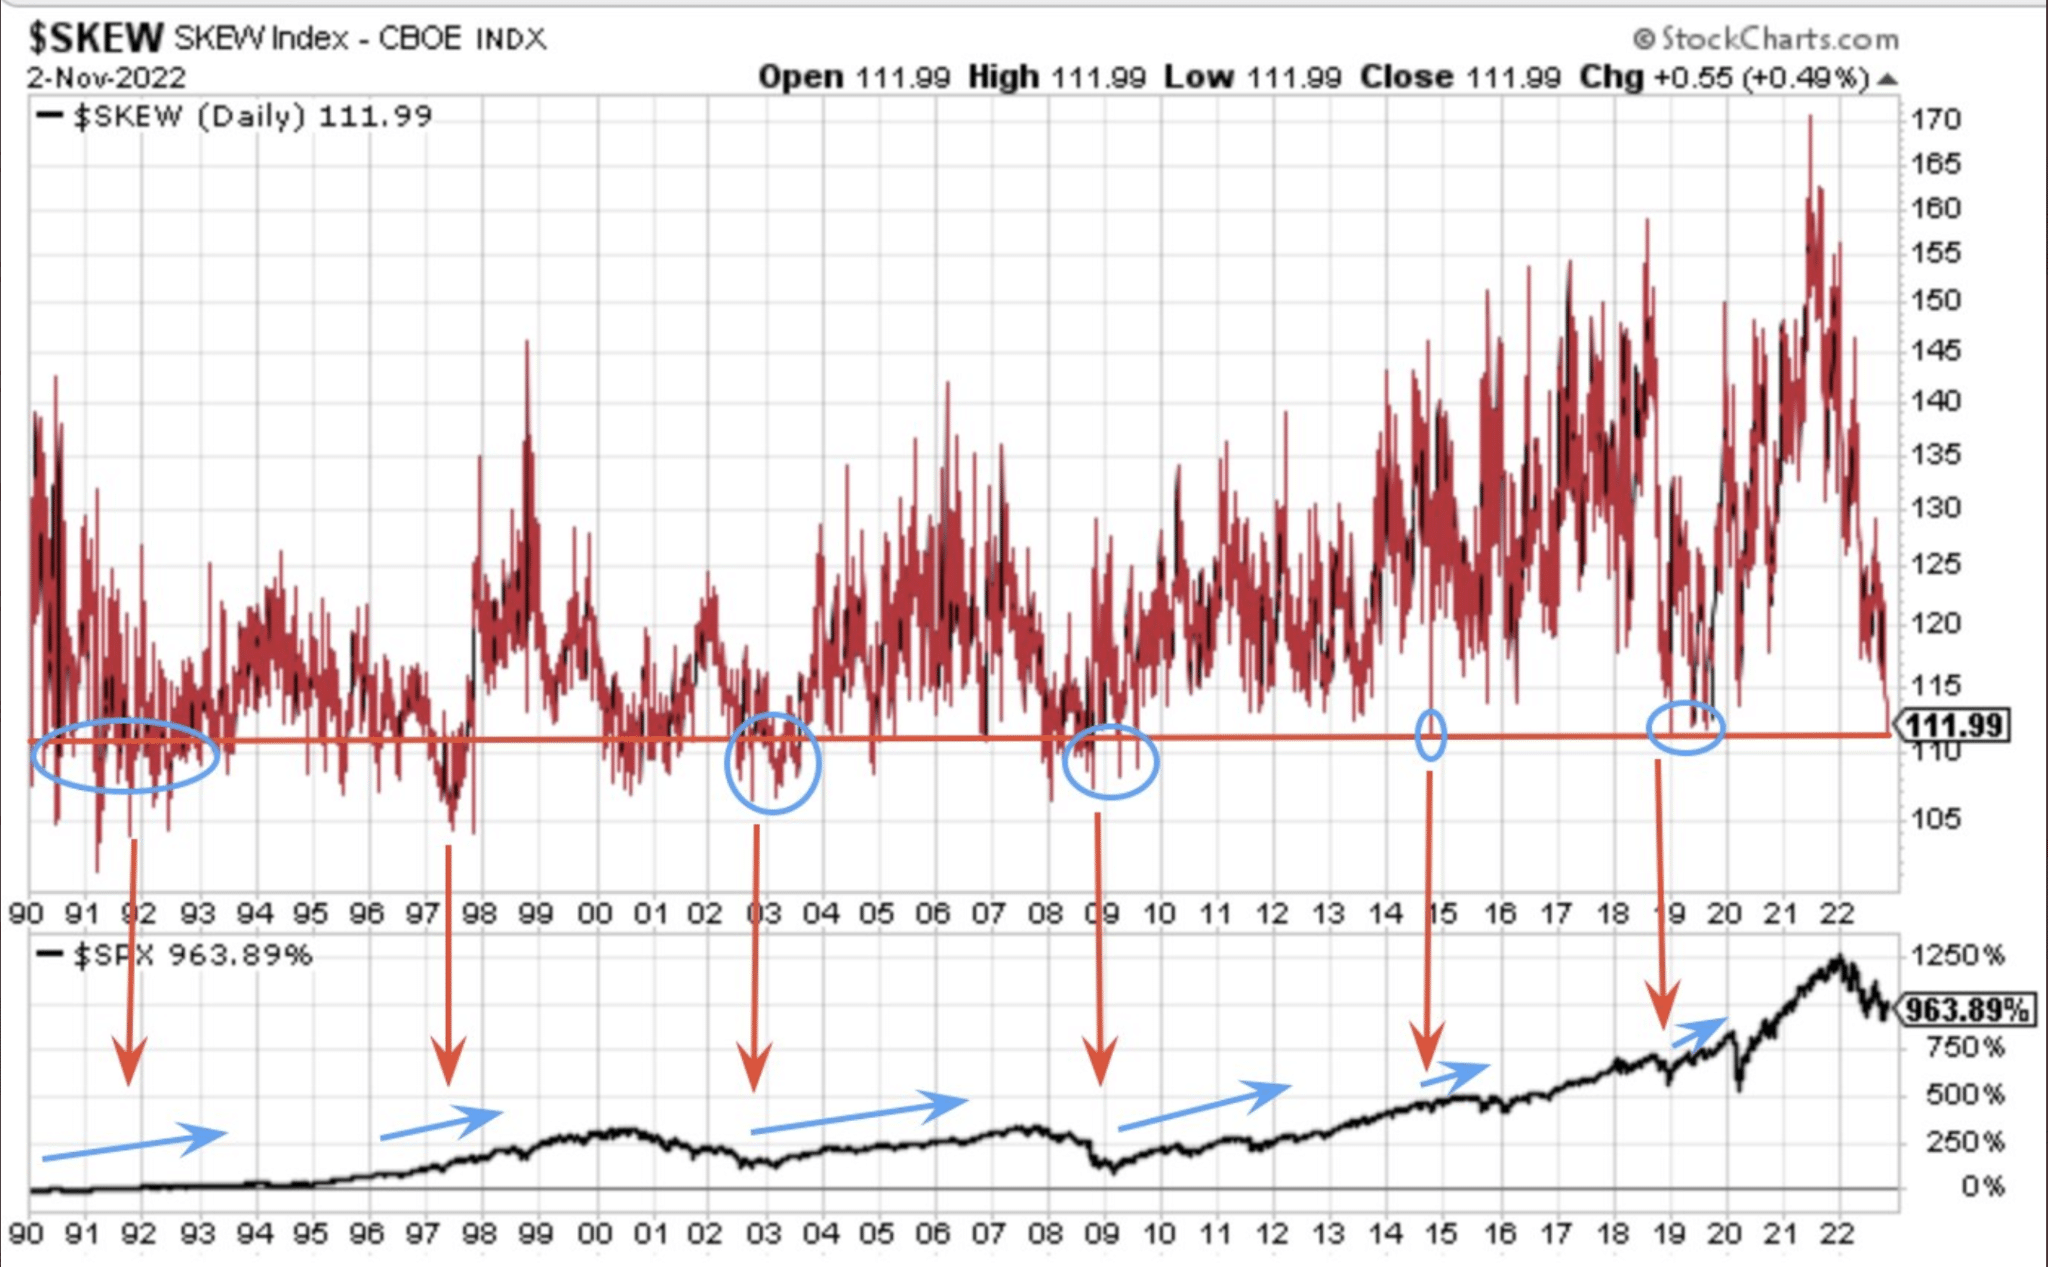
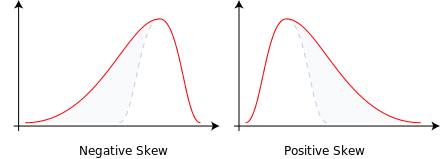
The SKEW Index measures perceived tail-risk in the market. The index specifically measures tail-risk, a change in the price of a stock that puts it far outside the standard bell curve (you can see this in the illustrations below). As you might guess, the probability of a price change at one extreme or another is pretty low – 5% or less, as it’s two standard deviations away from the norm. You will hear folks describe the signal the SKEW index offers in a variety of different ways.
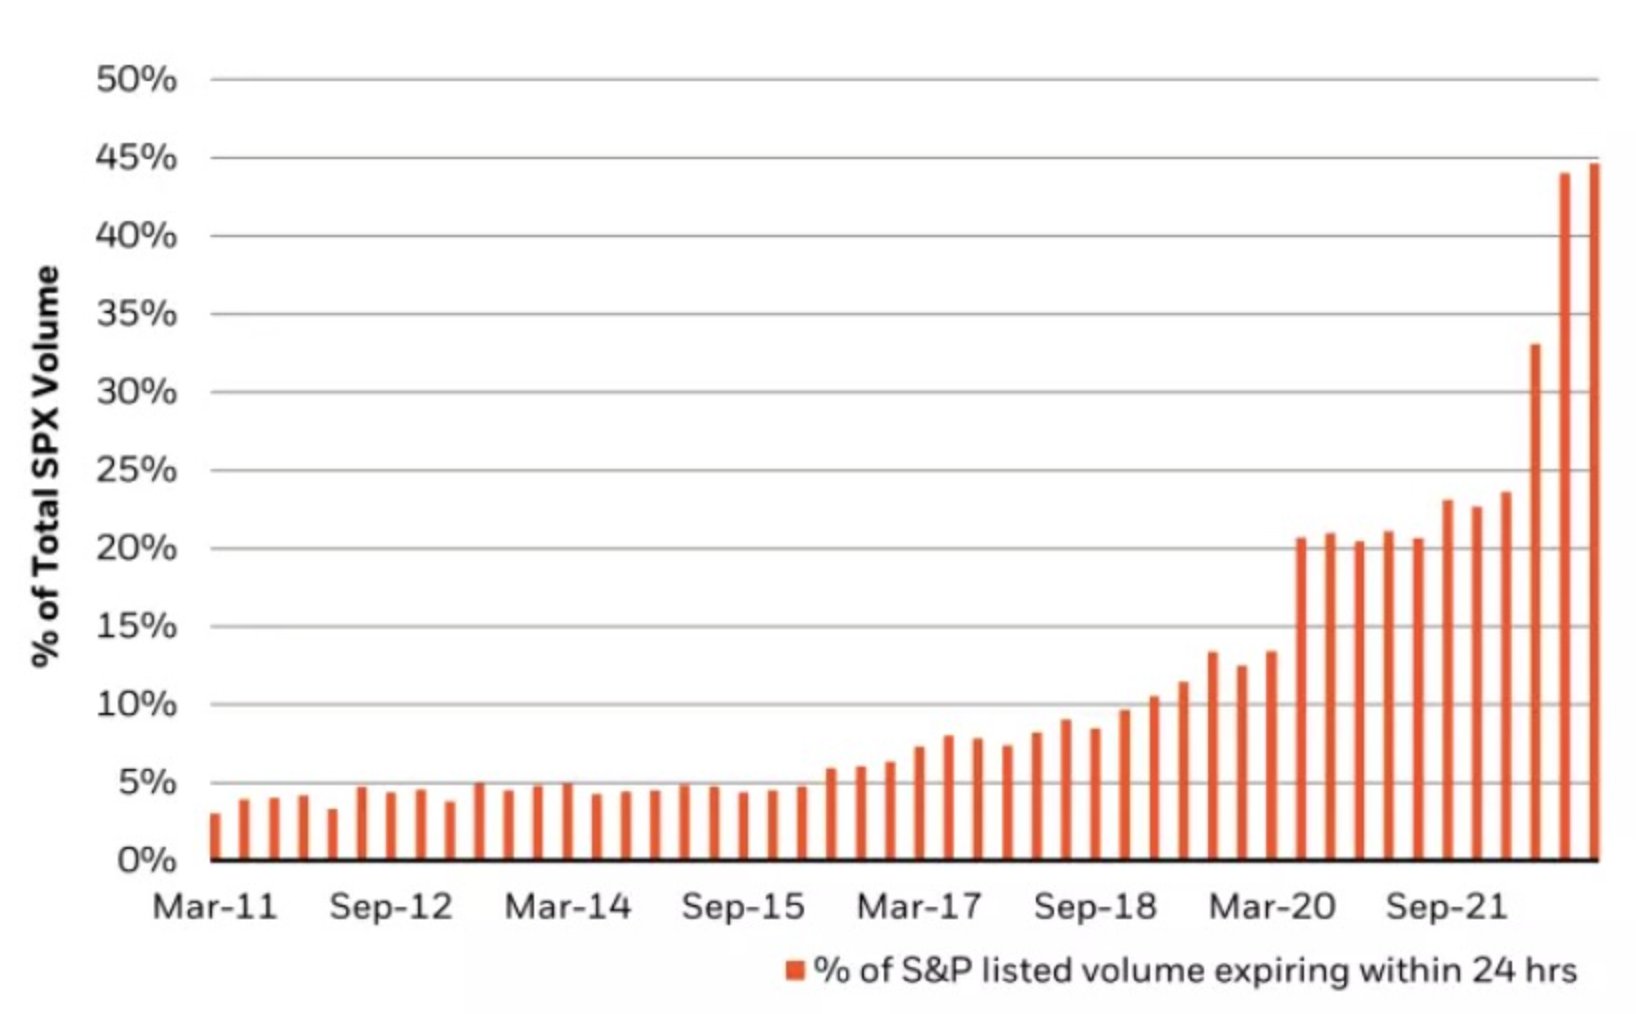
Historically, we can see from the first chart of the SKEW index that when it declines to levels such as it has declined this year, it typically precedes a long runway of positive gains in the market. Additionally, when SKEW has risen to its peaks it has typically preceeded a meaningful correction. In one of the worst drawdowns for a calendar year in history, the SKEW index identifies the potential market moves that are forthcoming, and probably speaks more elequently to the market regime itself. The SKEW index suggests that tail risk or risk ahead are muted, which is likely why investors/traders are more interested in the “risk of today”, and more frequently engaged in buying options with near-term expirations as opposed to options with long-dated expirations, signifying tail risk ahead. Roughly 50% of S&P 500 option contracts traded, to the tune of $300 billion of notional value each day, have 1-day expiries or less. That’s up from 10% of volume in 2019, and less than 5% of volume in all years prior to 2017. At $1trn in notional Puts daily! This has never been seen in history, which informs as to why investors do not believe the current market regime is riddled with tail risk, but rather risk today.
The SKEW index is currently at the lowest level since 2014, and prior to that 2009. This suggests that the market is or has priced-in the worse case scenarios i.e. tail risk. Going back to my original characterization of 2022’s bear market, “… market operation spirited by the Federal Reserve. Nothing new here, and not something that most institutional investors perceive to be feared.”
There’s good news and bad news in most everything we encounter and experience along the journey of an investor’s lifecycle. The good news today, or for the time period, is that there is a seasonal tailwind that favors risk asset returns through April of 2023.
The bad news is that there is always a probability we can assign that the tailwinds won’t prove strong enough to deliver on the higher probability outcomes. Even so, we know the inevitable destination of markets, and should act accordingly. Cast aside the fears of further downside for fears of opportunity risk. And keep in mind what begins come November 19, 2022. Some of you, by way of those chemical synapsis firing already know what kicks-off on this day of the trading year. Others are still forming those chemical synapses and need another reminder/practice round.
I Want A TOY
The TOY Barometer by famous quantitative analysts Wayne Whaley.Wayne Whaley was a quant before quants existed. He has a math background and has been managing money since the late 1980’s. He considers the TOY Barometer to be the single most reliable seasonality barometer of forward stock market returns, so much so that he’s said if he could only make one trade/year based on one indicator, this is the indicator he would use. TOY is an acronym for Turn. Of. Year. The seasonal dates it tracks is from November 19 to January 19 of a new calendar year, hence turn of year.
Whaley’s goal was to identify what he called the “kingpin of seasonal barometers.” He stated:
“I implored my computer to take a few seconds to exhaustively study S&P performance over every time period of the year and determine which time frame’s behavior was proprietor of the highest correlation coefficient relative to the following year’s performance.”
What he found was there was a high correlation between the S&P 500’s returns between November 19th and the following January 19th and the S&P’s performance the 12 months following January 19. And since the 2-month period straddled the turn of the year (TOY) and the gift giving season, hence the TOY Barometer.
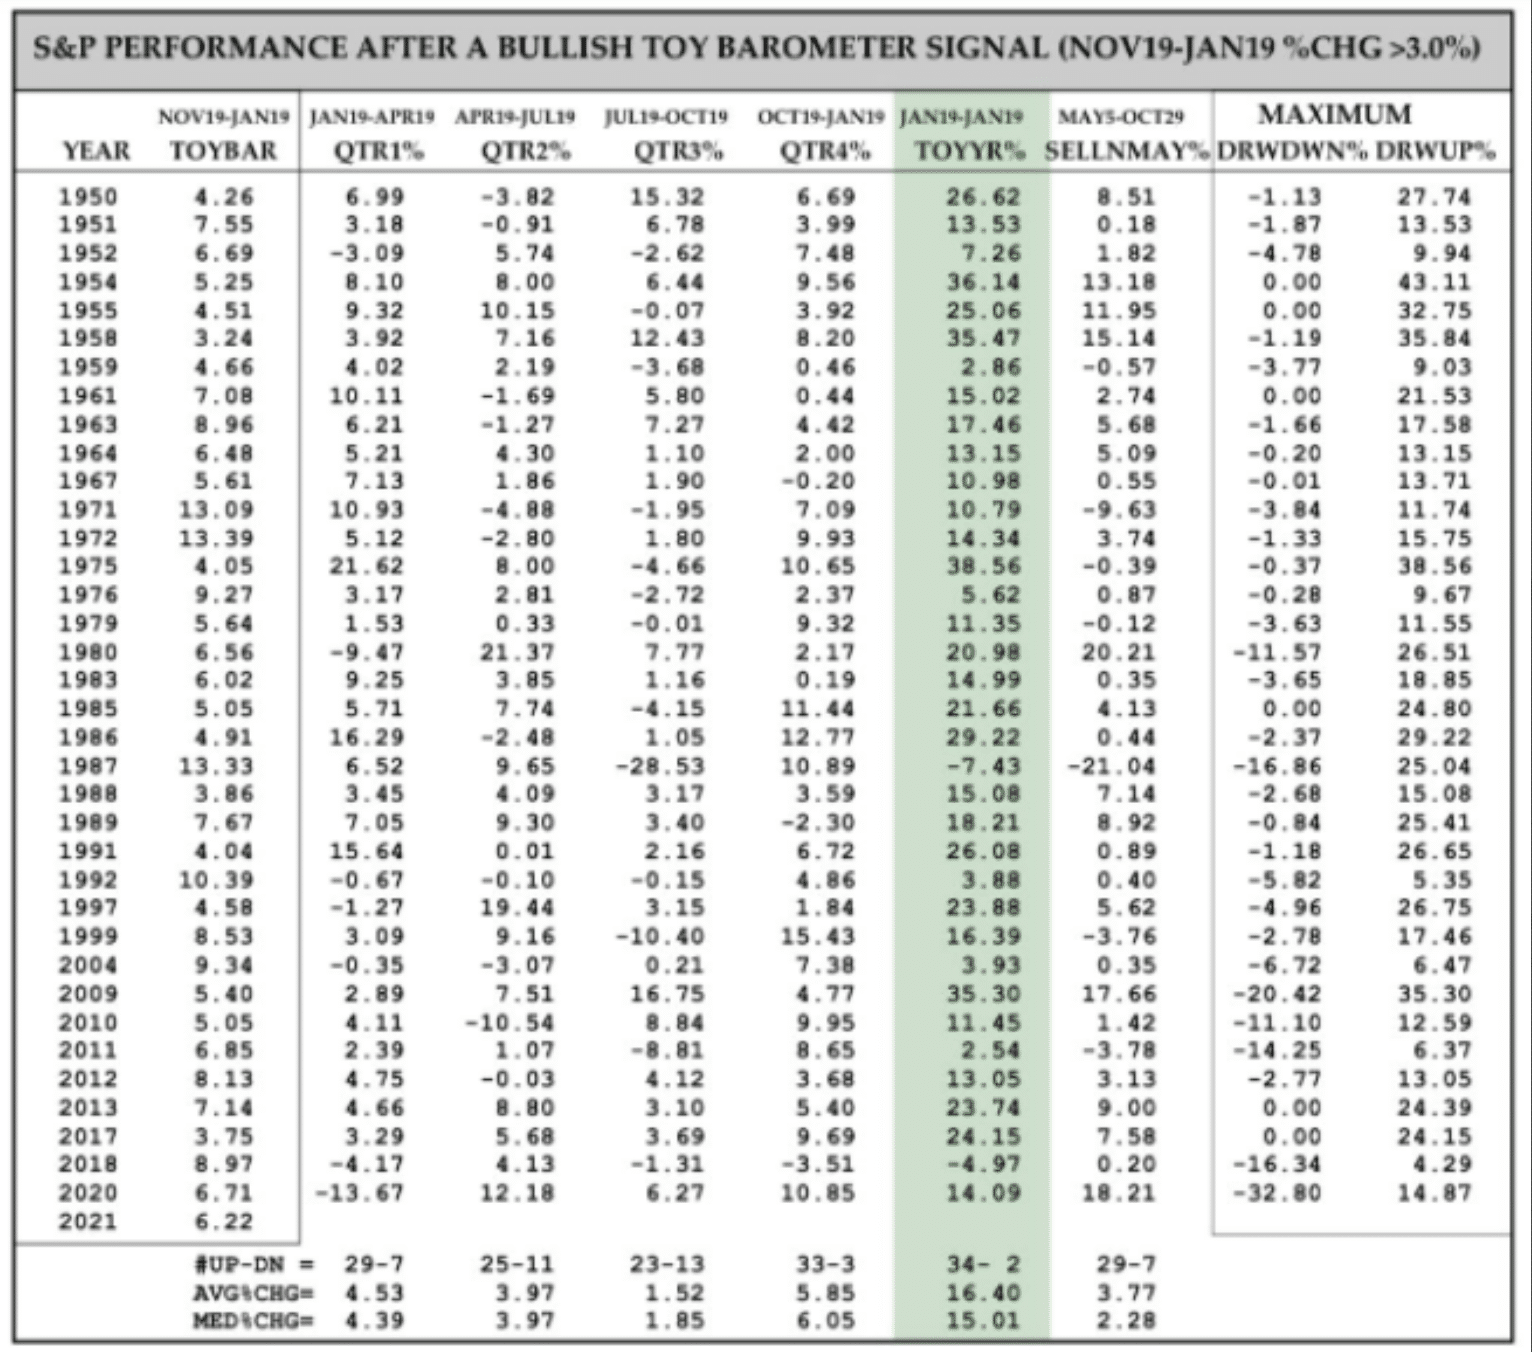
As shown in the table above, the history of the TOY Barometer, the 36 completed bullish signals have led to gains 34 times the following 12 months. The ONLY TWO losses were in 1987, the year of one of the biggest single-day crashes in history, and 2018, the year that included a 20% drop during the fourth quarter and while the Fed was raising rates and performing QT. Both or one of these two Fed operations is likely to end in 2023, which is why the TOY Barometer, as a gauge of future returns, becomes so highly relevant. Additionally, in 1987 and 2018, both years leading up to those failed signals were on the heels of significant gains in prior years, which is not the case for 2022’s start of the TOY Barometer period. Because November 19th falls on a weekend this year, the clock will actually start ticking the following Monday (November 21st). As noted in the TOY Barometer table above, what investors will be tracking is a gain, over the designated time period, of greater than 3 percent.
Cross-Pollination of Asset Classes
With positive price action in the equity market this past week, we know that it happened with positive price action in the bond market and a downturn in yields and the Dollar index. The theme all-year long has been: Dollar and yields up, stock prices down. This past week was no different, no different at all. Yields and the Dollar collapsed, and stock prices went soaring; LIQUIDITY. But is it sustainable? The markets will tell us, of course, but the history of markets can give us a baseline expectation as well. So let us dig our heels in and see what history says ABOUT when yields “BLINK” first. Keep in mind, I am fully of the opinion that the Fed will continue hiking rates through year-end, at the final December 14, 2022 FOMC meeting (25bps – 50bps TBD).
Many market participants today are solely aligning the Fed’s rate hiking regime with that of 1981-1982 and the mid-1970s inflationary cycles. But what they are committing to by doing so is eliminating other rate hiking cycles that didn’t coincide with these fights against inflation. Take for example the rate hike regime that came shortly after 1982.

In the 1980s economic recovery, bond yields started to rise in 1983, and the Fed regularly boosted the federal funds rate in early 1984. The chart above from Leuthold Group compares the 10-year Treasury yield (green line), the Fed’s target funds rate (red line), and the S&P 500 index (blue line) through the 1984 tightening cycle. By the time the Fed began hiking rates in March 1984, the stock market was already off by 10.5%, and it declined only another 4% to its ultimate low by June when the 10-Year yield topped out. The stock market bottomed nearly coincident with the bond yield peak, even though the Fed kept lifting the Federal Funds Rate until October. Moreover, once the bond yield reached its cycle high (i.e., the bond market blinked), the S&P 500 bottomed and proceeded to rally even before the Fed quit raising rates. I repeat, bond yeilds blinked first, S&P 500 bottomed, and even with the Fed still hiking rates. Now let’s look at another similar situation in the mid-1990s, outlined by The Leuthold Group:
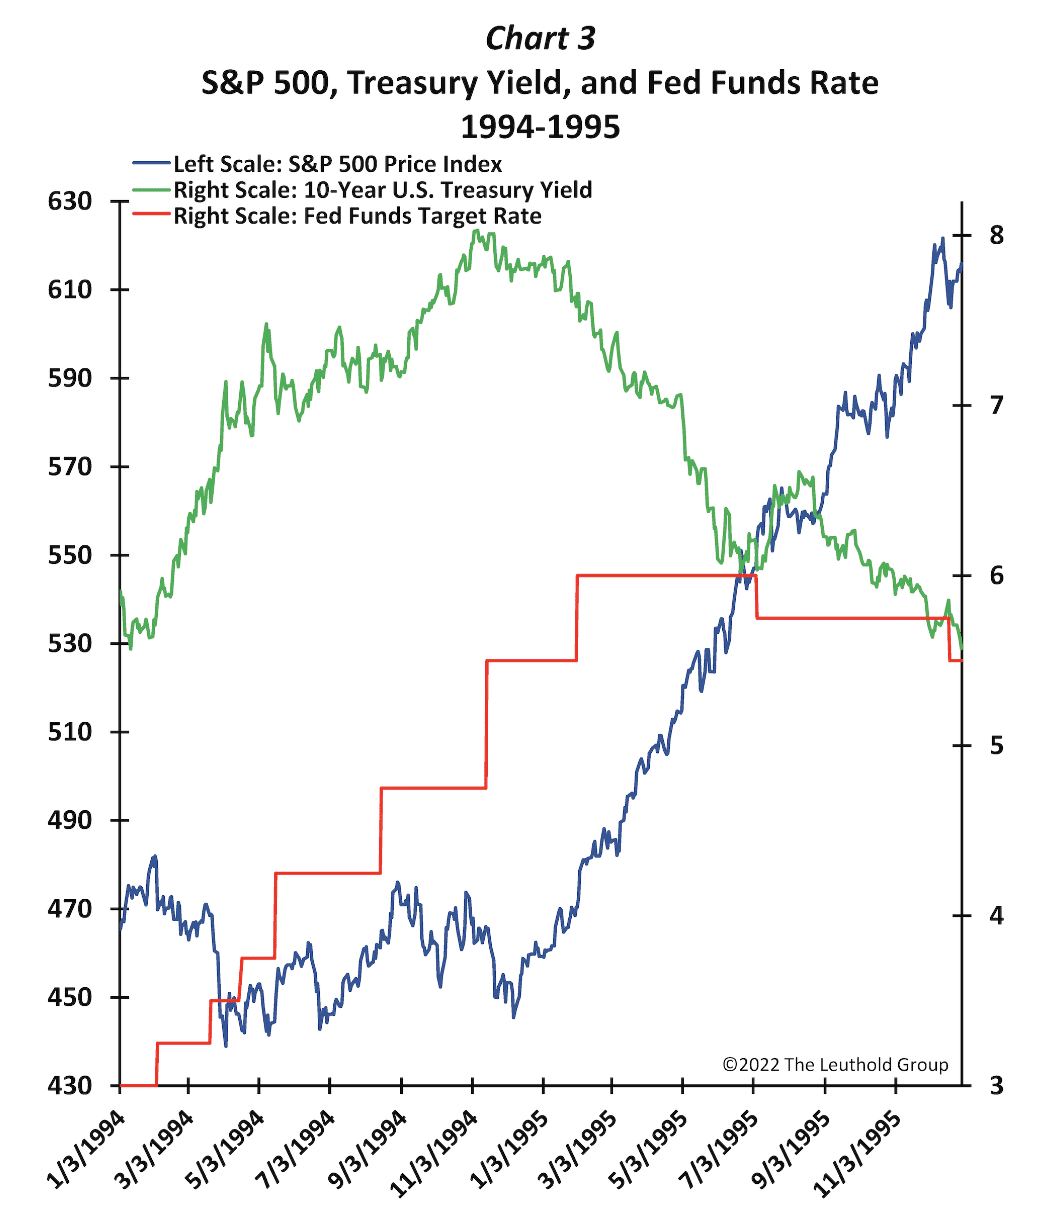
The chart above illustrates the 1994 tightening cycle leading to the mid-cycle slowdown in 1995. The 10-Year yield hit a floor in October 1993, and the Fed began increasing the funds rate in February 1994. In that case, the S&P 500 corrected about 10% by April 1994 and remained near its lows until the 10-year yield blinked (peaked) in NOVEMBER of 1994. Sounds familiar, eh? Then, despite the Fed continuing to raise the funds rate until February 1995, and refusing to lower it until July 1995, the stock market nonetheless bottomed in early December 1994 and, in tandem with bond prices, sustained its rise higher during the first half of 1995 long before the Fed again started easing. Should stock investors wait for the Fed to stop raising rates, or for the bond market to BLINK first? I think the answer is pretty clear based on the 2 examples offered. Here’s one more example that’s a little bit different, but with a quick correction of the difference as I’ll explain. Please read through this example a couple times if needed, because I’m of the opinion that this example is what the August – September S&P 500 lows were outlining to the Federal Reserve.
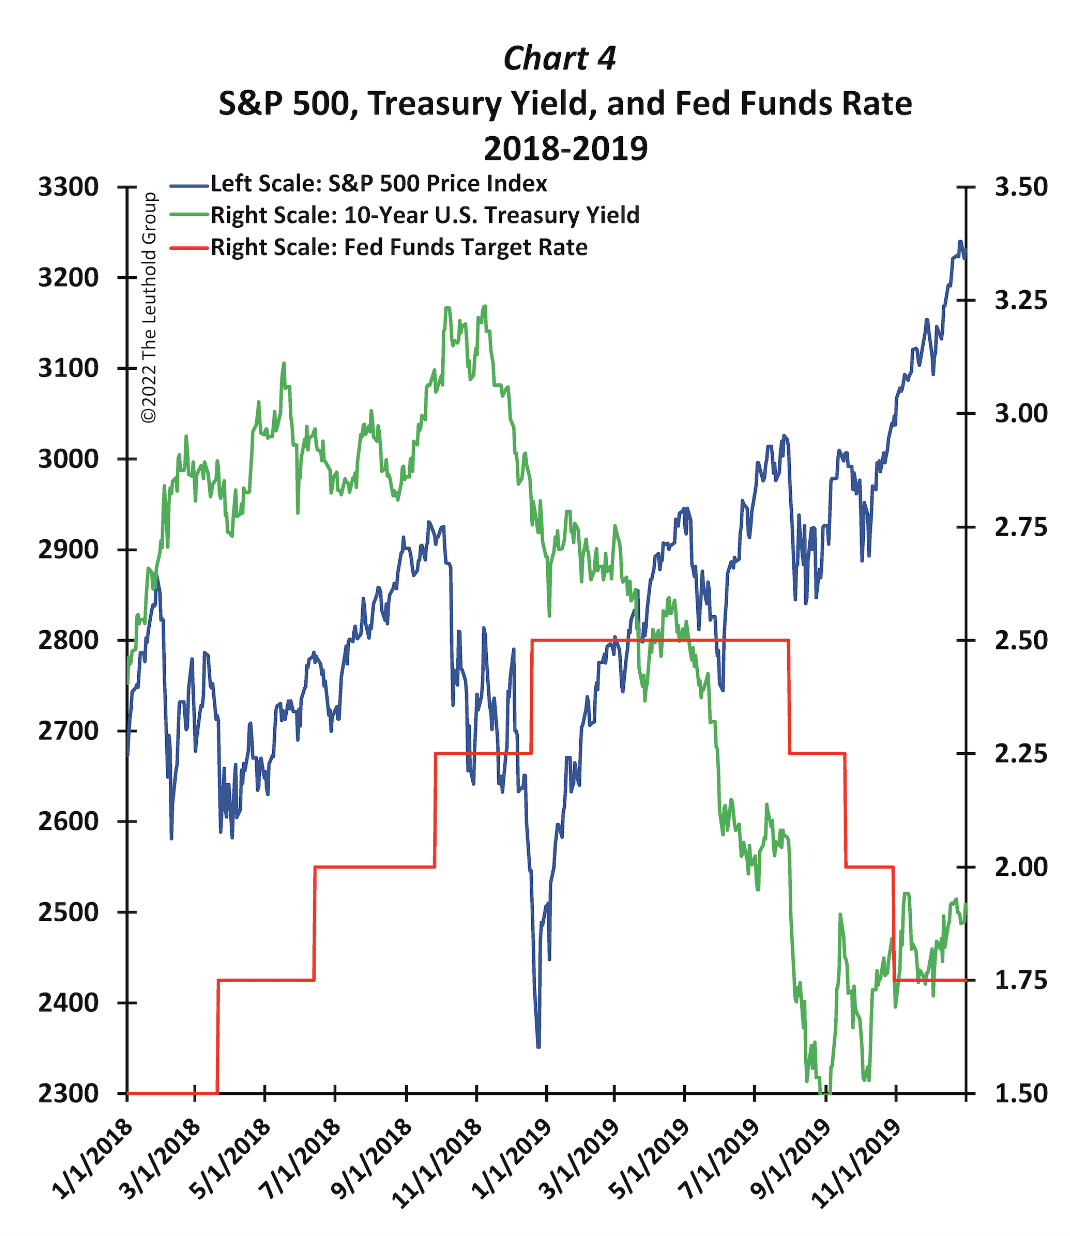
In 2018-2019, the 10-Year bond yield peaked in early November 2018, but unlike the other examples, following that top, the S&P 500 collapsed another 10-15% in less than a month. And, after the Fed’s last rate hike on December 20th, the stock-market low was marked just a few days later. However, the shocking and sharp loss in the stock market that year was fully regained by early February 2019. The S&P 500 climbed to a record high as the Treasury yield fell persistently, even though the Fed did not pull back the funds rate until July 2019. So no, the market doesn’t need the Fed to cut rates to bottom or go higher. Overall, the bond market again BLINKED first, and yields declined long before the Federal Funds Rate was eventually lowered. This is another way of also exampling that the Fed’s “higher for longer” mantra, as it pertains to the Federal Funds Rate, does not mean bond yields cannot or will not go lower, as they have in the past. In the 2018-2019 example, although the stock market briefly slumped after the initial bond blink, the 10-year yield still gave a successful buy signal for stocks; one simply had to extend their time horizon another month.
Recall that in June, the 10-Year yield began its initial descent, when we also recognized that many inflation metrics had started their descent. Today, we can confirm that the peak of the inflation cycle was June 2022, and with the CPI reaching 9.1 percent. The bond market was right!
Today, this can be recognized as the first and most proper bond yield BLINK for the current period, and possibly from where the Fed’s overtightening began. I would now hold the opinion that the market’s lower-lows since September and more capitulatory price action since then, as recognized by recent J.P. Morgan data, was a message from the markets to the Federal Reserve: “Hey guys, JOB DONE!” If this analysis is accurate, the drop in bond yields and the Dollar Index coupled with simultaneous rise in equity indices is the prominent and decisive bond BLINK of the period. In the previous bond blink examples above, we still anticpate the Fed to raise rates, but believe the Fed now recognizes JOB DONE! Furthermore, I also still believe the Fed will “talk tough” to contain the wealth effect to one degree or another into Q1 2023. We think this could be measured by the S&P 500 holding resistance around 4,000 – 4,100 and a base around 3,700.
From a tactical perspective, and taking into consideration the macro-fundamentals, I think it is plausible that the November and December Nonfarm Payroll reports shows more meaningful slowing in the labor market/job creation. Given the litany of high profile hiring freezes and layoffs in recent weeks, I am holding the opinion that this more prominantly plays out with a signficant slowdown in job growth for the soon to be released November and/or December Nonfarm Payroll reporting cycle. IF this materializes in December, and ahead of both the final CPI and FOMC meeting of 2022, it may play out as follows:
- Recall that the hotter than expected September CPI data (released October 13, 2022) was met with initial fear and a 2%+ gap down at the open of trading. Markets then rallied from sub 3,500 and finished the day higher. The bullish outside reversal day may have cemented the lows and the ultimate peak for the terminal Fed Funds Rate.
- If the release of the November Nonfarm Payroll report does show meaningful slowing of job creation, we think the market has the oppposite reaction as on October 13, 2022. Market initially rejoices with futures moving significantly higher and a gap higher at the open on the premise that the Fed’s job is DONE! However, overheated conditions may produce an interim top and find markets giving up the gains and declining on the day.
- We would look to the bond market for confirmatio that the Fed’s job is DONE! If bond yields do move lower, in spite of the weak labor market report, it would suggest that investors have pivoted from a fear of inflation to a fear of a recession.
- On the surface, this does sound less optimistic, but it confirms the pivot or pause from the Fed ahead, which would ultimately bring liquidity back to markets and drive risk asset prices higher inevitably even if not immediately.
- Seasonal/Scheduled fund flows would resume thereafter.
Lastly, but certainly not least, King Dollar! It’s been painfully clear all year long, emphasized throughout earnings season and within corporate guidance, and headlined as a headwind for future earnings growth; the all-mighty Dollar. Like the break in bond yields this past week, a similar breakdown in the Dollar Index occurred. (see chart below)
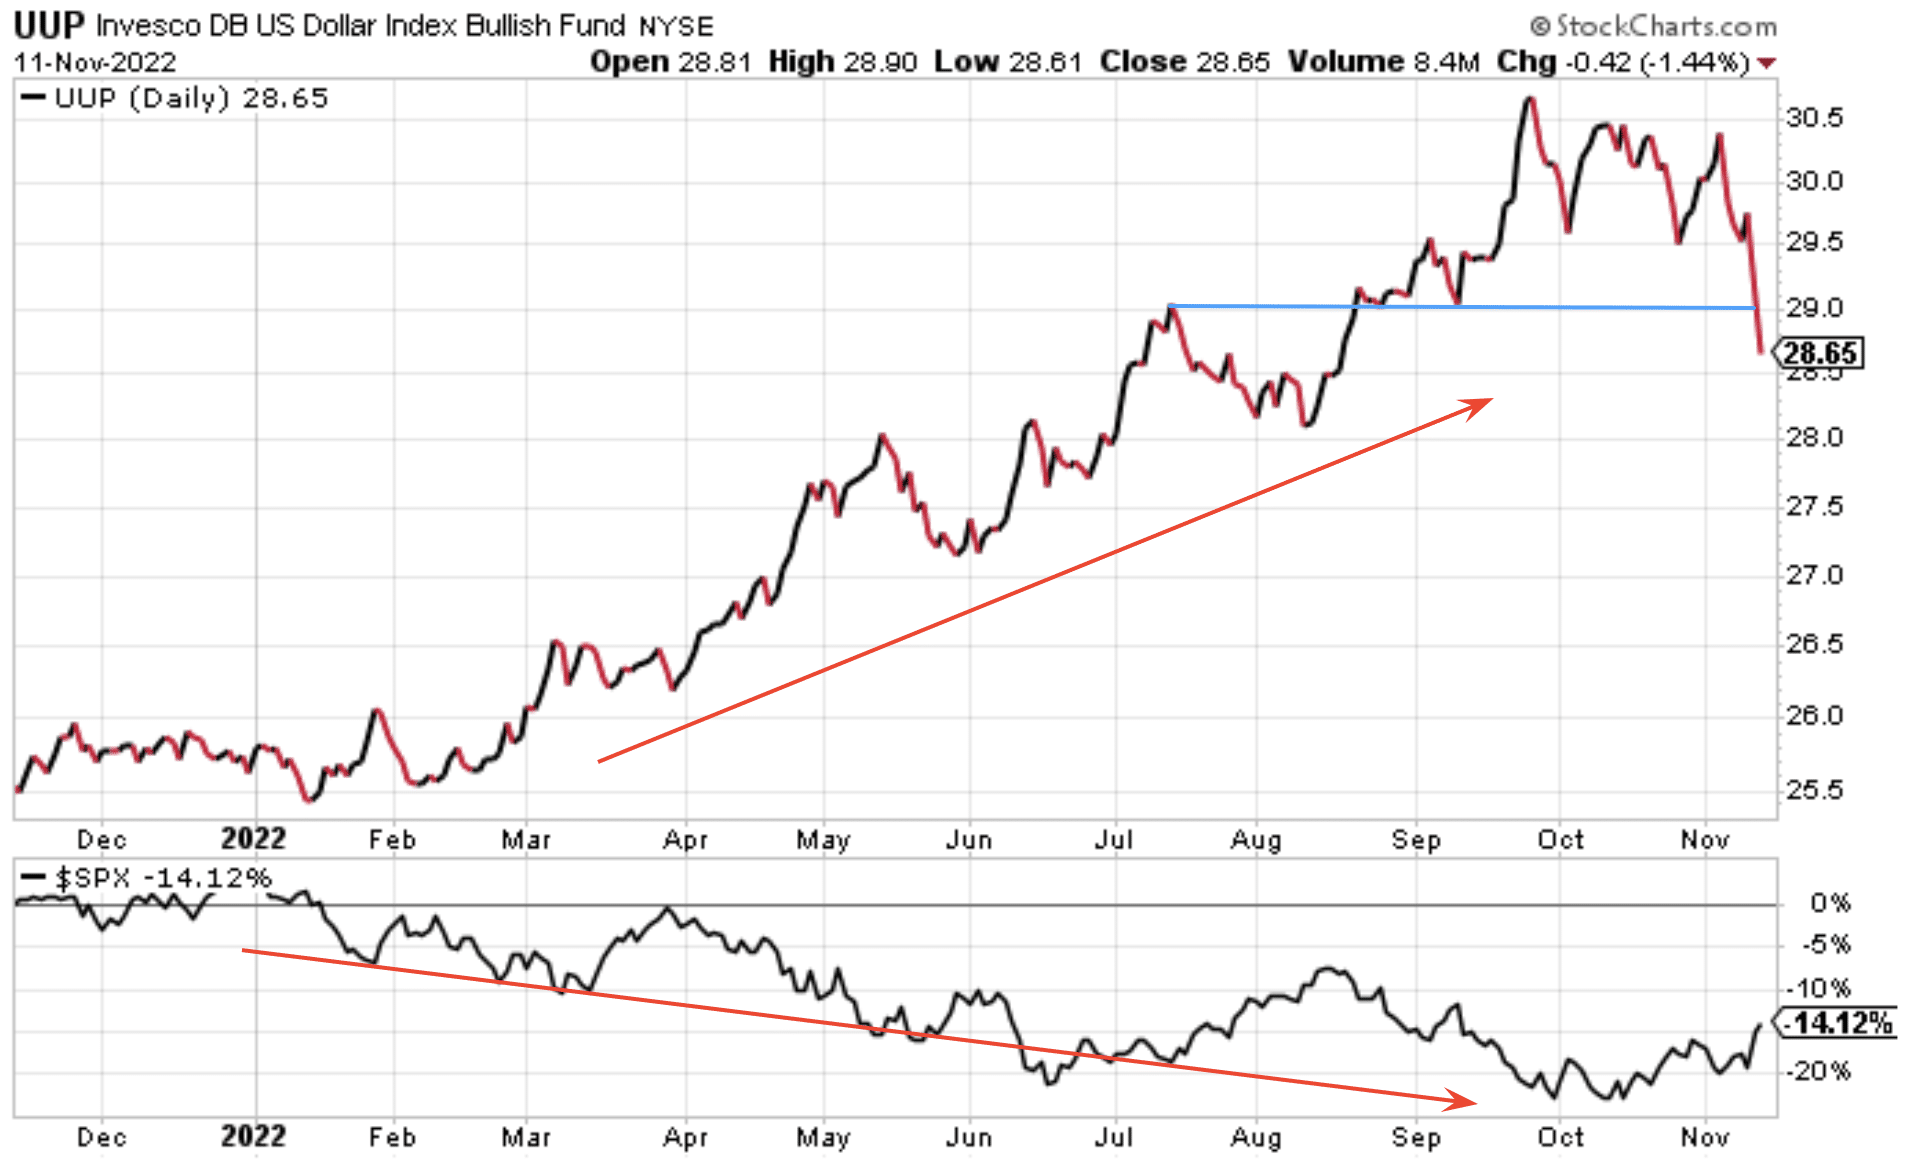
Stocks have struggled, especially Growth stocks, in the face of a rising Dollar. We’ve suggested in the past that this was highly unlikely to persist into and through 2023. Headwinds become tailwinds, and when the Dollar index breaks its uptrend it would prove a tailwind for future earnings. As shown in the chart above (top panel), the Dollar has broken its uptrend in a severe manner. While I wouldn’t suggest it will go down in a straight line from here, I would feel comfortable suggesting the top is in for the Dollar Index, barring any exogneous event. If recessionary conditions are the feared bullishness for a sustained uptrend in the Dollar Index after finding support, Finom Group remains of the opinion that a mild and short-lived recession would likely exonerate a sustained uptrend for the Dollar Index. While we can’t predict a recession’s duration or its magnitude, we are of the opinion the highest probability remains a short and shallow recession, should one arrive.
We continue to recognize that, as it pertains to recession calls, this seems more centered on the stock market’s price action. As the market goes ⬆️, calls for a recession are pushed out in time. An example of this comes from Wells Fargo, who had initially forecast a recession starting Q4 of the current year, then pushed it out to Q1 of 2023 and now…
WELLS FARGO: “.. we have pushed the timing of the eventual recession to the second half of next year, and we now look for the FOMC to raise the fed funds to a slightly higher terminal rate and to keep it there for longer than we expected previously.”
Investor Takeaways
Some of the more bearish analysts and Wall Street firms are now recognizing that the worst of the inflation and combative rate hike regime are likely in the rear-view window. We can’t say for sure that a recession won’t devolve from the overtightening of monetary policy. As such, it wouldn’t be prudent to suggest the ultimate low for the bear market cycle is in the rear-view mirror. Investors would be wise to remain open-minded throughout the early innings of 2023 and with attention paid to the TOY Barometer, amongst other technical patterns going forward. Still need an S&P 500 to reclaim its 200-DMA with supporting breadth in order to reclaim the uptrend and cement a new bull market.
In tandem, we have to recognize and be cognizant of the fact that the housing market damage and yield curve inversions hold consequential outcomes if they don’t recover more quickly and/or before consumption in the broader economy inflects lower. Finom Group believes that the Fed can still thread the needle and produce a “soft landing”. A soft landing can mean a short and shallow recession by the way, which may be what the “doctor orders.”
There are a great many smart and experienced voices out there for investors to latch onto in this Information Technology era. Investors do not need to have all the answers, because even if we had them it wouldn’t change the volatility of markets. The analysis from the likes of Morgan Stanley’s Mike Wilson or Bank of America’s Michael Hartnett, or anybody considering a lower-low may lay ahead in 2023, more prominantly promotes the potential potholes and volaitlity, but fails to generate confidence in the inevitable destination.
As mentioned in previous weeks, the savvy investor recognizes the higher probabilities within the Sweet Spot, and will utilize the potholes for low-cost acquisitions and future compounding gains. I think the markets have sent the Fed the appropriate message during the late Q3 and early Q4 period. Now, we think the tide is shifting and headwinds are turning into tailwinds. We think the Fed has plenty of tailwinds working in its favor as well, and will only bolster those tailwinds with an additional and potential last hike in December. Tackling inflation is job #1️⃣. Job #2️⃣ will be addressing the tightness that persists in the labor market. The chronology is ideal for achieving any sort of soft landing, as the labor market tightness is coming from extreme, historic levels and lends a goodly cushion for the Fed to land the economic plane. As it inevitably loosens/weakens, the Fed has ample tools to address this lesser consequential issue of the day, should the labor market demand it do so.
With that, we’ll wrap this week’s Research Report with a few notes from Fundstrat’s Tom Lee and Larry Williams:
“The stock market has considerable upside potential into year-end after October’s “game changer” CPI report. Three drivers behind the soft October CPI report, which we believe are “repeatable” for next month’s CPI release. Those include shelter prices showing a meaningful slowing in month-over-month CPI, from a high of 0.8% in September to 0.6% in October. That suggests housing data is “trending towards market reality of deflation. Medical health insurance and durable goods also saw significant declines, driven in part by tough year-over-year comparables and a steady decline in used car prices. There are building drivers to massively slow CPI core inflation over the few months and it is possible we will see three to four consecutive months of +0.3% Core CPI month-over-month. That would pull down core inflation to 3.5%, nearly half of the 6.5% reading seen in most of 2022.”
Lee believes a pause in rate hikes is imminent, which would counter the recent hawkish rhetoric from Fed members.
“For most of 2022, Fed has not been able to point to measurable progress on containing inflation but a significant constellation of leading indicators showed deflation/soft inflation was in the pipeline. October CPI is the first month the ‘hard’ data syncs with the ‘soft’ data.
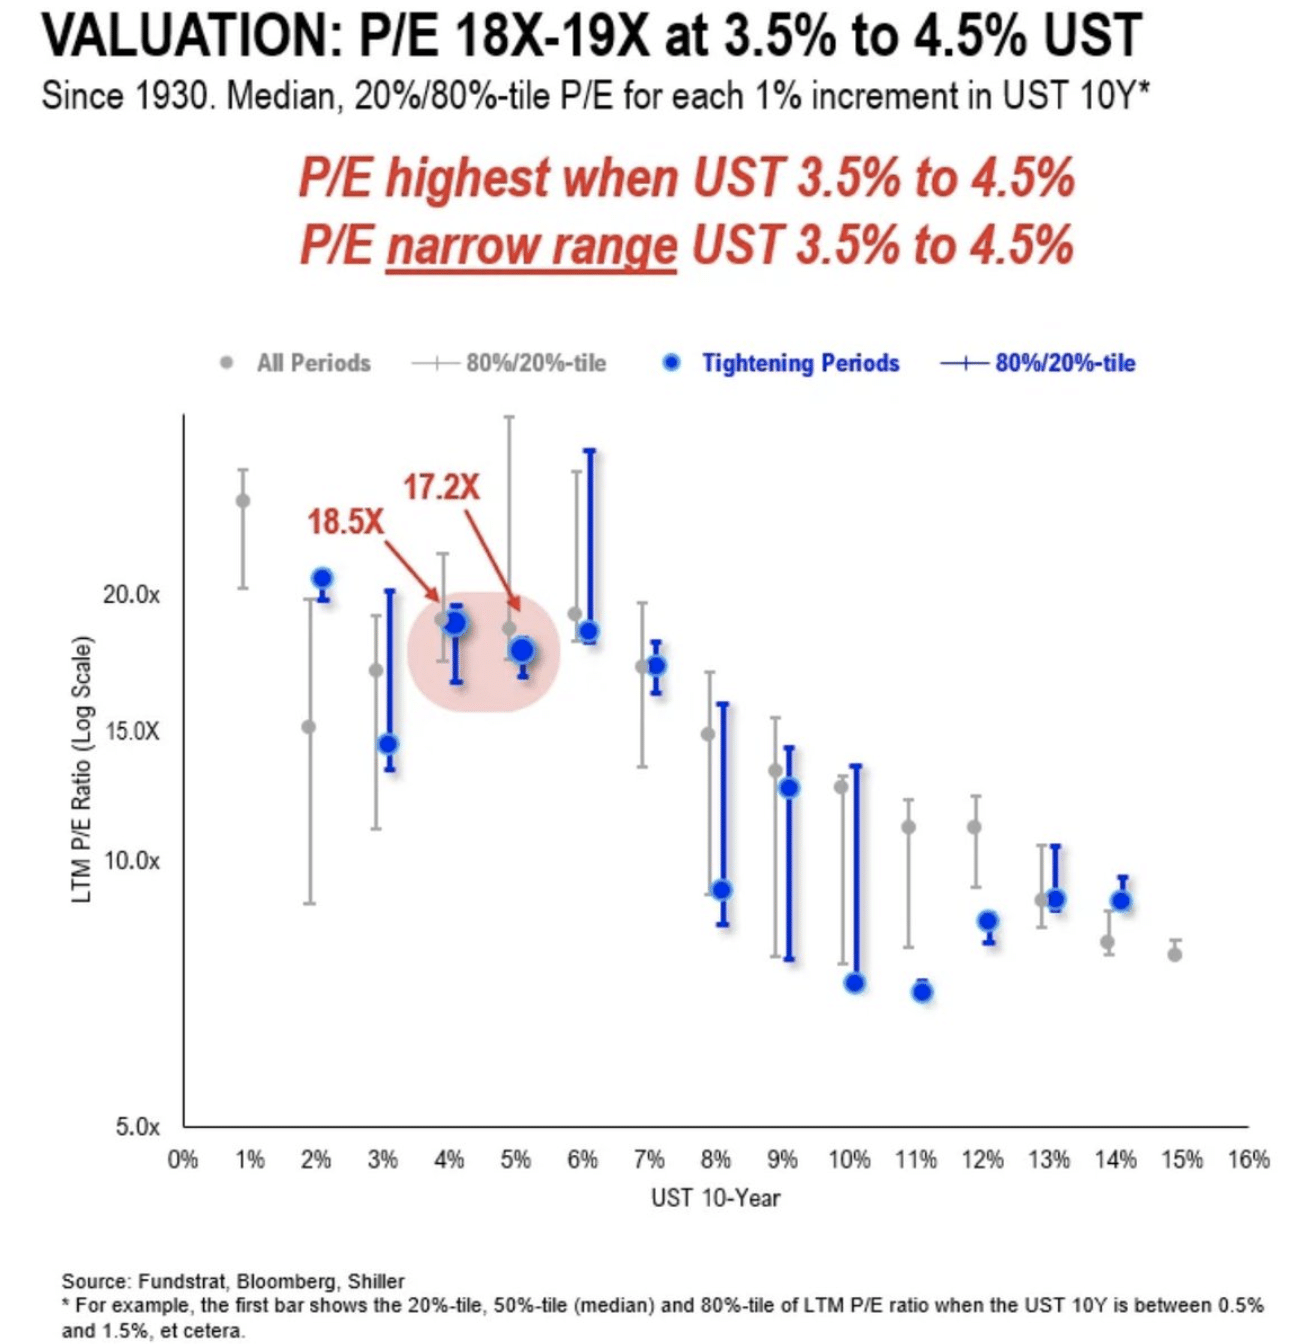
“Since 1871, the average price-to-earnings ratio when the 10-year yield was 3.5%-5.5% is 19x. The forward and trailing P/E ratio for the S&P 500 is 16.1x and 17.8x, respectively, as of November 4. That suggests further room to run. Valuation nor earnings constrain stocks, if inflation has bottomed.”
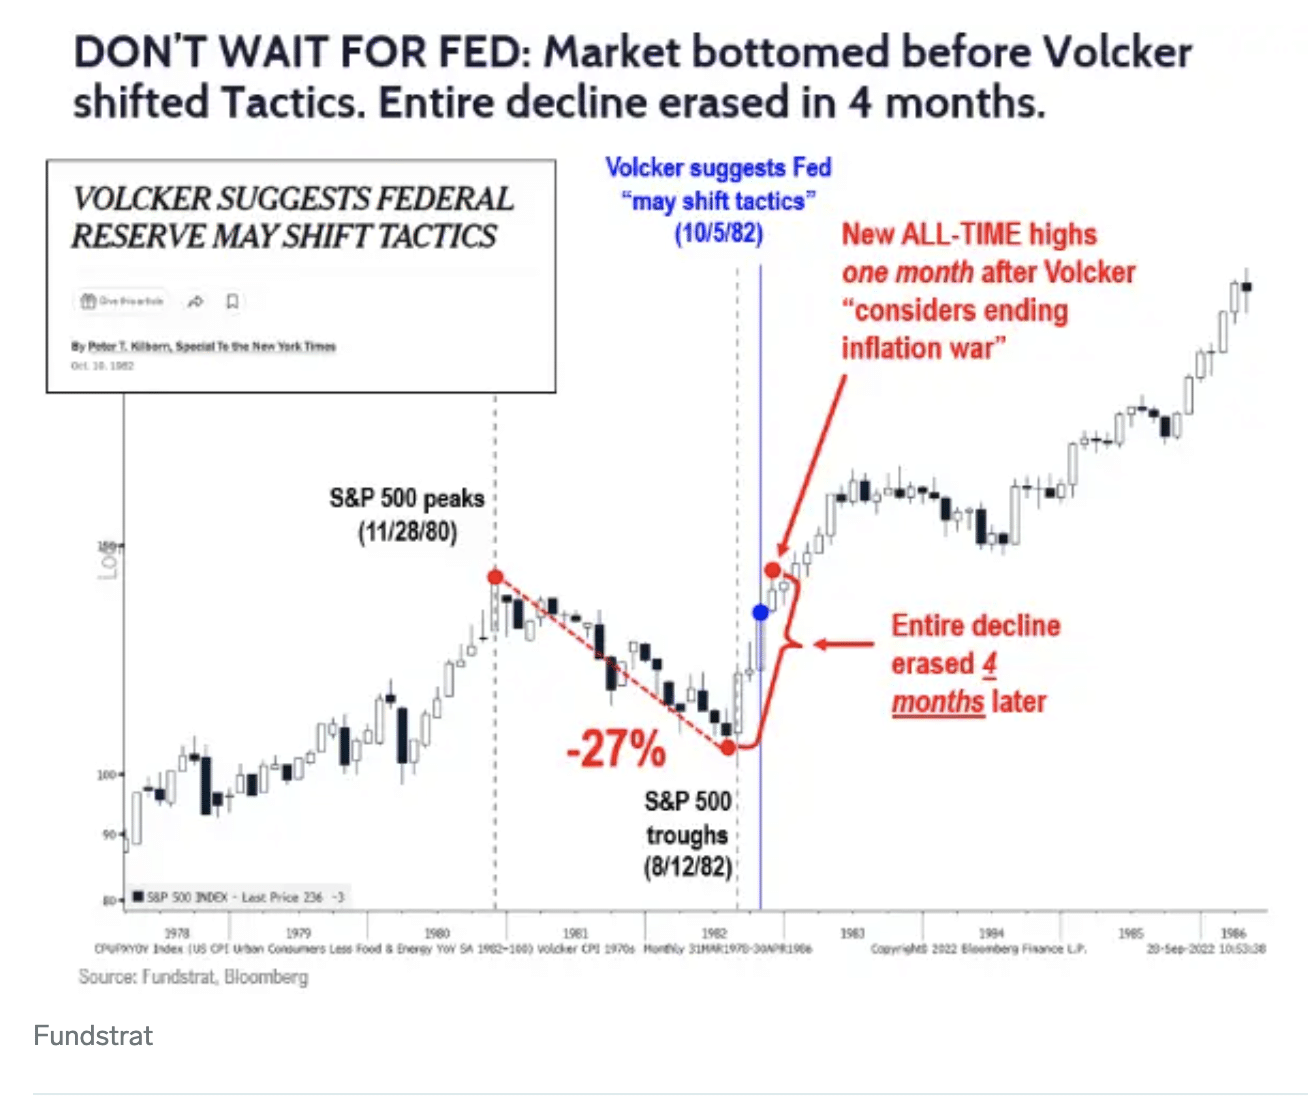
“Recall, in 1982, following the final low in August 1982, the S&P 500 reached a new all-time high within 4 months, erasing entire 27-month bear market. That was a vertical rally. While the Fed likely hasn’t vanquished inflation yet, the stock market is forward looking and has previously “sniffed” out the end of inflation months before it happened in 1982.”
To be clear, Fundstrat’s Tom Lee has underwhelmed with his year-to-date analysis. Having said that, the reporting data lags in CPI could not be more pronounced in the recent inflation regime that did not exist in the 1970s or 1980s, as the CPI calculation was readjusted after the turn of the century. Given this dynamic, it’s more understandable that the bullish Tom Lee and other notable bulls have underwhelmed with their prognostocations in 2022. Having said that, we’ve clear evidence that if the tide hasn’t turned, based on the data, this would demand a policy error by the Federal Reserve going forward. A December rate hike would not constitute a policy error, but a failure to pause and analyze the impact of the existing rate hikes working through the economy in Q1 2023 definitely would rank up there as a policy error. We think the Fed, however, is smarter than the Fed pundits.
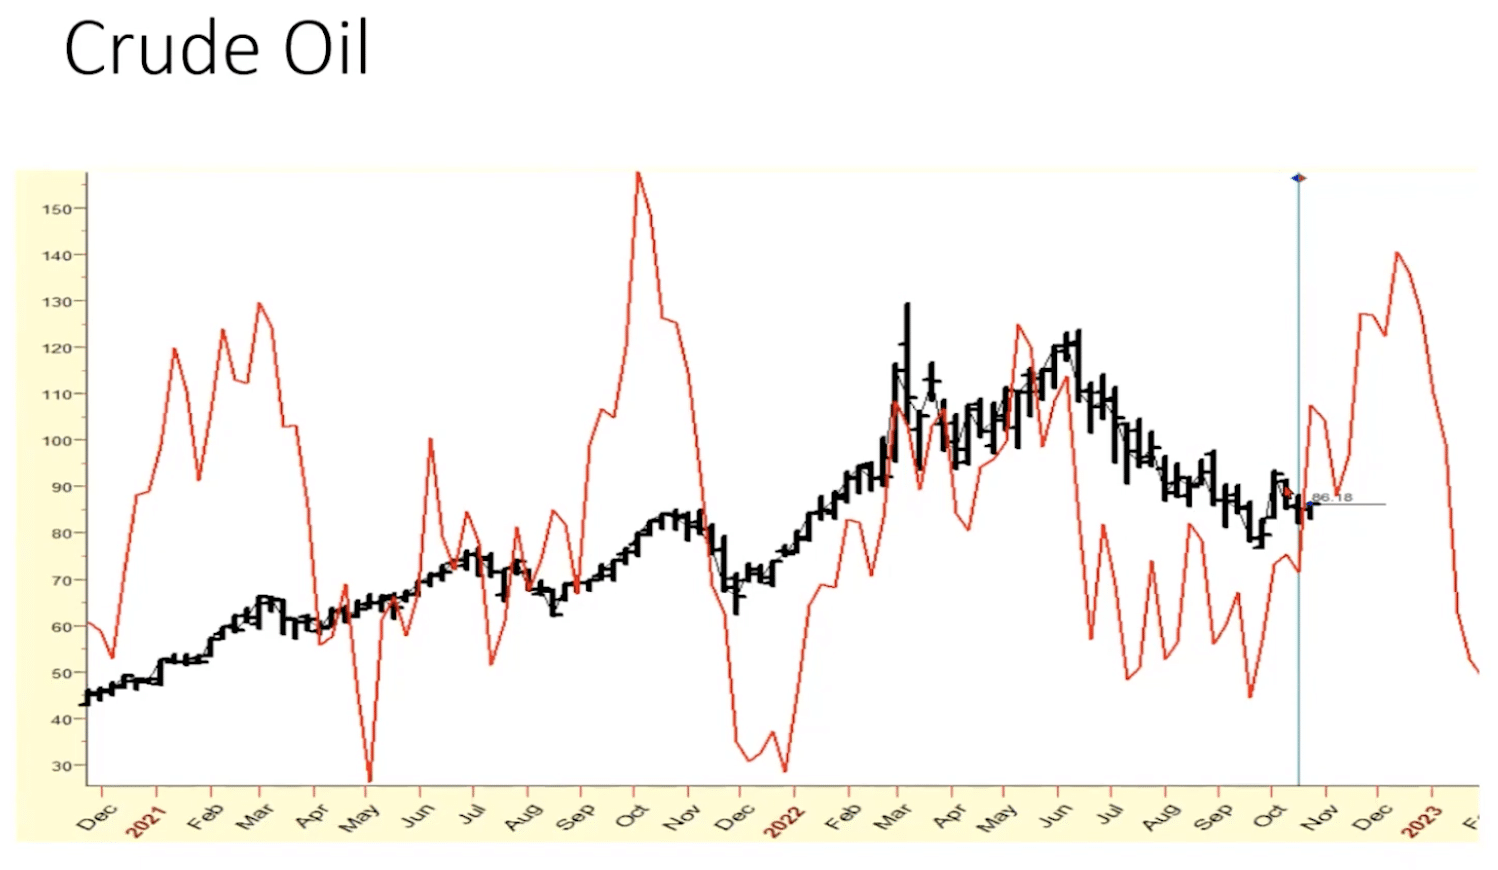
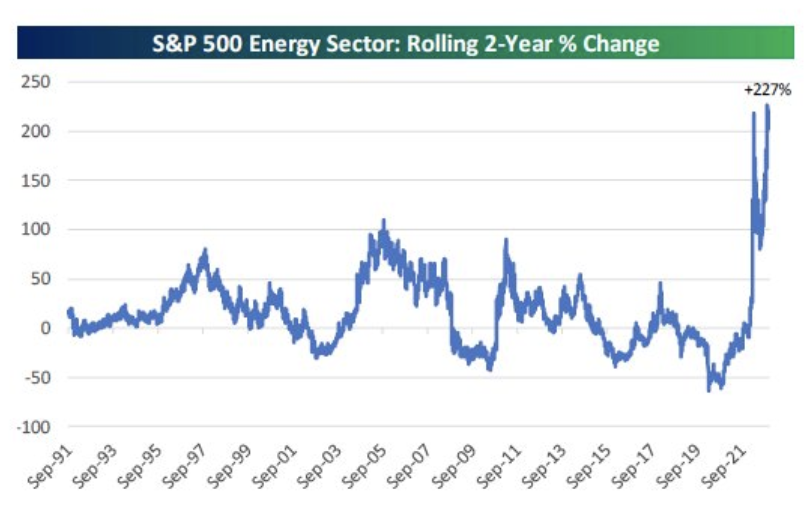
Larry Williams has accurately projected his thoughts about the current cycle, as the year has progressed and believes the market uptrend has begun, in lock-step with previously offered chart analysis. In his latest report, Williams believes oil/energy will have one last hurrah, before a more protracted decline in 2023
I don’t see the greatest of prospects for the energy sector playing out in 2023. Parabolic moves in anything simply don’t end terribly well for investors. They are often the signal that YOU WON!
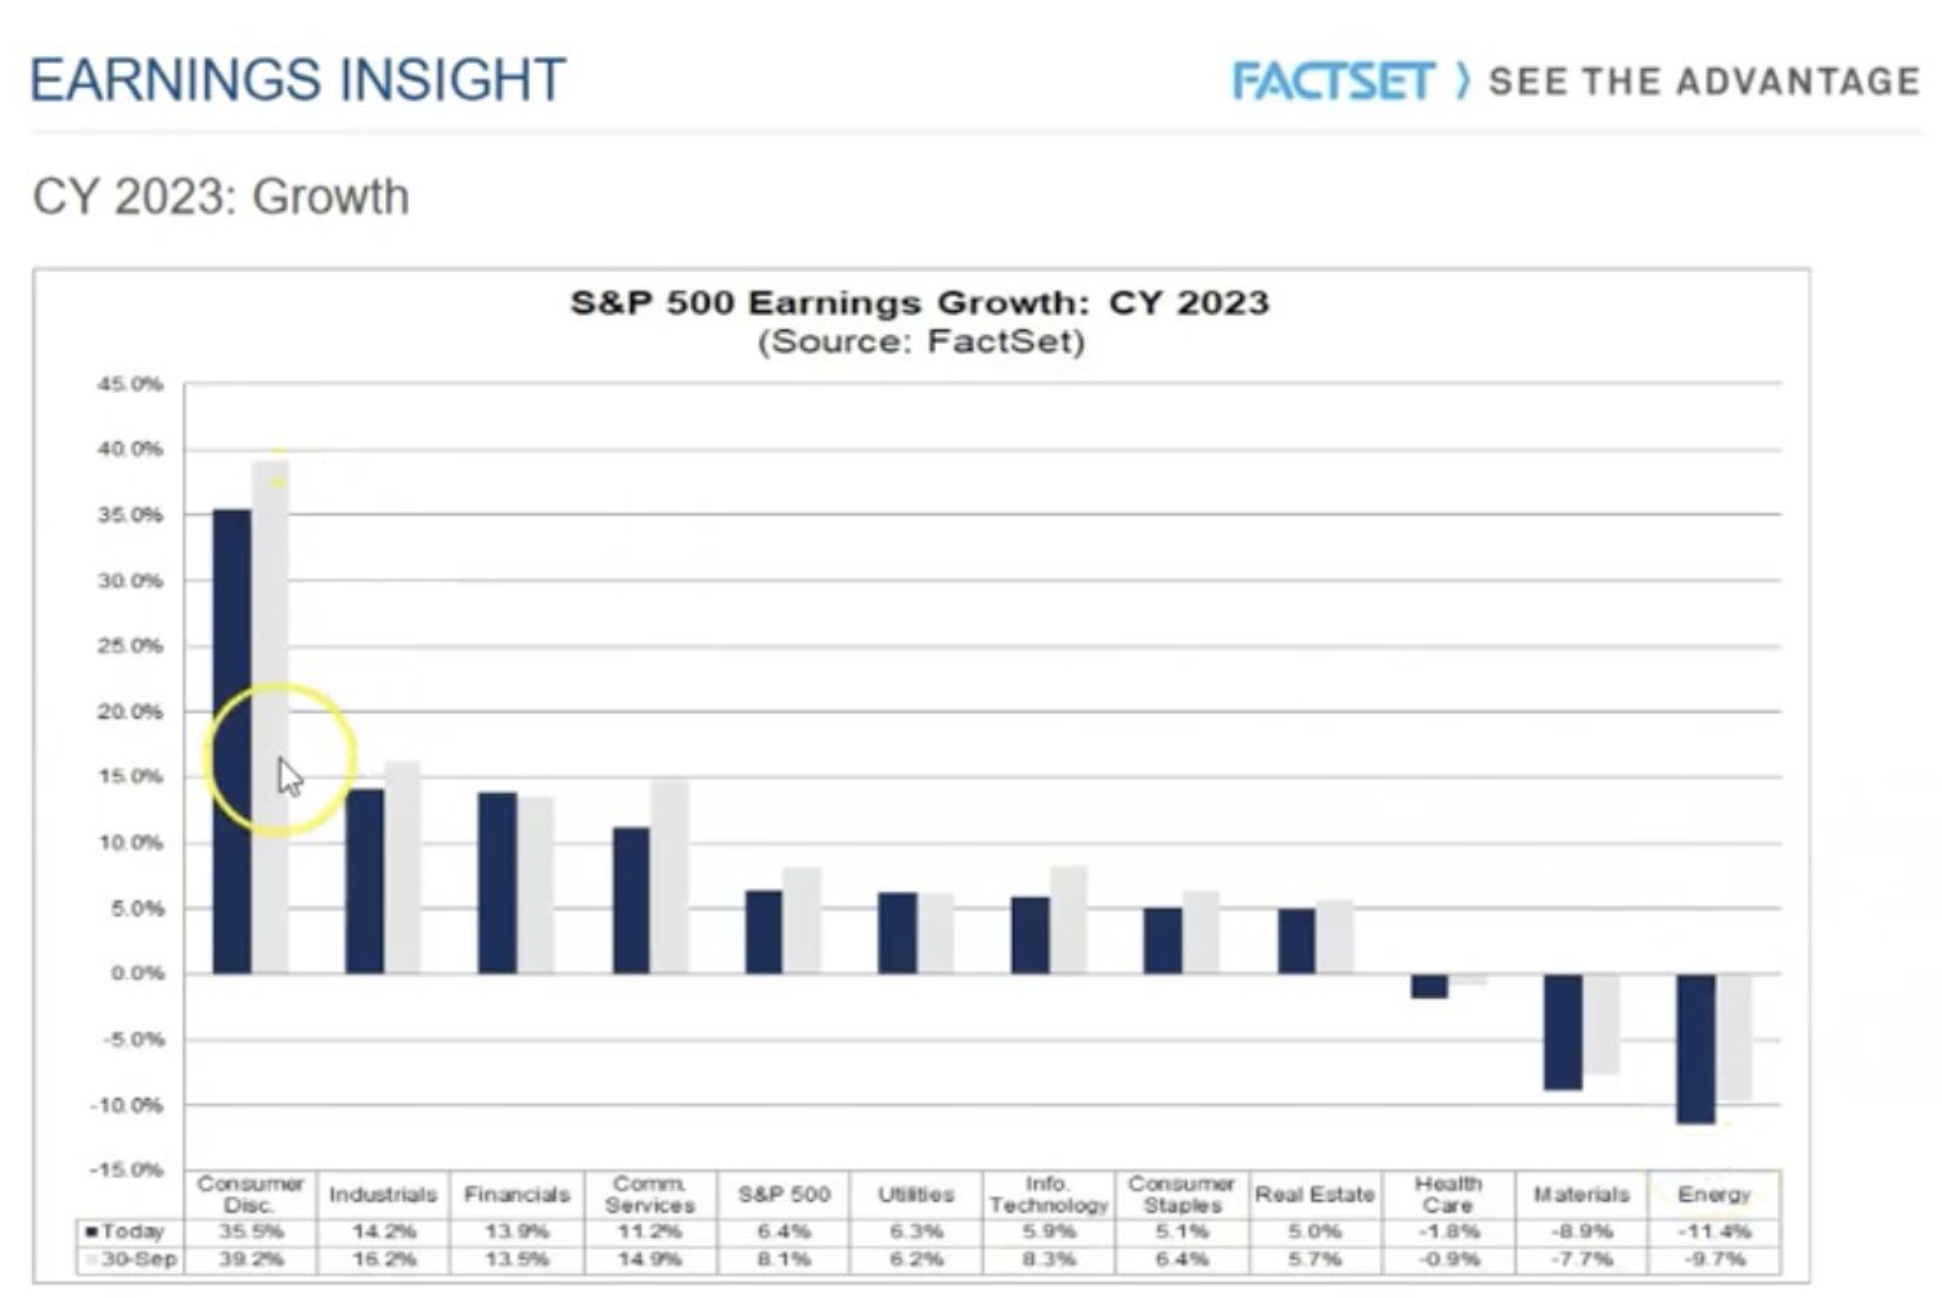
Now move on to something else. One of the biggest headwinds for the energy sector in 2023 is simply the strong EPS growth in 2022. Tailwinds becoming headwinds, setting too high a bar to jump over. Where the Consumer Discretionary sector (XLY) underperformed earnings expectations in 2022, it is setting up a tailwind for the sector in 2023. On the very right hand corner of the chart for 2023 EPS, you can see the headwind for Energy sector EPS is noted with a double-digit decline in the estimate:
The second issue is the shares outstanding within the sector, which have once again gone parabolic. This is something that no Energy sector investor wants to see, but it is the reality of the forward-looking situation. This increase in shares outstanding creates a significant headwind for future earnings growth. If this time is different, I would be very, very surprised.

So what does Larry Williams like going into 2023? Where does he see cyclal opportunties? You can only keep a good stock/company down for so long and before the headwinds turn into tailwinds. Larry Williams recognizes the weakness in FANG and specifically Amazon (Consumer Discretionary sector), as holding outsized potential going forward. He thinks it has the potential to rise 100%+ in the coming years, starting in 2023.
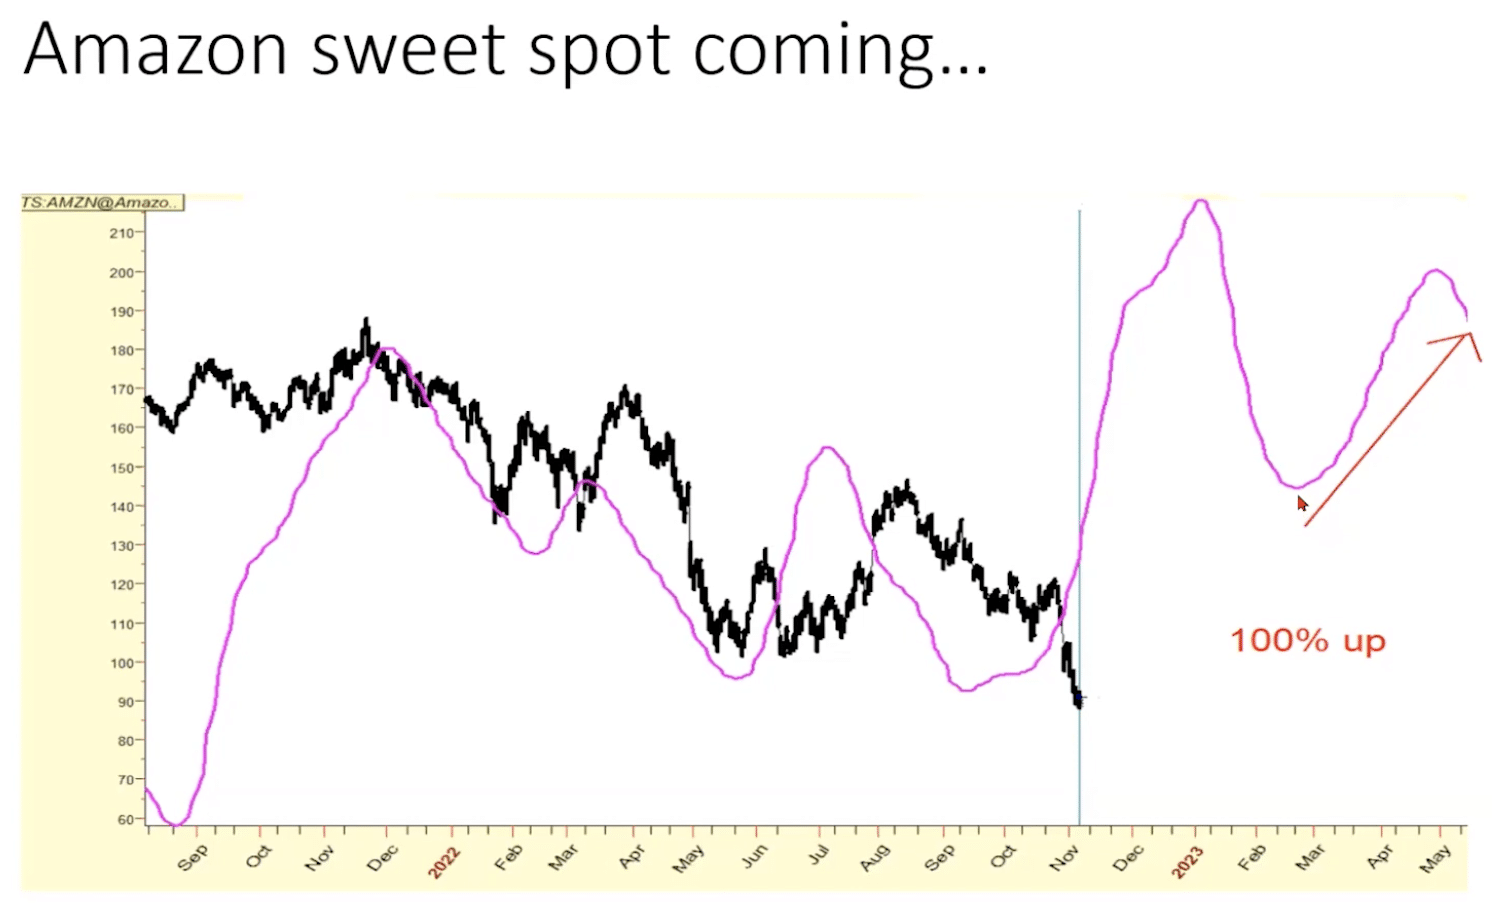
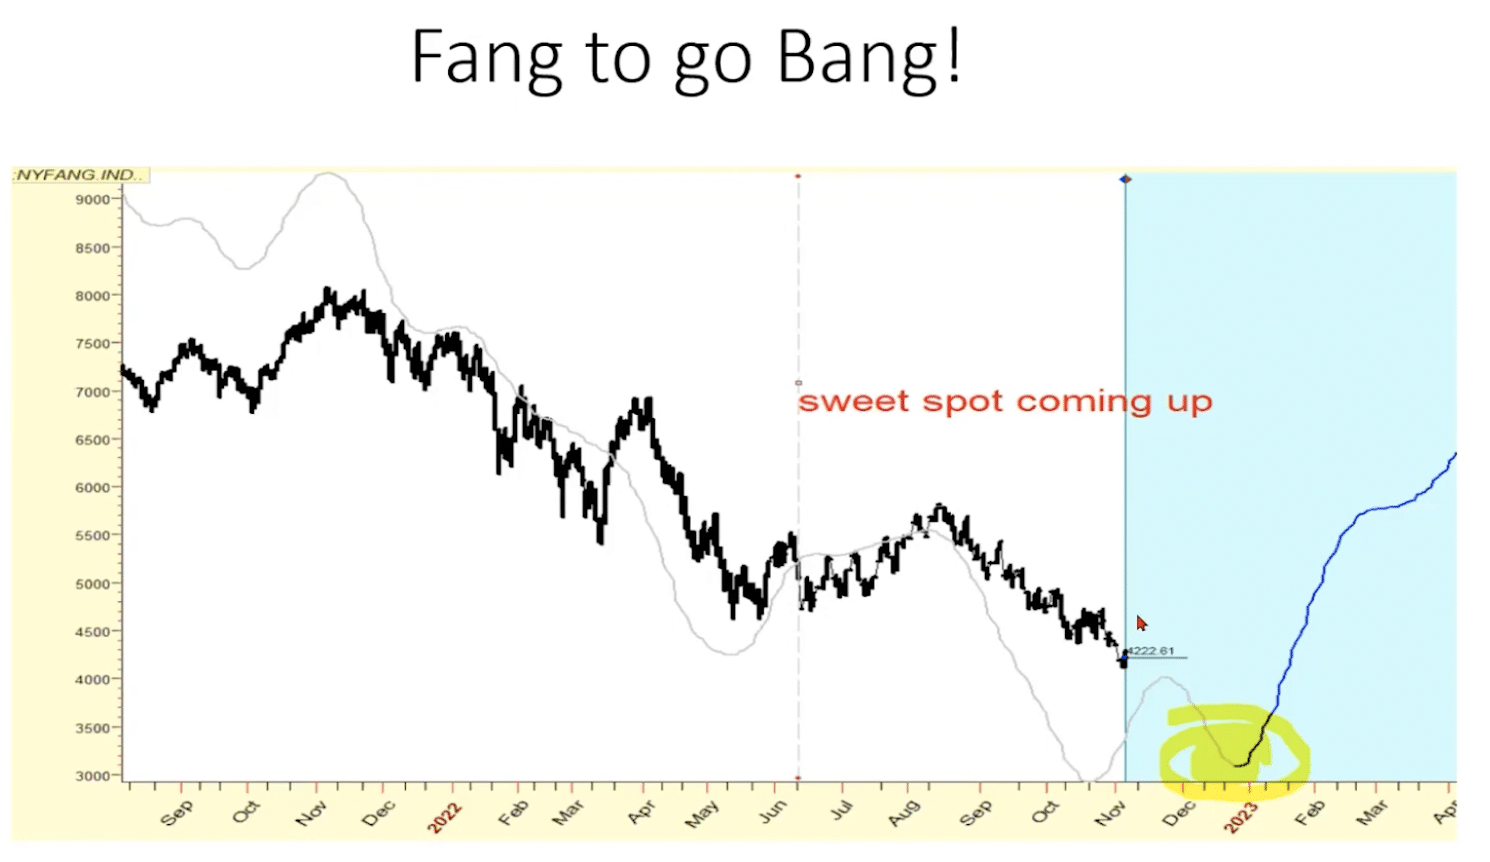
There are no guarantees, despite the stellar track record of calling cyclical trends and asset class peaks and troughs by Larry Williams. Having said that, I have previously liked the opportunity that the Amazon valuation presents, which many have beckoned for some time. Maybe that time has finally arrived for which the average investor can scoop up shares in what has been an innovative, on-trend, and dominating services company for the last 2 decades. That hardly seems a fad (Golden Capital Portfolio owns small position in AMZN shares)! The windows of great opportunity generally don’t stay open for very long and before great opportunity turns into reasonable opportunity, and further turns into higher risk opportunity. See you at this week’s State of the Market; have a great trading week AND a special THANK YOU TO OUR VETERANS!! 💯💯


