

Research Report Excerpt #1
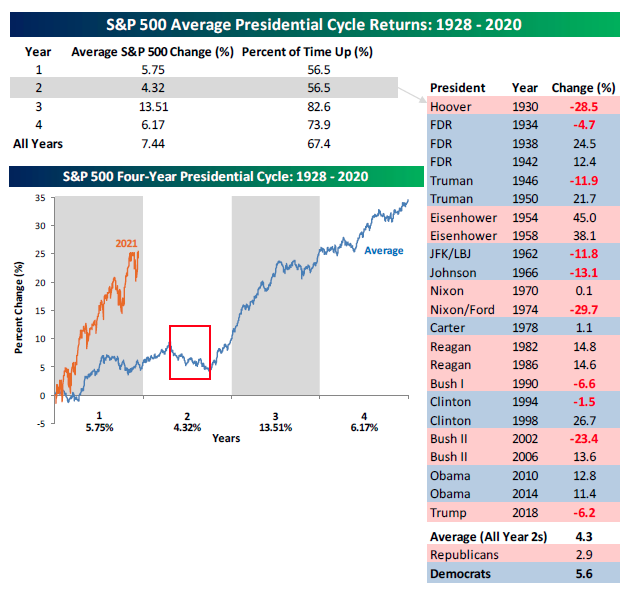
Heading into 2022, we understood that the historic potential S&P 500 returns surrounding midterm cycles and Year 2 of Presidential cycles usually deliver higher volatility and lesser returns. There were no guarantees that history would repeat, but the seasonal cycles suggested that a strongly profitable 2021 should reinforce year-end rebalancing ahead of the potential turbulence of a midterms and Presidential Year 2.
Research Report Excerpt #2
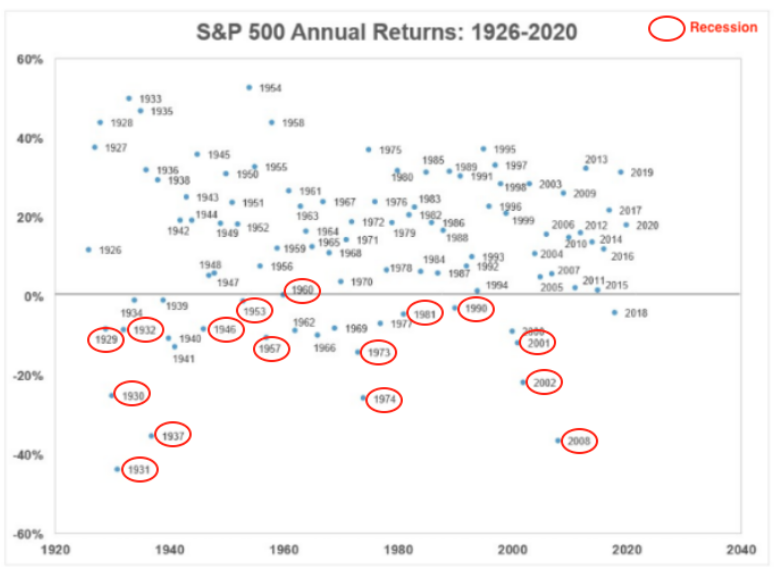
Anything can happen but, historically, for the S&P 500 to end the year with the losses currently established, the economy would have to be in a recession (red circles) or the U.S. is involved in a world war (chart and commentary from Urban Carmel). The circled years in the chart above identify S&P 500 returns that were negative in recessionary years.
Research Report Excerpt #3
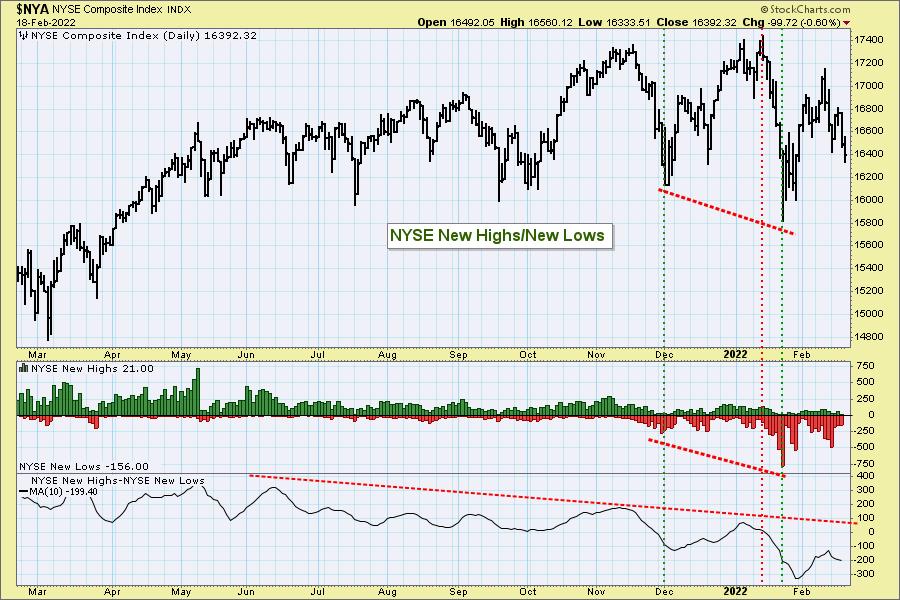
We are currently in a period where the New Lows are far outweighing the number of stocks that are making New Highs. Until this changes, we should anticipate market weakness and/or churning of price at the very least.
Research Report Excerpt #4
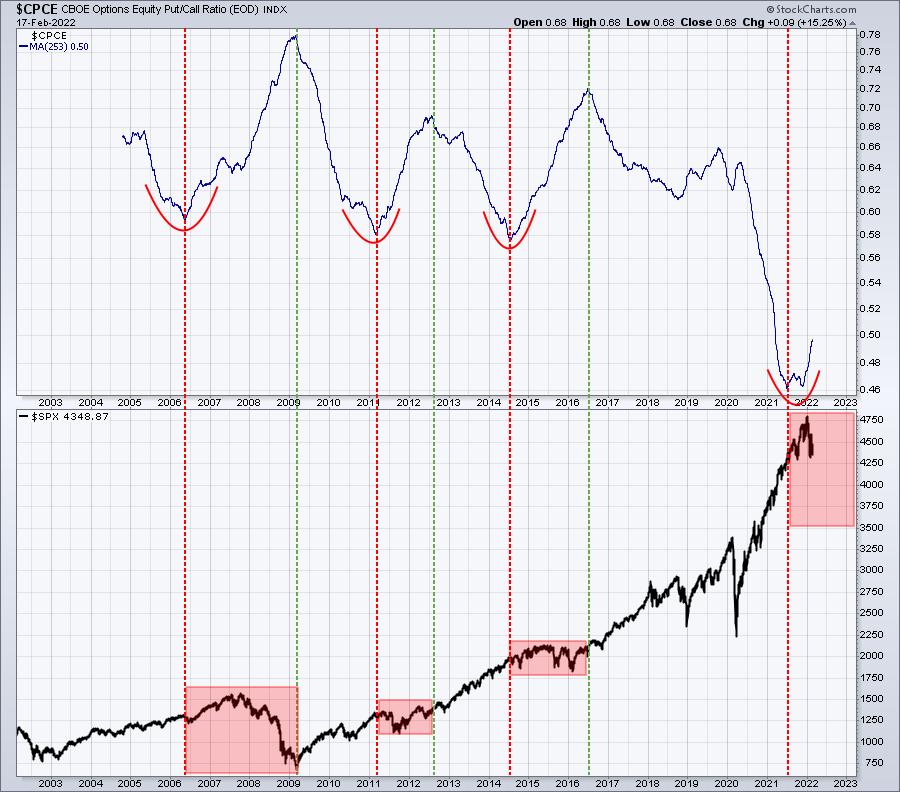
The red-dotted vertical lines mark warning signs where the CPCE reaches an extreme low (very bullish sentiment) and turns higher. The higher turn doesn’t automatically depict the end of a market rally, but it does suggest locking in profits and rebalancing one’s portfolio. Note that the S&P 500 struggled mightily after such low levels and turn-ups in the CPCE 253-day moving average. The green-dotted vertical lines essentially gives us that “all clear” signal when the CPCE has reached an extreme high (very bearish sentiment Tom Bowley).
Research Report Excerpt #5
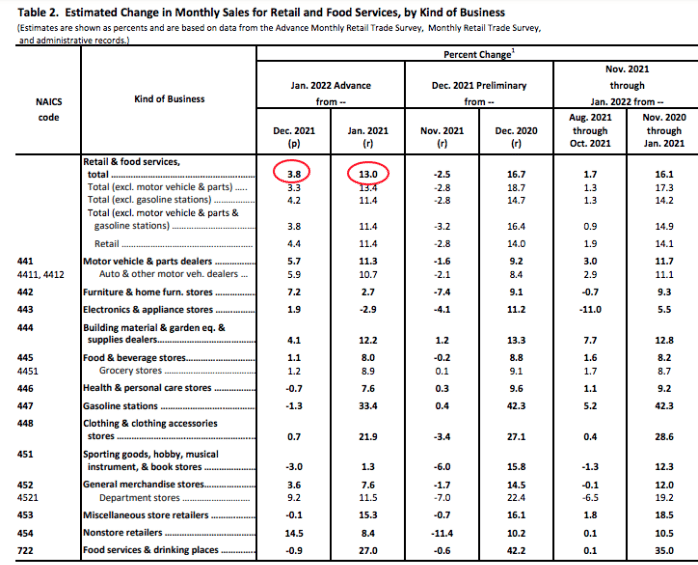
Retail sales jumped 3.8% in January and jumped 3.3% excluding autos, double the economists’ expectations. Those follow respective declines of -2.5% in December. Sales excluding autos, gas station sales and building materials also climbed 3.8% from -3.4%. The consumer is alive and doing quite well. The YoY January retail sales growth remained in double-digit territory, growing 13 percent. While this is slower than the average YoY mid-teens growth from 2021, it still very much supports above average 10-year GDP rates in 2022.
Where we saw month-to-month (December to January) weakness in retail sales was likely to be in the expected dining out category. Food services and drinking places (bottom of the table) retail sales fell -.9% in January. This was very likely part of the Omicron adverse affects.
Research Report Excerpt #6

Any continued recovery in passenger numbers will likely put upward pressure on ticket prices, another component of CPI. It is worth remembering however, that per CPI data, airfares had been falling since 2013, had dropped a further 28% at the onset of the pandemic, and that even following recent increases, prices have only recovered to 1999 levels (www.BLS.gov).
Research Report Excerpt #7
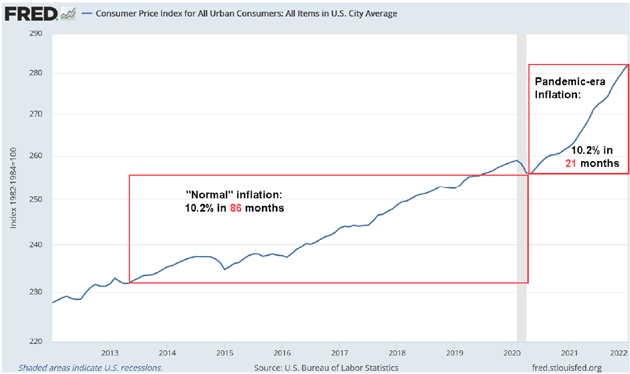
The latest reading on CPI proved uncomfortably high for MOST, not some but MOST market participants. From May 2020 through January 2022, CPI rose a total (not annualized) of 10.2%. Going backward from the same point, you have to start at March 2013 to get the same amount of inflation. That means the pace has more than quadrupled (chart above). This calls to mind the old saying of a frog in hot water. We are the frogs and we enjoyed a nice warm bath for many years. Now it’s uncomfortable and getting more so. No surprise, we’re trying to jump out. It’s not as easy as we thought, but time will tell how big a bite out of potential growth inflation takes. For now, the elevated inflation concerns and rhetoric will likely remain in the financial media headlines until a peak in inflation and subsequent decline is determined. This is likely to take shape after the Q1 period, per most economists’ estimates.
Research Report Excerpt #8
At this point in time, 77 companies in the index have issued EPS guidance for Q1 2022. Of these 77 companies, 55 have issued negative EPS guidance and 22 have issued positive EPS guidance. The percentage of companies issuing negative EPS guidance is 71% (55 out of 77), which is above the 5-year average of 60 percent.
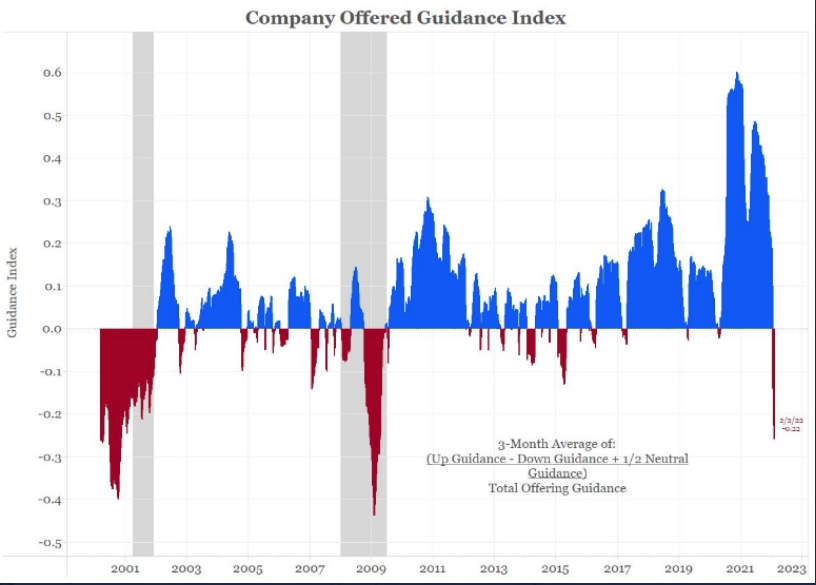
As the chart above, from Jim Bianco depicts, net earnings guidance for companies turned most negative since 2009, before that 2002. This clearly reflects uncertainty. I’ll remind investors how earnings/S&P500 growth persists by climbing the wall of worry. What happened after 2009 & 2002? Indeed, long bull markets.
Research Report Excerpt #9
I recall that my peak drawdown was roughly 38% and my short UVXY holdings comprised 66% of that drawdown. Admittedly, it was a truly uncomfortable time for many investors that breezed through the 3 previous years whereby the market delivered double-digit returns in 2012, 2013, and 2014. Three years of double-digit returns, sound familiar (2019 = 31%, 2020 = 18%, 2021 = 27% returns) ? Indeed, the market is little more than human behavior reacting to price, and that human behavior can often prove repetitive. Both 2011 and 2015 delivered s0-so returns and with significant corrections before setting-up tremendous opportunities for savvy investors who stuck with the market. Actively buying the correction in 2015 and increasing my overall market exposure into 2016 proved prescient. The Golden Capital Portfolio delivered a 100%+ gain by year-end 2016, by taking advantage of the 2015 set-up year.
Set up years should be welcomed by investors, even found for great anticipation. If we include our 1982 analogue, which found a 14% correction during that year, 2022 has all the tell-tale signs of being another set-up year for investors.
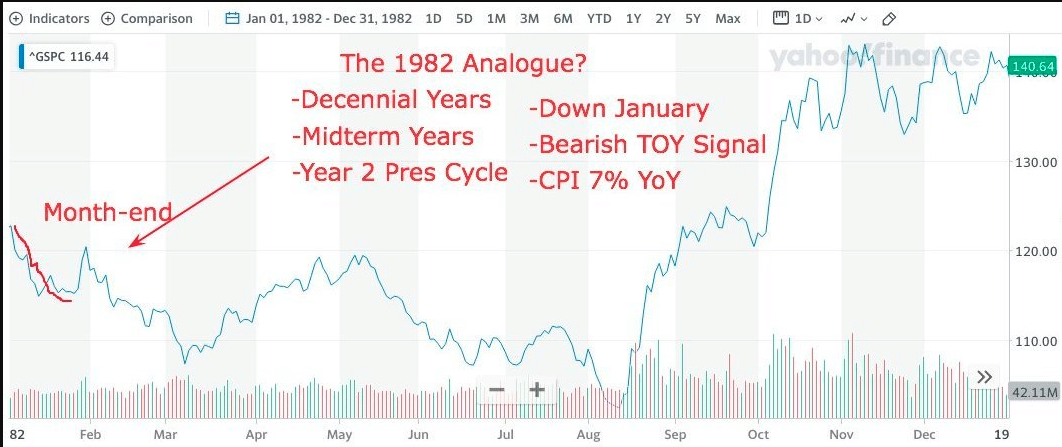
1982 has extreme similarities to 2022, and proved a set-up year as well. What was it setting-up?


