

Research Report Excerpt #1
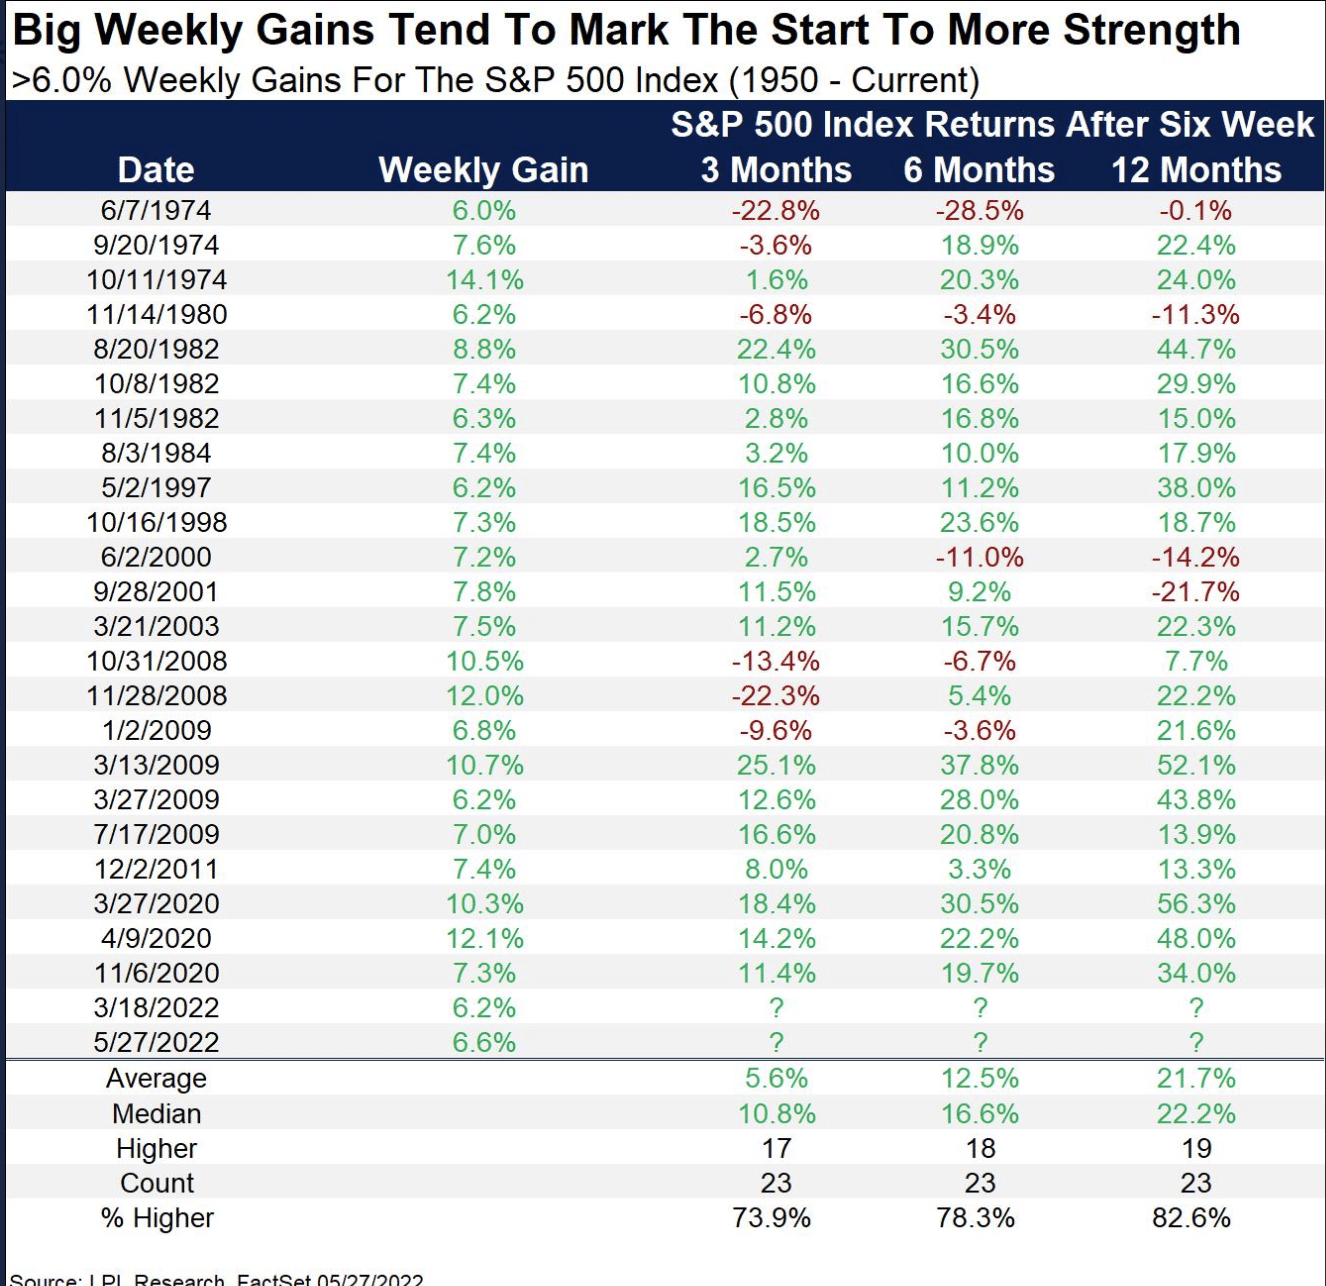
- From May 20th to May 27th, the market rallied greater than 6%.
- One step forward, but unfortunately that resulted in 2 steps backward and new lows for the major averages in June.
- Nonetheless, these types of outsized weekly gains usually hold strong forward returns out 3-12 months.
- The key seems to be avoiding a recession, otherwise negative returns were found in 1980 and 2008.
Research Report Excerpt #2
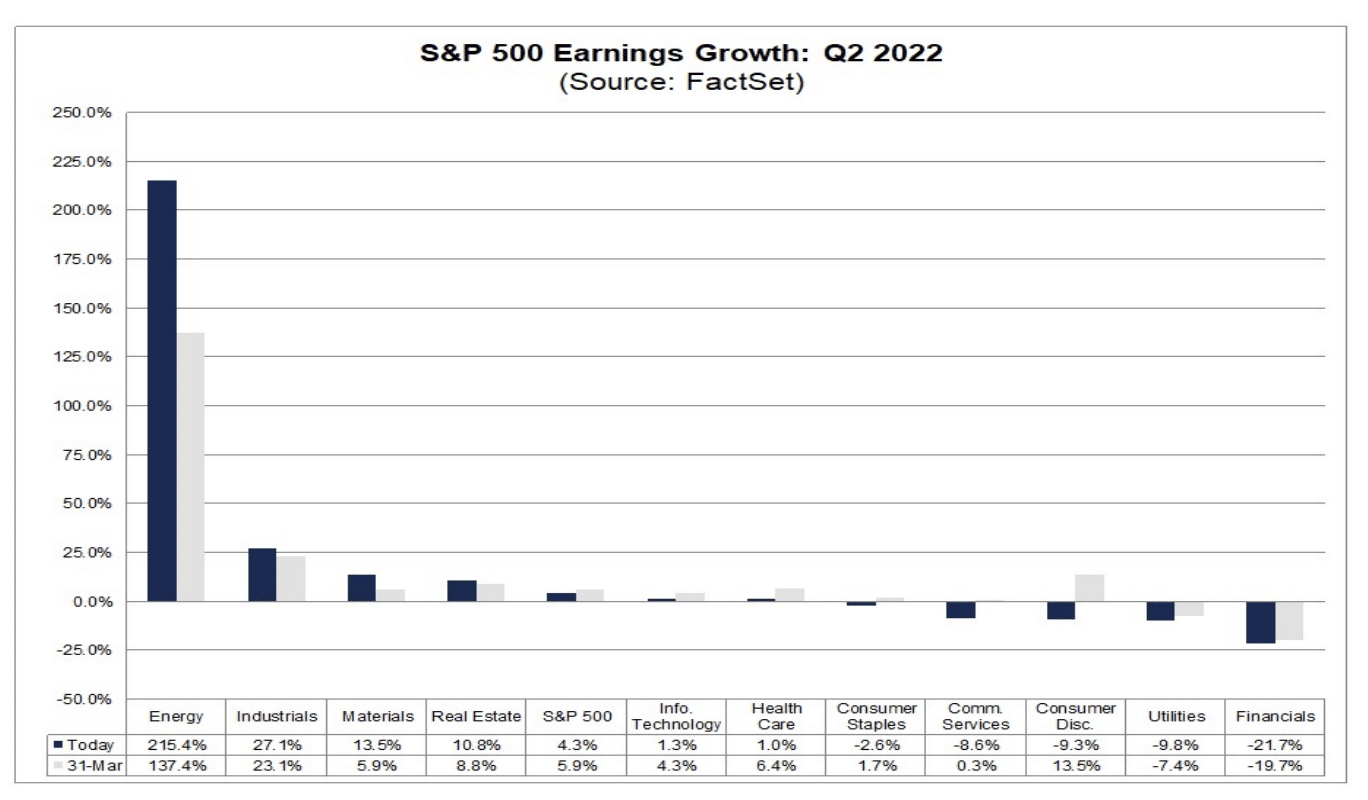
- For Q2 2022, analysts are projecting 4.3% earnings growth.
- For Q3 2022, analysts are projecting 10.8% earnings growth.
- For Q3 2022, analysts are projecting 10% earnings growth.
- For FY 2022, analysts are projecting 10.4% earnings growth.
For the sake of discussing the downwardly revised Q2 estimates since the end of Q1, analysts have taken their estimates down by 1% for S&P 500 earnings. So how does this compare with history, right? I mean if we keep hearing about weaker earnings estimates, is this something to fear or something to be expected? The 5-year revision average is -2.3%, the 10-year revision average is -3.3% and the 15-year revision average is -4.7% for a quarter. Clearly, downward revisions are “par for the course” and clearly the current estimated revision is better than the historic averages.
Research Report Excerpt #3
The daily economic data releases have been increasingly coming in lighter than forecast and expectations in most regards. Such weakness has pushed the Citigroup Economic Surprise Index deeply negative.
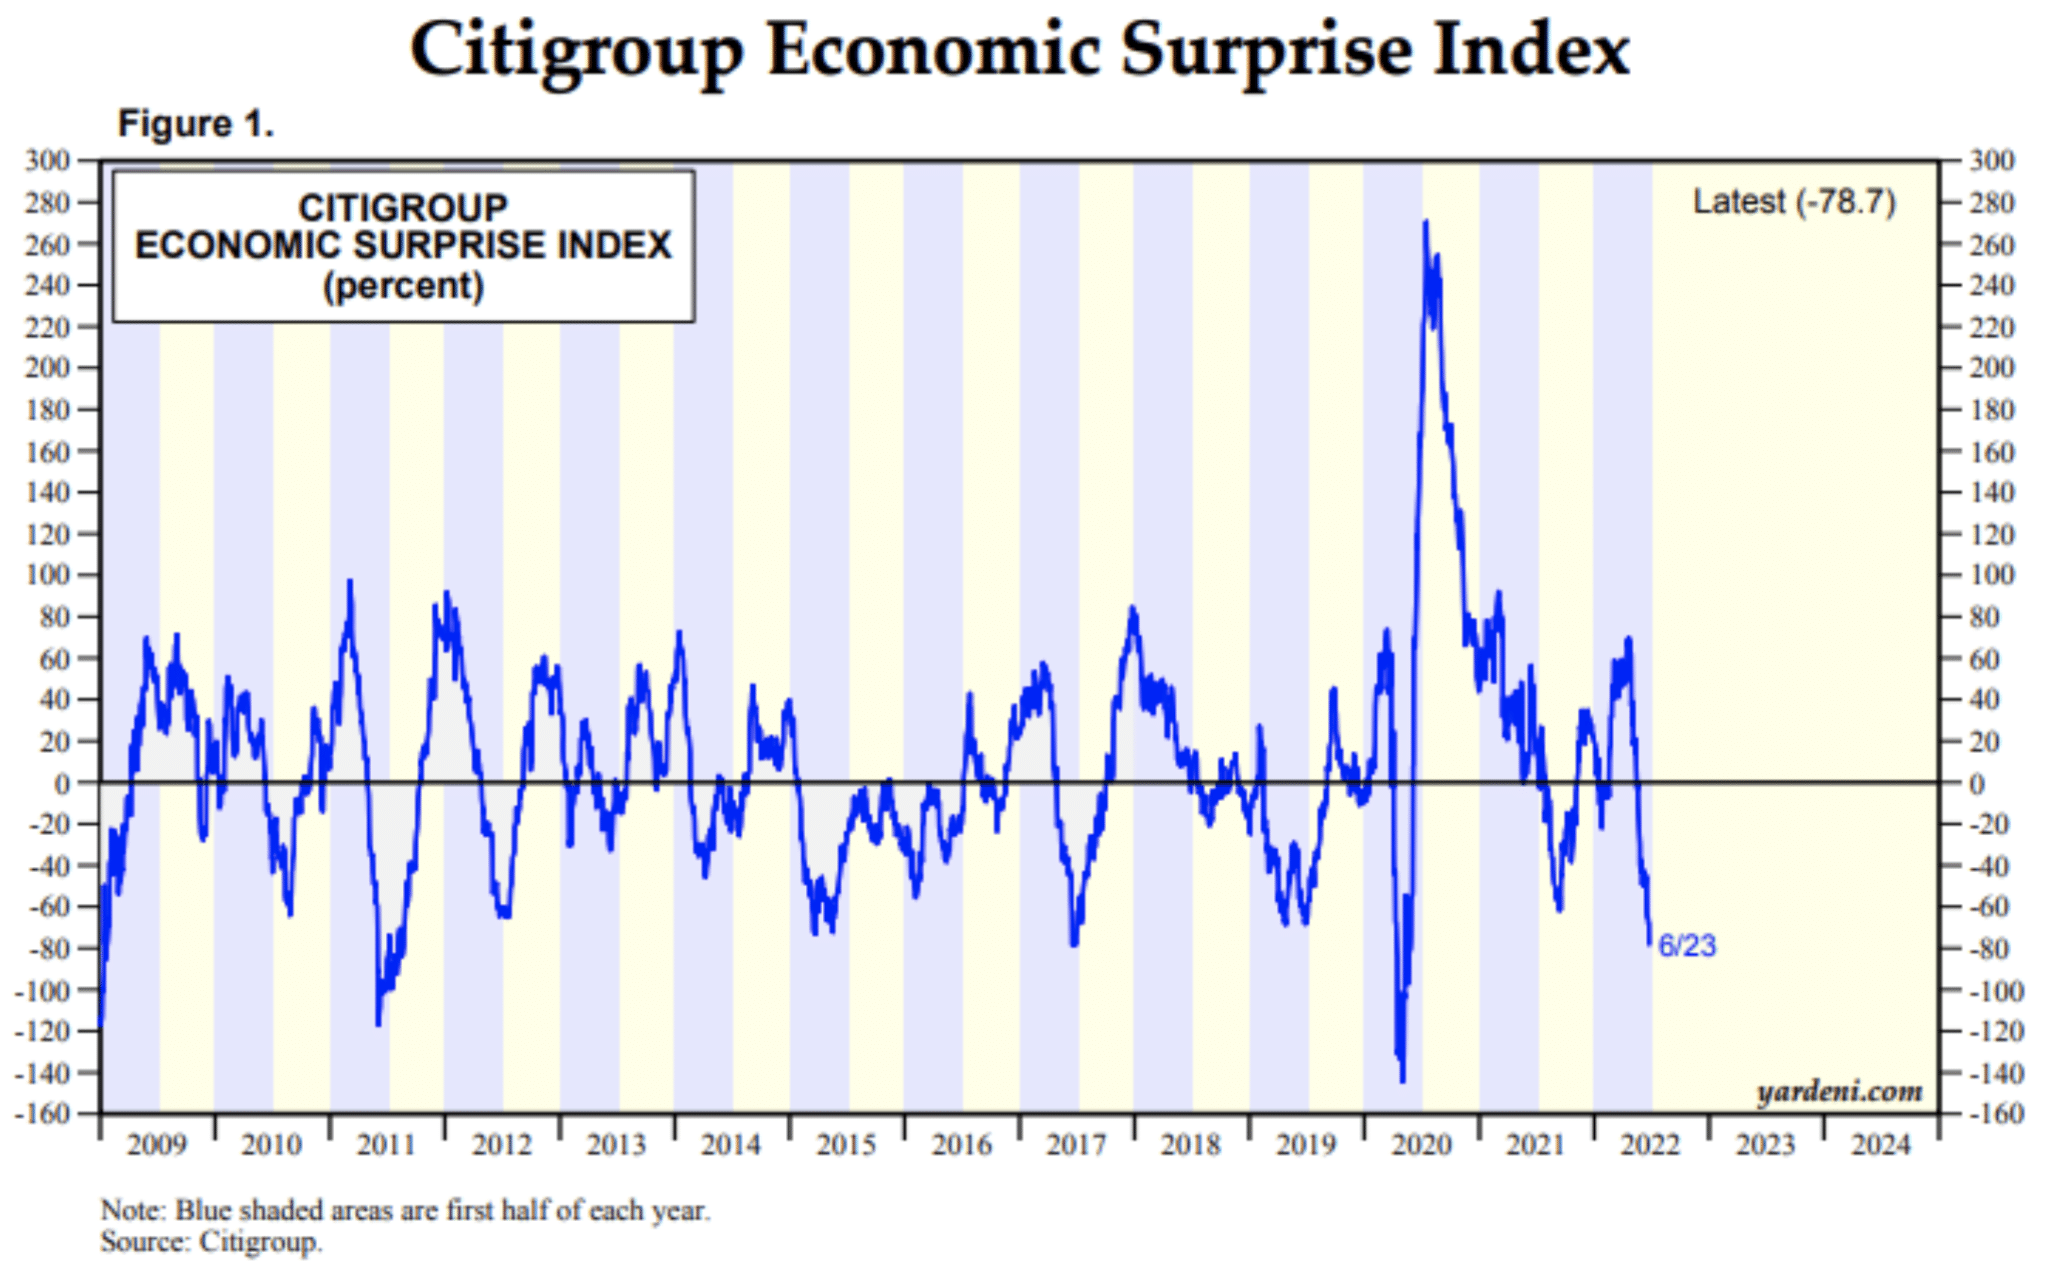
We wouldn’t worry too much about such a reading. As one can see, readings below zero are quite frequent. Economists are as good at predicting economic metrics as anybody else, I hate to say.
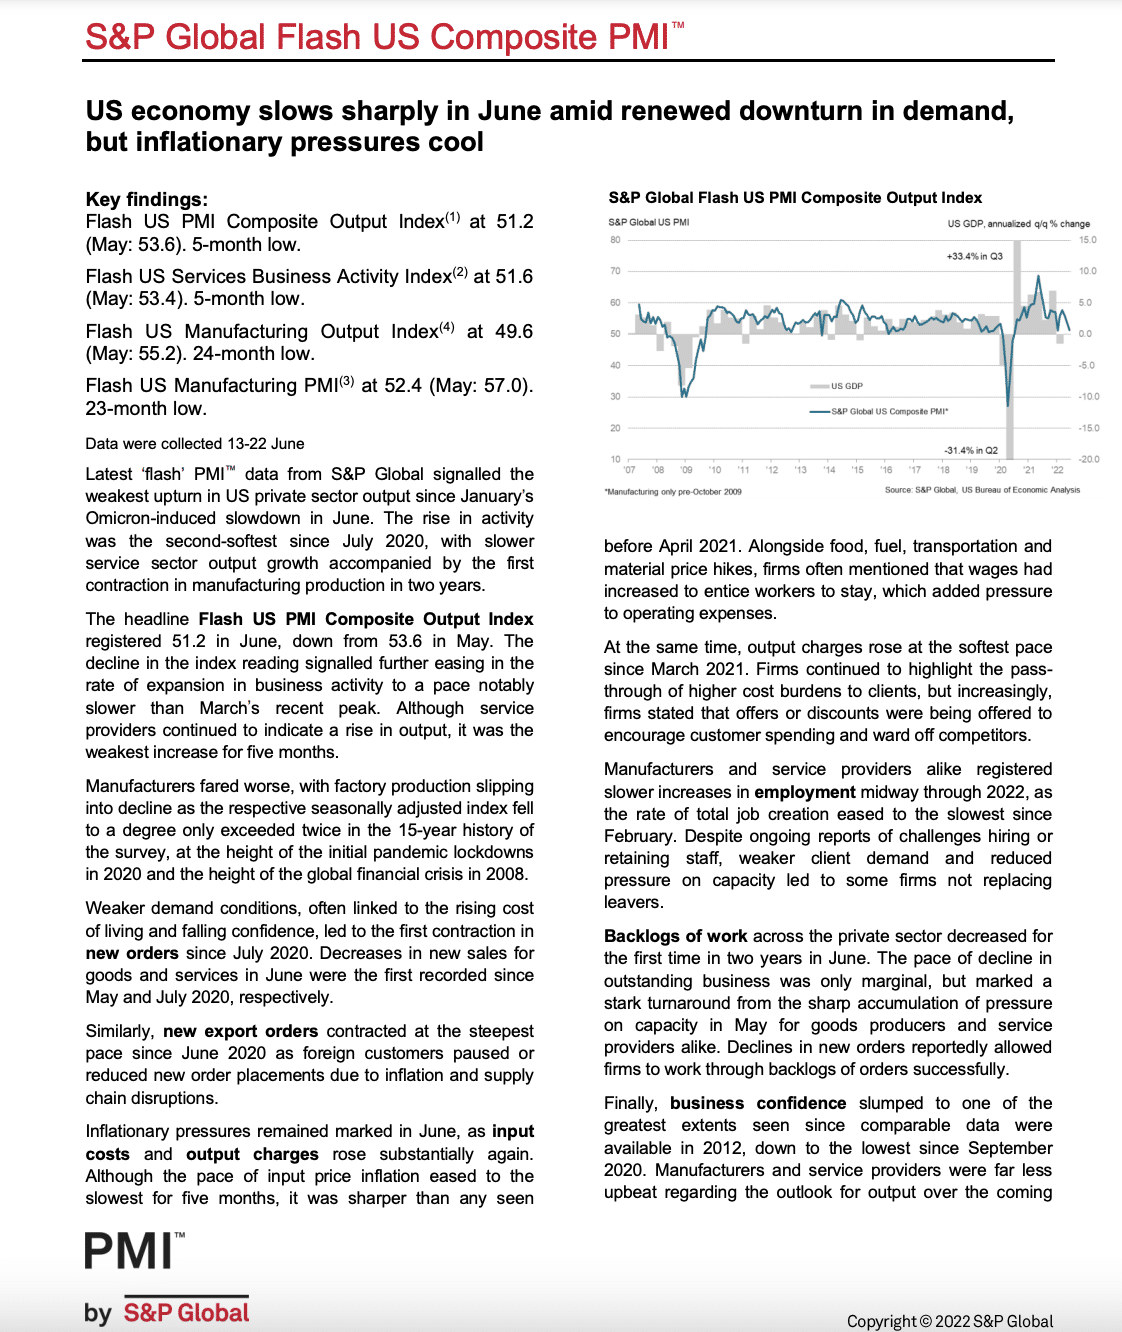
Research Report Excerpt #4
Last week’s Philly Fed and Empire State manufacturing data weakness foreshadowed weakness in the more robust survey from S&P Global PMI this past week. (click to enlarge)
While this is just the initial PMI readings from S&P Global, the shift in consumer spending from goods to services suggests market participants shouldn’t anticipate a significant moderating from the present results in either direction, and when the final reading is offered in the coming weeks. In fact, we anticipate the trend of slowing PMI data to persist over the coming months, as the rate-of-change or base effects headwinds persists.
Research Report Excerpt #5
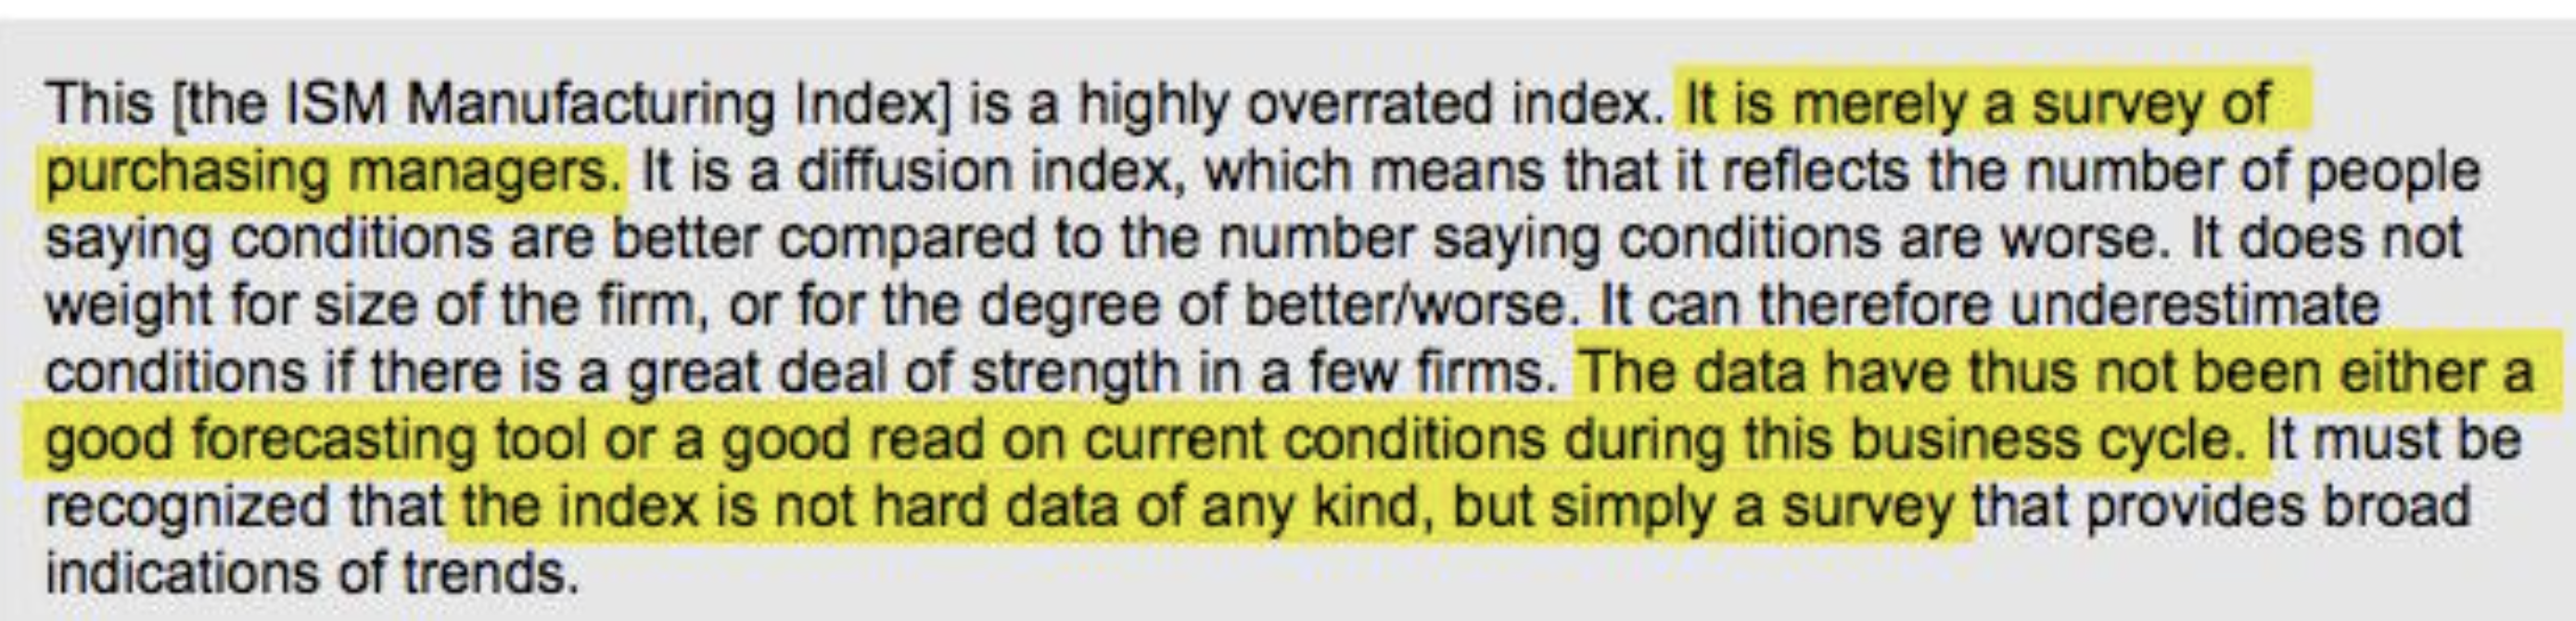
As I have offered many a time in the past; I do not favor soft/survey data with respect to Finom Group overall economic analysis. The survey is simply sentimental, and historically doesn’t lend well to predicting a more broad economic outcome, let alone forward S&P 500 returns. Here is how Doug Short of “Advisor’s Perspectives” explains Purchasing Manufacturing Index surveys (Urbancarmel)
Research Report Excerpt #6
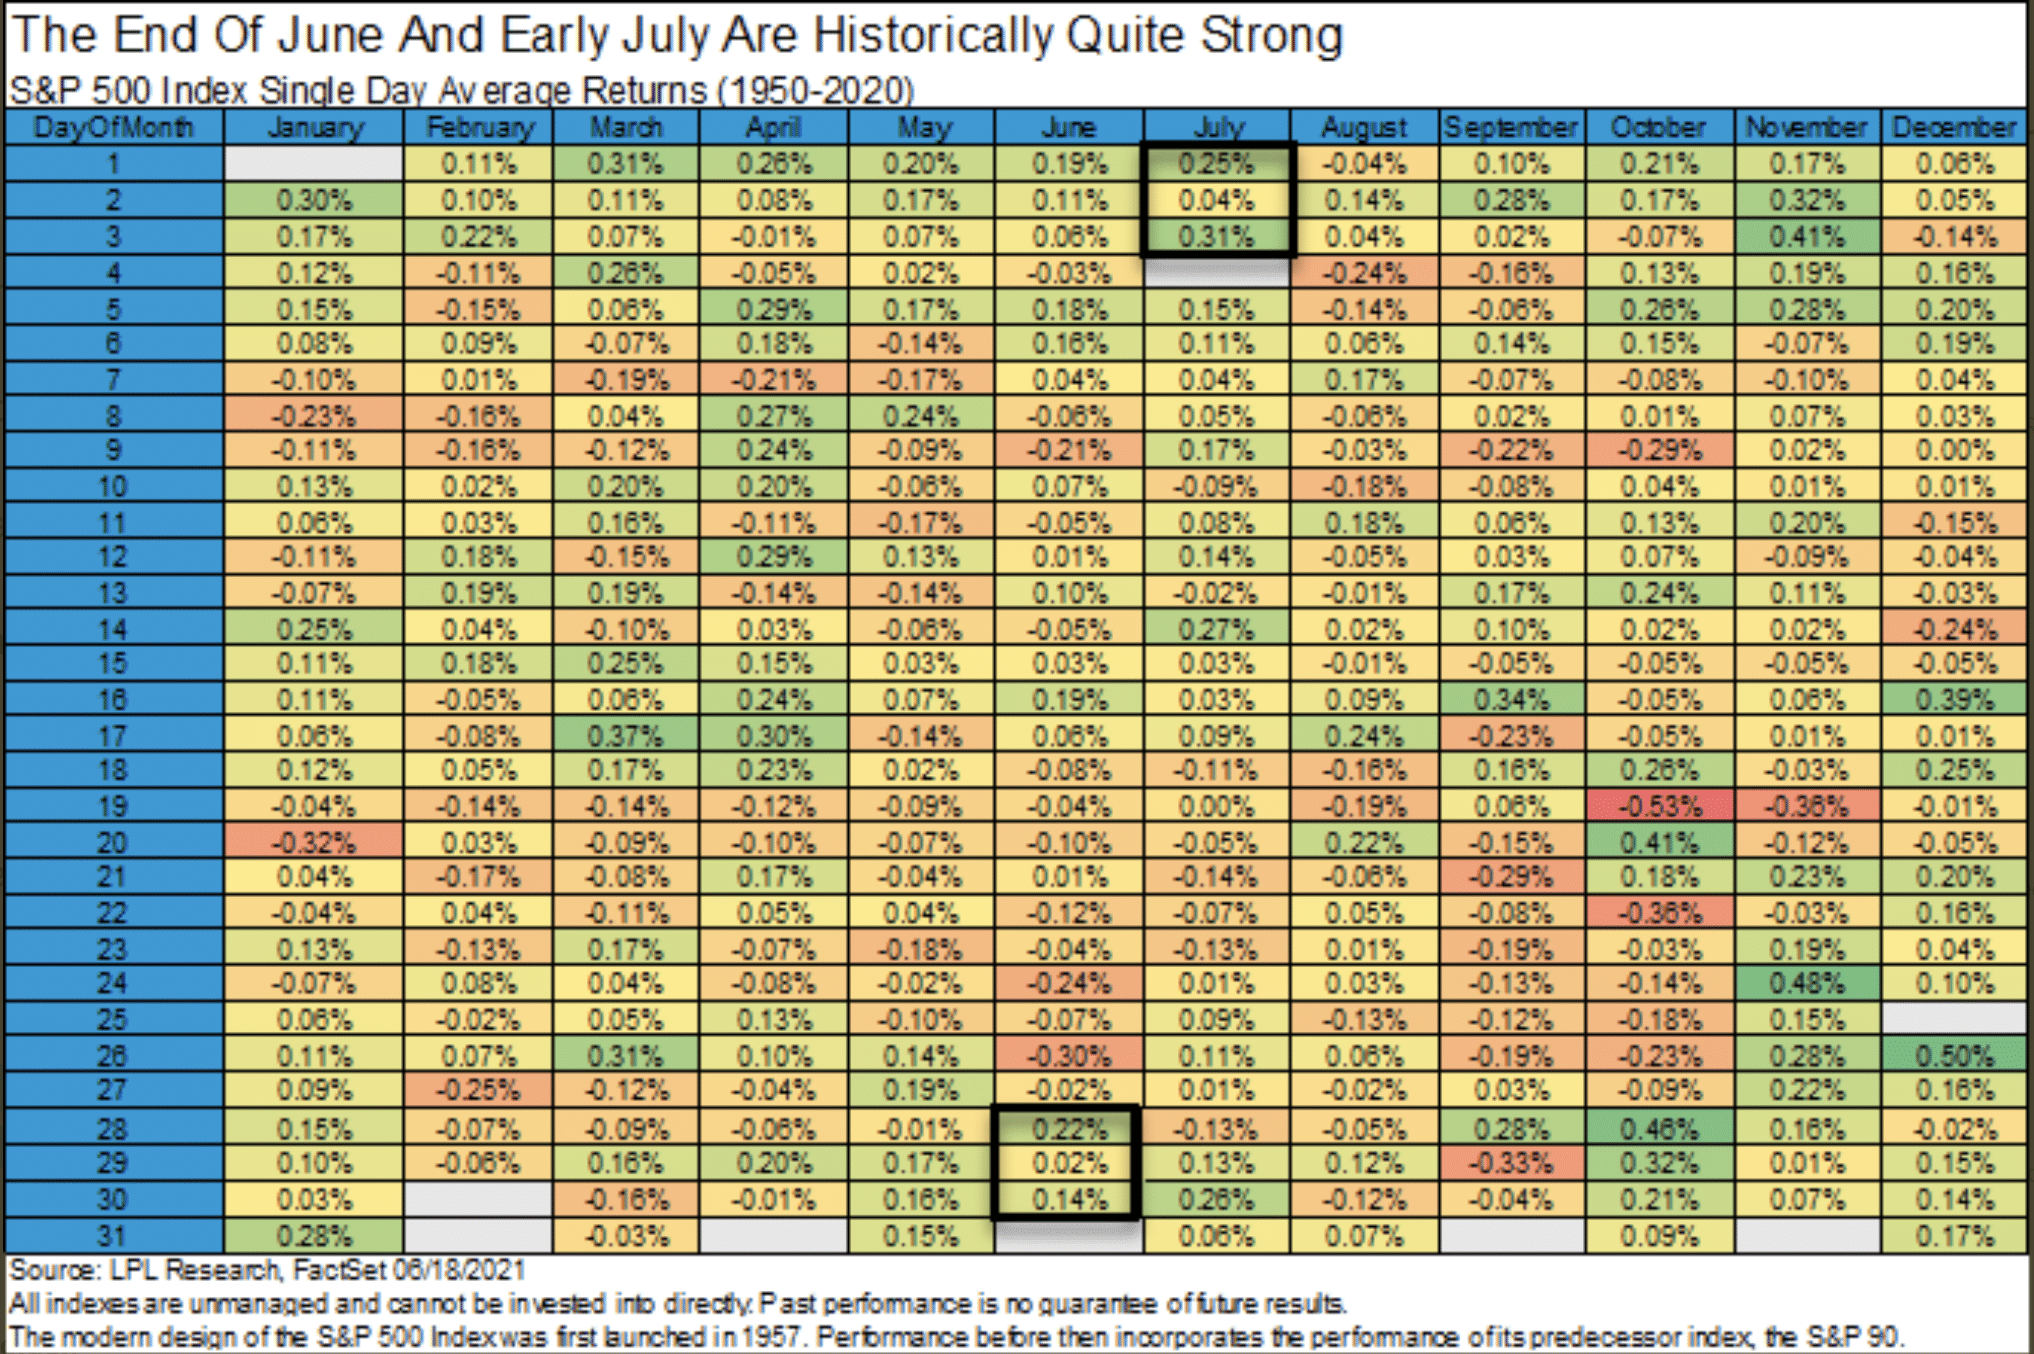
Just a heads-up, as the week before and leading into July 4th is one of the strongest weeks of the year. In 2021, all the S&P 500 did was make a new high 7 days in a row, the longest streak since June 1997. History doesn’t always repeat, but it can and often does rhyme.
Research Report Excerpt #7
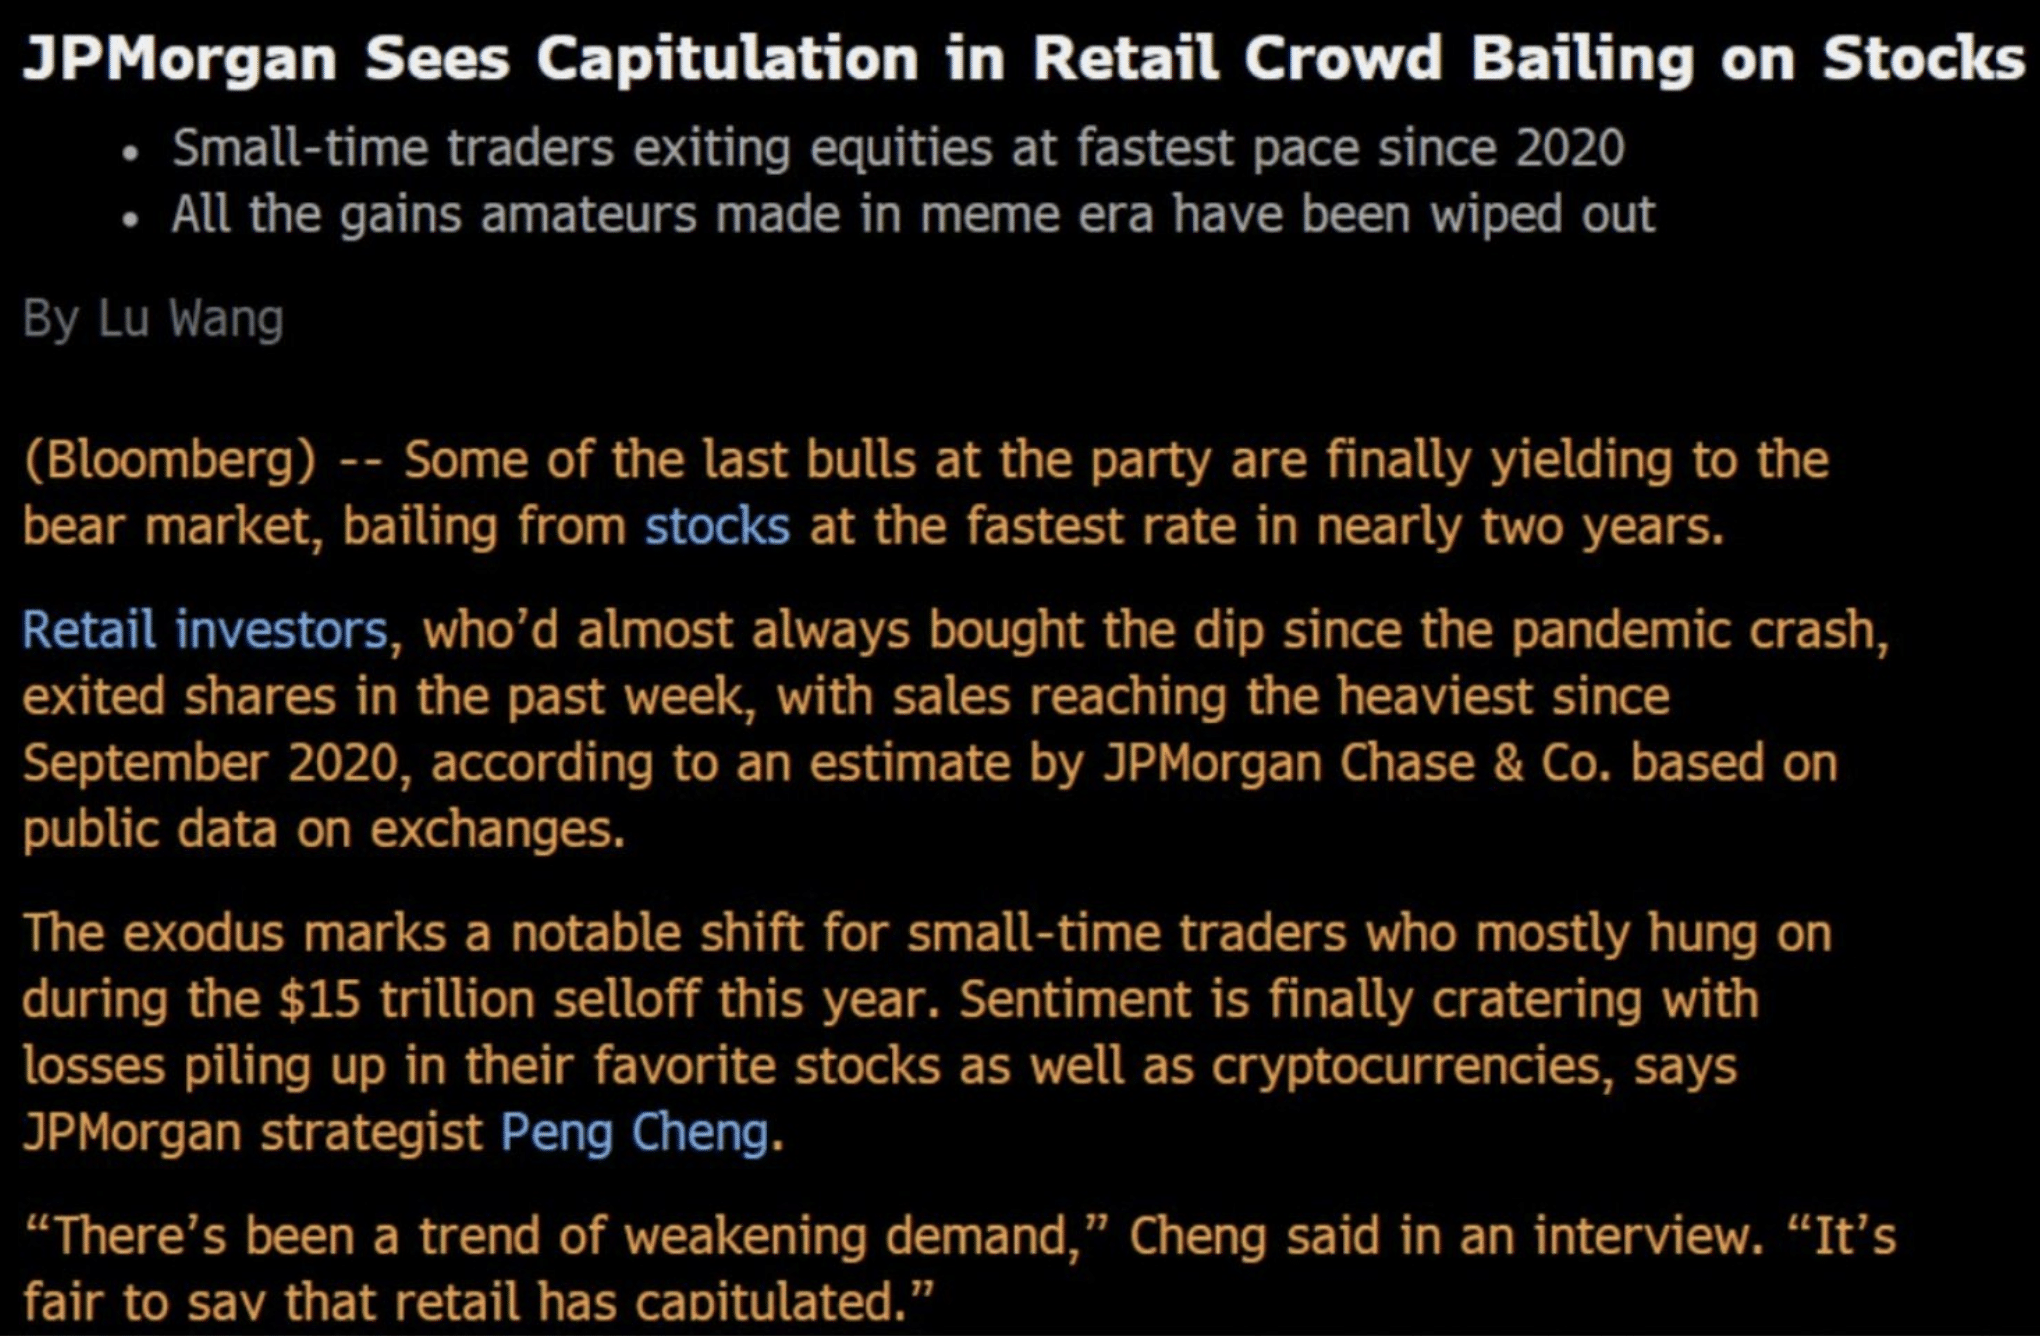
Well, this past week J.P. Morgan confirmed this retail capitulation that much further as noted below:
Research Report Excerpt #8
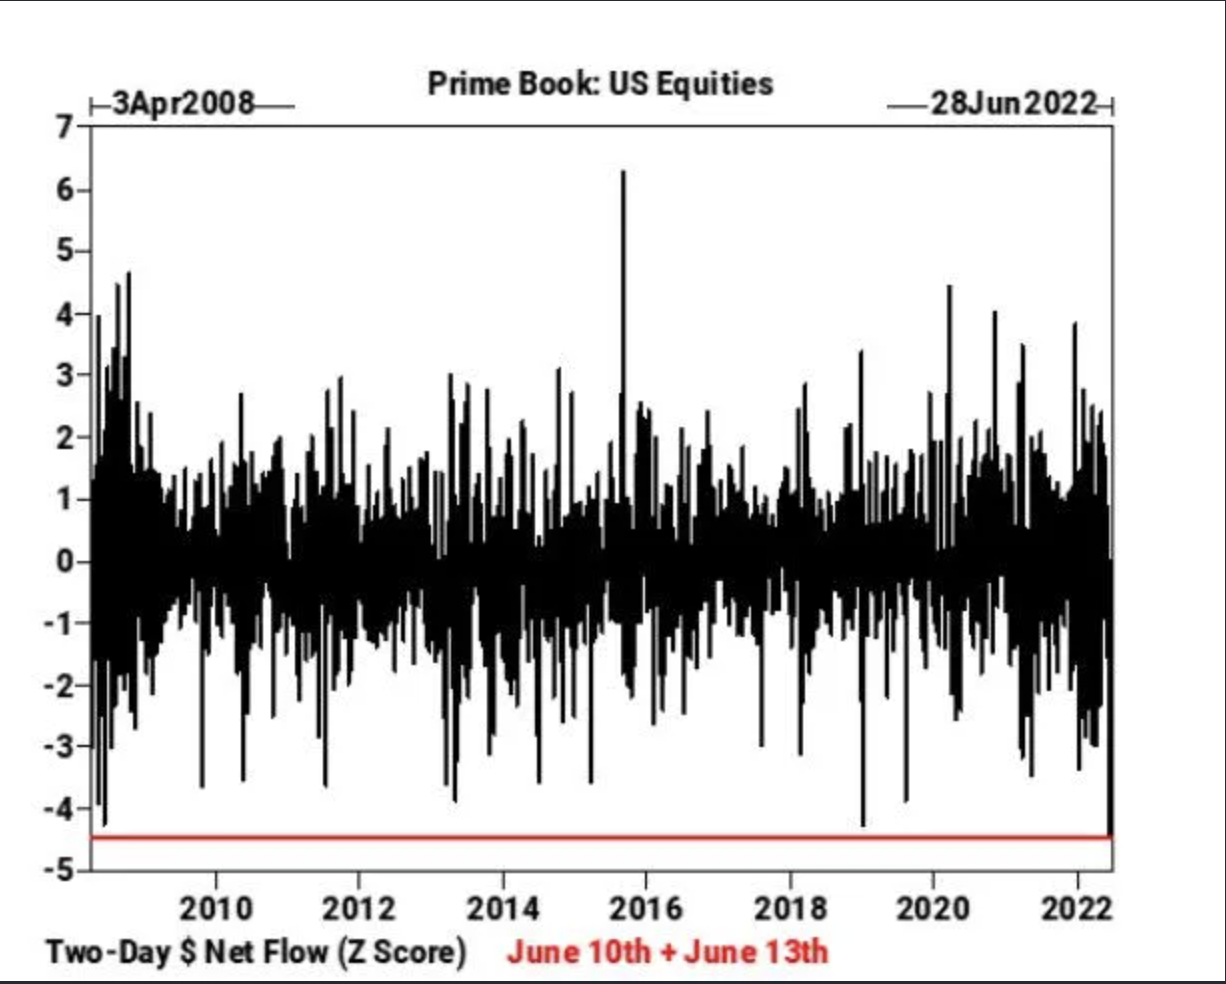
Hedge funds tracked by Goldman Sachs Group offloaded U.S. equities for a seventh straight day, with the dollar amount of selling over the last 2 sessions (Thursday and Friday) exploding to levels not seen since the firm’s prime broker began tracking the data in April 2008.
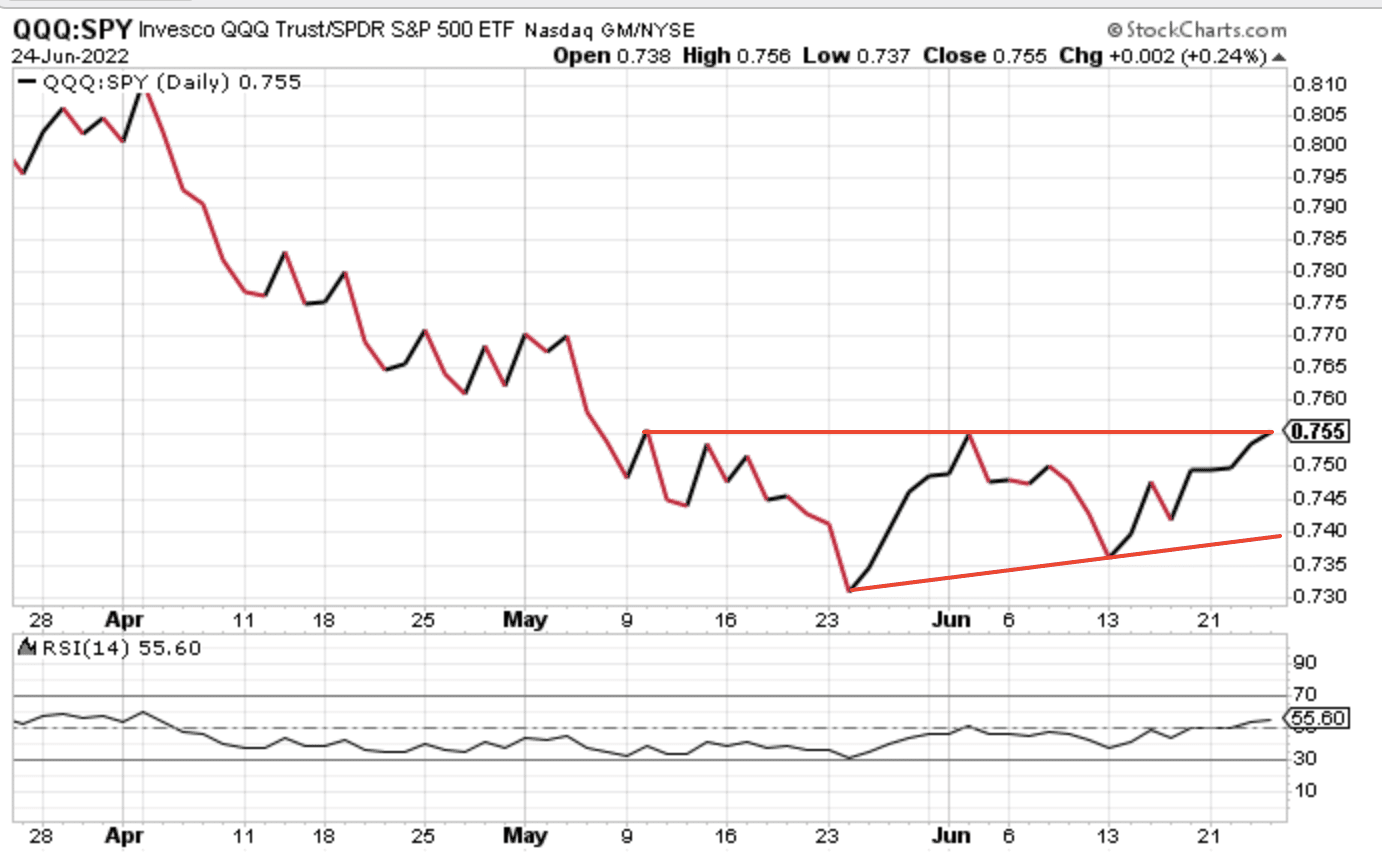
Research Report Excerpt #9
Like other analyzed performance ratios above, while the indexes have made lower lows in June, the QQQ:SPY performance ratio has not. As identified in the chart also is where the performance ratio finished the week, at a clear resistance level. What I would point out, and what may be FORESHADOWING follow through in the coming week/s, is the 14-day RSI was higher on Friday than it was each time the performance ratio hit this resistance level in the past (bottom panel). This tends to lean more favorably for the bulls. The burden of proof for downside and new lows for this performance ratio now leans against the bears. Naturally, these charts do not predict the future, but rather recognize the developing situation.


