The S&P 500 (SPX) managed another significant achievement post the fastest bear market plunge in history on Tuesday with a climb back to and above 2,920. But, with that milestone achievement and edging closer to a 61.8% Fibonacci retracement level, off the lows in March, the benchmark index quickly reversed all of it’s morning gains to fall ~.5% on the day.
Volume picked up a bit versus recent positive sessions, suggesting that traders are using the hurdle overhead to sell into and through the end of month period, which is typically associated with portfolio rebalancing. The MACD histogram continues to decline, hinting of an imminent sell signal with respect to this momentum indicator. The 200-day moving average overhead remains an important hurdle as any rejection from this long-term average could lead to the break of the rising rebound trend from the March low.

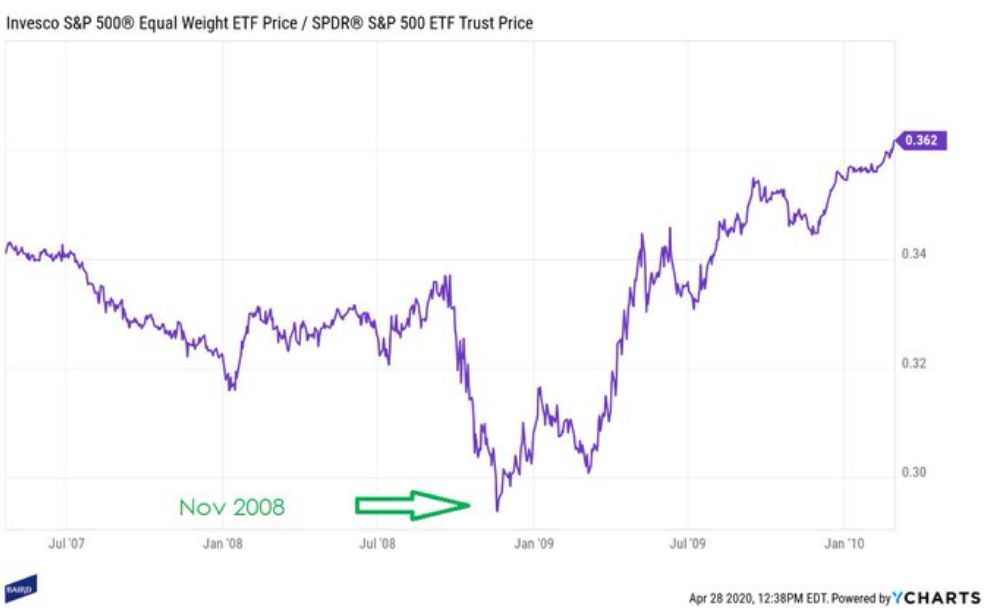
As it was on Monday, the Equal-weight S&P 500 also outperformed the Cap-weighted S&P 500 by leaps and bounds on Tuesday. This proved the second day in a row where the smaller stocks within the S&P 500 outperformed their peer large caps.
This is a positive developing situation within the index, but it should be recognized as typical of bear markets near month-end. Here are all 2-day periods where Equal-weight beat Cap-weight by just 2% or more: 4/28/2020 3/25/2020 4/13/2009 4/9/2009 4/3/2009 1/6/2009 7/3/2006. Simply by looking at the many occurrences surrounding January and April 2009, we also recognize this came after the bear market low of 666 in March of 2009 also. (Chart of RSP/SPY from 2008-2009)
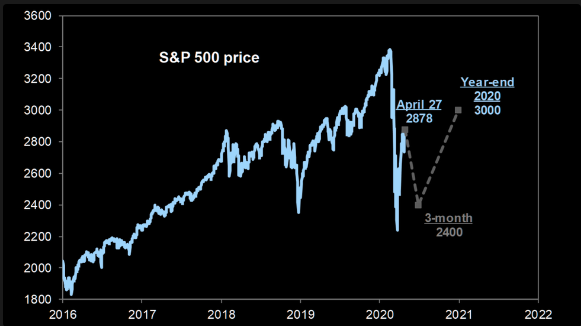
Now let’s not get too excited, we still anticipate choppy waters ahead for investors with some consolidation of this 4-week+ long relief rally near-term. And we’re not the only one carrying such sentiment. Goldman Sachs still has the path of the U.S. equity market in 2020 to be re-test of lows and then higher highs. According to the firm, the S&P 500 will fall to 2400 mid-year before rallying to 3000 at year-end.
After a sharp reversal on Tuesday, the S&P 500 remains higher by nearly 13% in the month of April. This is the best month for the benchmark index since January 1987 at just over 13.2% back then. And while we discussed the forces at play that have resulted in such a strong relief rally in April, the rally has largely been concentrated amongst safety sectors and technology. Furthermore, participation has been as scarce as volume in the S&P 500.
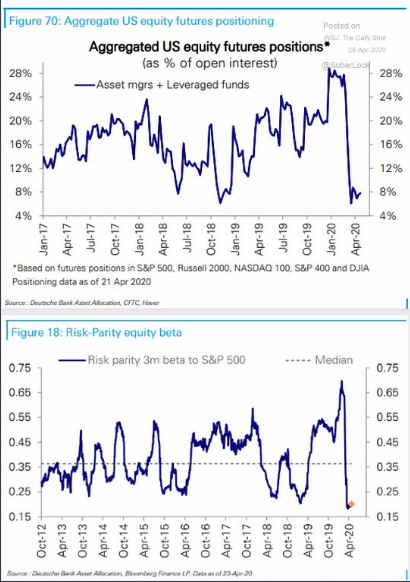
Hedge funds’ positioning remains quite defensive, which has supported the rally, believe it or not!
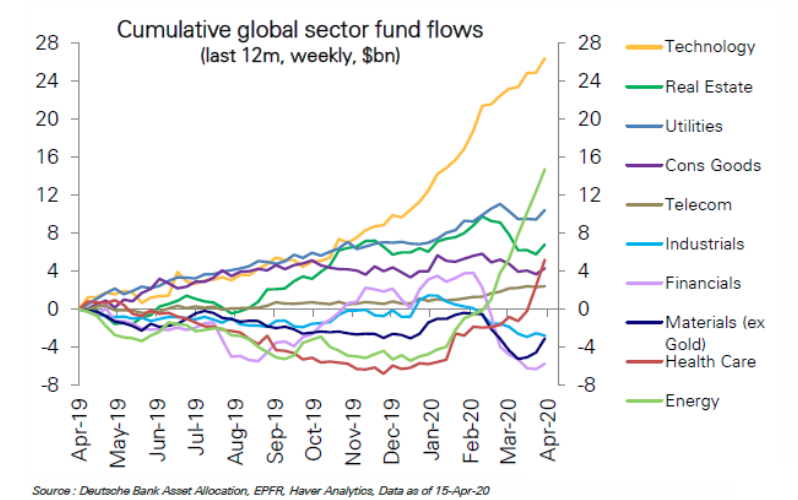
Very interesting chart from Binky Chadha’s weekly report at DB identifies where the fund flows have been concentrated:
- Huge disparity between Tech flows and almost everything else – a winner-take-all market.
- Energy climbing fast *but* investors bought WAY too early & are trapped with heavy losses.
Moreover, equities are up ~29% from the lows, but positioning is still very cautious. Mutual funds’ cash holdings are record high and neither systematic investors nor Hedge Funds have bought the dip. Market breadth remained narrow and ‘risk-off’ during the rally, with Quality/Growth outperforming Value. As the crowded safety trades worked all the way YTD, most mutual funds are beating their benchmark.
- US money market balances stand at US$4.7 trillion. Bank deposits have surged.
- Short interest in equity futures is high.
- Implied volatility relative to credit and equity risk premiums is high.
- Hedge fund net leverage is very low.
- Most survey and sentiment indicators are still just off record pessimism
- All suggest that investors are approaching the current market with caution
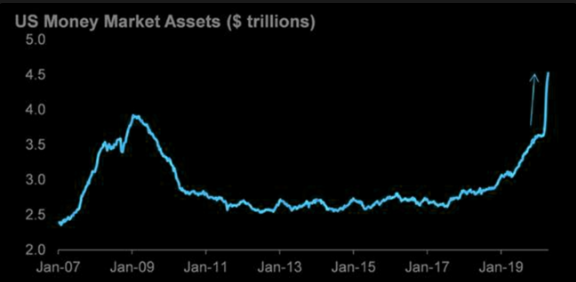
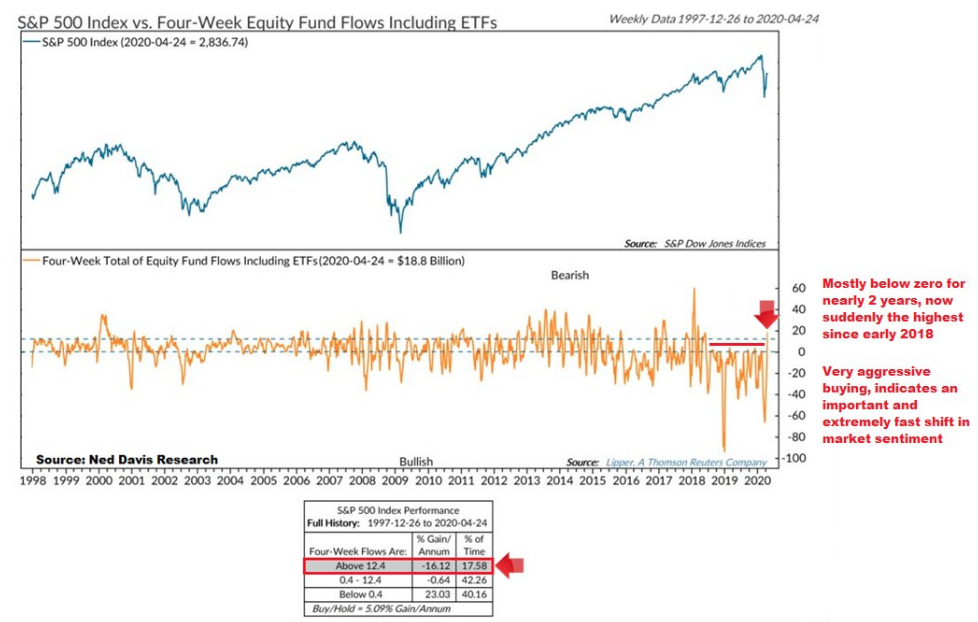
While we can see how much money continues to pile into Money Market funds, basically cash on the sidelines, the last 4 weeks have found Equity ETFs also finding positive fund flows. The following chart from MacroCharts paints a good picture of such a breadth thrust in fund flows that has previously accompanied strong market performances. Recall something our chief market strategist Seth Golden discussed with Tony Dwyer of Canaccord Genuity just this past weekend:
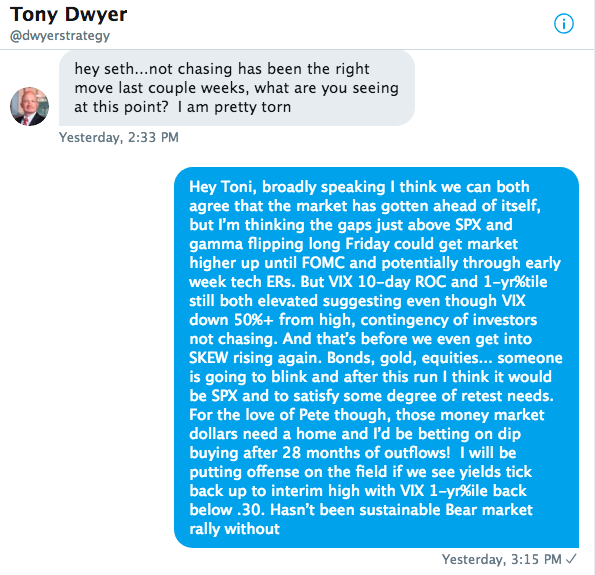
“For the love of Pete though, those money market dollars need a home and I’d be betting on dip buying after 28 months of outflows. I will be putting offense on the field if we see yields tick back up to interim highs with VIX 1-yr%ile back below .30.”
Again, Golden recognizes the sizable outflows from Equity ETFs over the last 2+ years, which MacroCharts now identifies as recently finding positive inflows over the last 4-weeks, fueling some of the 4-week+ rally.
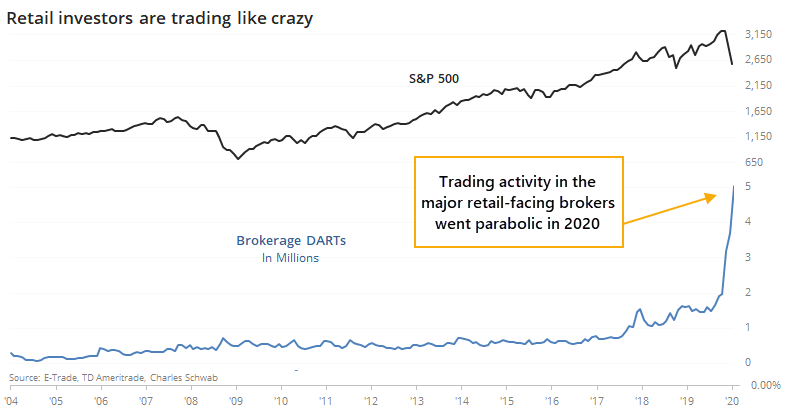
Who is buying the equity market rally remains highly speculative, but we do know that Hedge Funds have been selling into this rally for 8 of the last 10 trading sessions, according to BofAML prime brokerage accounts. We also know that free commission trading has brought about renewed retail investor trading activity in 2020. In February, we saw that retail investors were busy trading stocks. Activity in the major retail-facing brokers had exploded once all major brokerages went to free commission trading.
Nonetheless, since February and the bear market decline, just-released data shows that not only did investors pare back during the decline, but they doubled down. Activity in March was more than double what it was just a few months prior.
According to SentimenTrader’s Aggregating the Daily Average Revenue Trades (DARTs) for E-Trade, TD Ameritrade, and Schwab data series, we can see that the explosion in activity that was no doubt triggered by free commissions continued unabated as the pandemic unfolded.
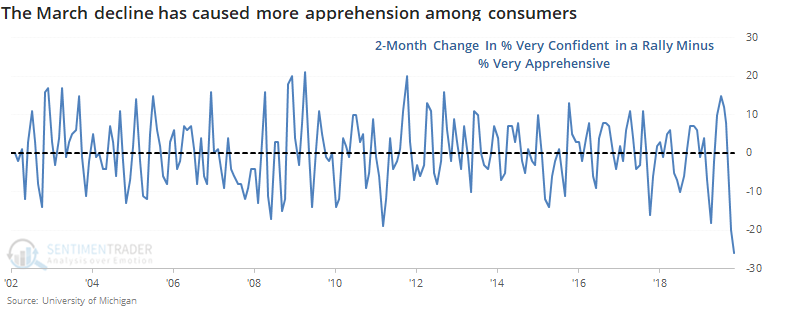
Here’s something that we also found interesting in the latest University of Michigan Consumer survey. According to survey respondents, investors have pared back their expectations for stocks. In February, we saw that consumers had never been more confident about a continuing rally. Over the past two months, they’ve reduced those expectations quite a lot.
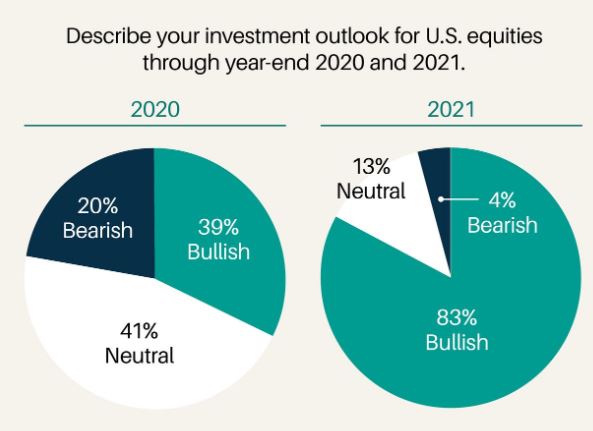
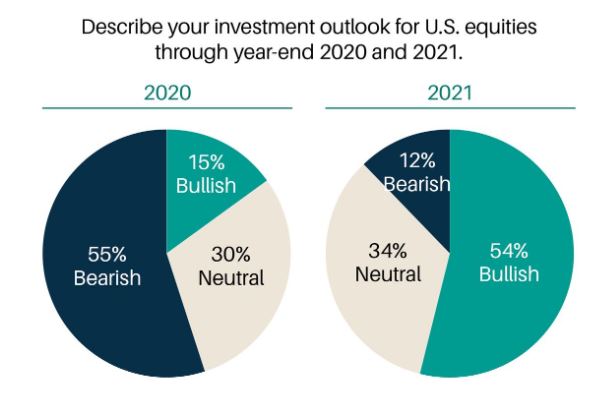
This more pessimistic survey result was also mirrored in results from the latest Barron’s survey of investor sentiment. Barron’s ran their biannual Big Money Poll this weekend. Investors were asked to describe their outlook for U.S. equities through the rest of this year and for 2021. The results for 2021 are eye-opening; 83% are bullish, just 4% are bearish.
The way that one money manager described his outlook perfectly encapsulates the state of the American investor:
“In the grand scheme of things, I’m bullish. It’s a vote of confidence in America,” says Kevin Grimes, president and chief investment officer of Grimes & Co. in Westborough, Mass. “I have confidence in our scientists and our business leaders. I also have confidence in the American consumer. While some habits and patterns may be different in a postpandemic world, we believe that a lot of the demand has been pushed out, instead of eliminated.”
Interestingly enough, Barron’s asked the same question of its readers, which we could argue are the same class of consumers polled by the University of Michigan. Turns out that readers have a much different opinion on the market than the pros. Nearly three times as many readers than professionals said they are bearish on stocks for the duration of 2020. The bias here is pretty clear when we understand that fund mangers still have a job while many consumers and average households have lost their job/s. Simply put, it’s hard to be bullish when you’ve been laid off.
And if you are the average consumer whom just lost his/her job, the last thing you’re concerned with or finding favor for is buying stocks. It’s still a rough world out their right now despite what the equity market is suggesting. Maybe this is one of the main reasons alcohol consumption has significantly risen from mid-March through mid-April. According to Cowen, alcohol sales grew 39.6% in the 4-weeks ended 04/18, which was meaningfully above the 22.3% growth seen over the last 12 weeks.
- Bourbon: +46.6% * Gin: +48.6% * Irish whiskey +59.7% * Vodka: +29.4% * Rum: 32.9% * Tequila +64.0% “the fastest growing spirit in the category”.
The average consumer has been hit hard by the COVID-19 economic crisis. The consumer confidence index sank this month to 86.9 points from a revised 118.8 in March, a bit worse than economists polled by MarketWatch expected. That’s the lowest level since 2014. Americans were very pessimistic about what’s happening in the country right now, but they were more hopeful that the economy would begin to recover in the near future, according to the survey produced by the Conference Board.
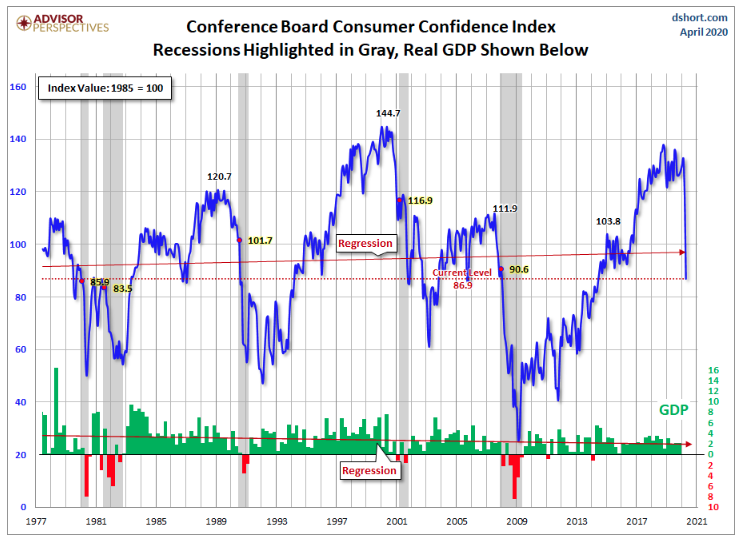
An index that measures how Americans feel about the economy right now plummeted to 76.4 from 166.7. That was also a record decline and easily so. Those who said jobs are “plentiful” slumped to 20% from 43.3% while those who said jobs are “hard to get” rose to 33.6% from 13.8%. Yet another index that measures future expectations—the next six months—actually improved to 93.8 from 86.8 in March.
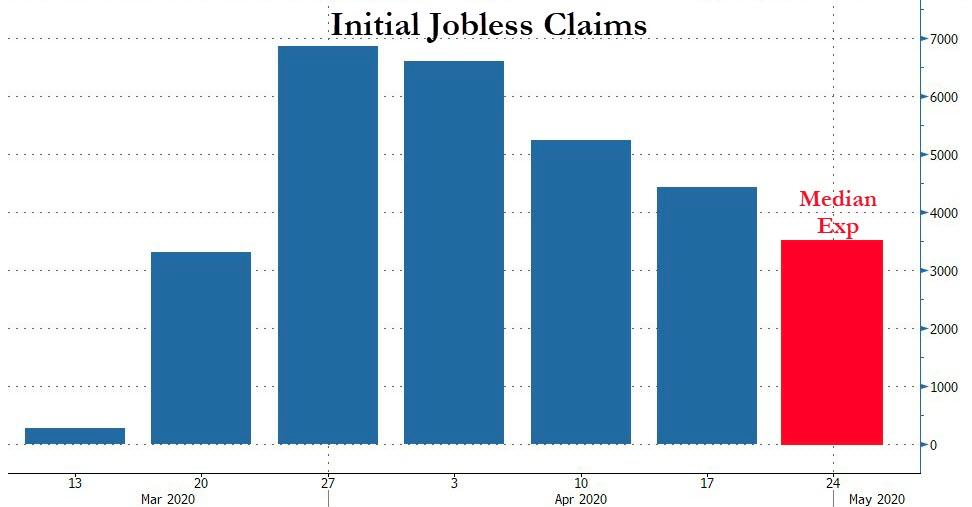
It’s all about jobs folks! Lost employment equates to a plunge in consumer sentiment readings. This is a no-brainer of course. Official statistics show that 26.5 million people have applied for unemployment benefits since mid-March, wiping out all of the jobs gained during the longest employment boom in U.S. history, and another 3.5 million initial claims are expected to be filed this week. The actual unemployed could be much higher than the BLS tracking from jobless claims.
According to an online poll by Economic Policy Institute, millions of Americans who have been thrown out of work during the coronavirus pandemic have been unable to register for unemployment benefits. The poll found that for every 10 people who have successfully filed unemployment claims, three or four people have been unable to register and another two people have not tried to apply at a time of acute economic crisis. The unemployment system was never designed or constructed to process so many claims in such a brief period of time, as we’re experiencing today.
EPI’s survey indicates that an additional 8.9 million to 13.9 million people have been shut out of the system, said Ben Zipperer, the study’s lead author, which means that as of this week, just shy of 50 million American have lost their job since the start of March.
“This study validates the anecdotes and news reports we’re seeing about people having trouble filing for benefits they need and deserve,” Zipperer said.
Among the reasons why idled workers have been unable to get in the “pipeline”, they claim they have encountered downed websites and clogged phone lines, as the state governments that administer the program have been overwhelmed by applicants.
“It’s a shame how you work for so many years and then when you need it, you can’t get it,” said Jim Hewes, 48, who said he was unable to file a claim online for more than two weeks after he was furloughed from his job at an Orlando, Florida, second-hand store in March. Hewes said he mailed off a paper application on April 9 but had not heard back from the state.
There’s not a lot of good news out there other than the epidemic curve has indeed flattened and regional economies are reopening for business. This is likely going to be a slow process for the reopening phase of the pandemic crisis. Investors should expect some degree of disappointment in the reopening process coupled with flagrant and hyperbolic media headlines.
Wednesday is going to prove another interesting and possibly topsy turvy day in the market for investors and traders. It’s the first look at how bad economic growth may have been during the Q1 period, coupled with an FOMC rate announcement and press conference.
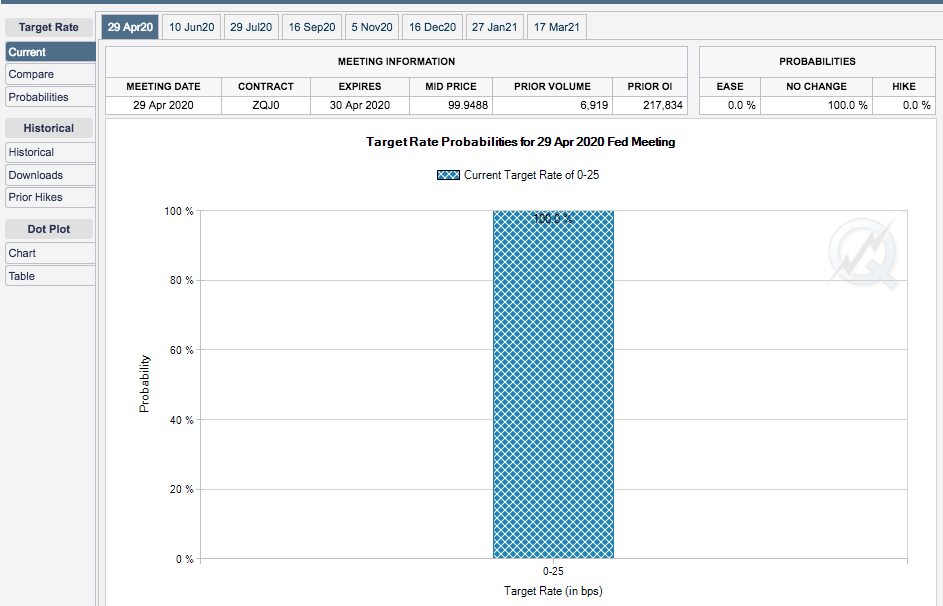
As shown in the chart from the CME’s FedWatch Tool above, there is no probability that exists whereby the Fed will adjust rates at today’s meeting. The press conference that follows the rate announcement is going to be a key focus for market participants today. Jerome Powell’s market performance on “Fed Days” is not a good one, but it has improved of late. Here are some thoughts from analysts and firms regarding Jerome Powell’s presser, which begins at 2:30 p.m. EST:
Mizzuho
- For the Fed we expect Powell to attempt to instil confidence that although the Fed has scaled back its purchases after a very heavy start, strong support for all the asset classes that are being bought will still remain. This should confirm to the market that US rates are looking at a lower volatility regime ahead, resembling that of EGBs and JGBs. Further policy changes are a low probability, but we expect the rhetoric to be decidedly dovish. With an unlimited UST purchase program the Fed is moving into the realms of MMT, and is operating somewhat of an implicit yield curve control policy, just without explicit targets on yields. This meeting may see rhetoric edge slightly towards more explicit YCC. Expect discussion of how the easing that has already taken place can feed into a quick recovery, with emphasis that Fed asset purchases can keep those markets contained, and the recovery accompanying this can allow stocks to keep rallying.
J.P. Morgan
- Future Fed actions will depend on the level of interest rates. If 10-year interest rates remain low (below 1%) then we expect Fed purchases will slow down to a relatively slow pace of $50bn a month, or $2-3 billion a day. If rates move higher in the face of a weak or deteriorating economic outlook, then we would see the Fed considering larger purchases or more aggressive forward guidance, perhaps conditioning rate hikes on an inflation overshoot.
Financial Times Publication
- Is Powell still optimistic about the second half? – since the last meeting oil has crashed…
- Any new guidance on rates? – negative rates are not relevant at the moment for the US…
- Will there be more tapering? From $75 bn per day to “only $10 bn per day…things have improved (and TYVIX has crashed)…
- Any tweaks to the credit plans? when are all the systems in place…
- Is there a message for Congress? interesting one Powell probably needs to address.
Mark Cabana from Bank of America
A new Bank of America chart shows the Federal Reserve is buying fewer Treasurys and mortgage-backed securities. It doesn’t mean the Fed is stepping back from its aggressive policy to help financial system whether the coronavirus pandemic.
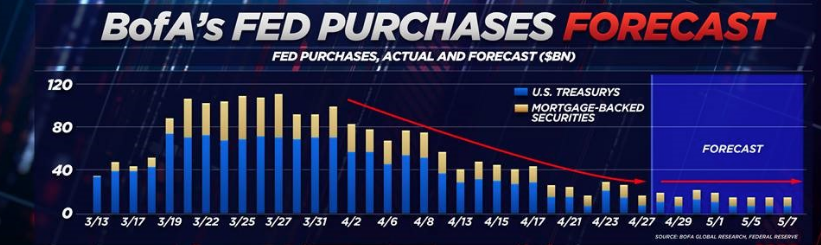
“What we have seen is that the Fed has really increased the pace of purchases in mid-March to address market functioning issues both in the Treasury and mortgage markets,” the firm’s head of US rates strategy told CNBC’s “Trading Nation” on Tuesday. “Since the start of April, they’ve been tapering or reducing that pace of purchase to a rate that’s now $10 billion a day in the Treasury market.”
“We think that the Fed will announce an intention to modestly slow the pace of purchases to about $7.5 billion a day or about $150 billion a month. We think they will indicate that they are planning to stick with this amount to support market functioning and also to try to provide stimulus for the economy.”
Finom Group anticipates another volatile day for equities given the Fed press conference coinciding with month-end rebalancing. In fact when we more predominantly focus on month-end rebalancing, we can suggest that has been what has taken place on Monday and Tuesday, and set to carry on through Wednesday and Thursday at least. It’s no coincidence that Equal-weight is now outperforming Cap-weight S&P 500. It’s no coincidence that sectors that had been underperforming are now outperforming. I mean seriously look at the retail and energy sector ETFs (XRT/XLE) the last 2 trading sessions at least. Shut in and shut down and yet both have materially outperformed Technology and Healthcare sector ETFs (XLK/XLV). This is rebalancing folks, this is rebalancing.
Bespoke Investment Group does a really good job of showing this rebalancing and shift in fund flows this week. The recent performance of sector ETFs noting how Health Care has led the way higher rising the furthest above its 50-DMA. Consumer Discretionary (XLY), Technology (XLK), Materials (XLB), Communication Services (XLC), and Consumer Staples (XLP) each had also risen above their 50-DMAs. Given their outperformance, as shown in the table below, headed into today these were the sectors closest to their levels on the S&P 500’s last all-time high on February 19th. The Health Care ETF (XLV) actually headed into today less than 2% away from its 2/19 levels and XLP was also under 10% away.

Today, that performance was turned on its head as some of the sectors that have been playing catch up outperformed while those that have been the outperformers recently underperformed. Whereas it has typically been the strongest sector, Health Care (XLV) actually fell the most dropping ~2%. On the other hand, Energy (XLE) rose over 2.1% and it even finally rose above its 50-DMA. Other areas of strength today included Financials, Industrials, and Materials which all finished up over 1%. Recent winners were the losers today while the recent laggards were today’s winners.”

It’s clear that investors have been trimming winners in technology, communication services and health care while going after beaten up sectors of the market. That’s rebalancing! If you were thinking of buying on the immediacy of month end rebalancing… you might rethink that for just the time being. Month End Pension Rebalance as of last night’s close is $34b of U.S. Equities for sale. This is the largest monthly rebalancing we have on record (2nd largest monthly we have on record was $21b for sale in January of 2018). This is exactly the opposite of the buying pressure we saw at quarter-end Pension Rebalance from March. And we saw how powerful that rebalancing pressure was, pushing stocks materially higher into the end of March. To really put a fine point on this subject matter: Total shares traded across all U.S. exchanges are at 11.3b shares w/ MTD avgerage sitting at 21.2b shares, so potential price impact of rebalancing flows is quite significant. There is some offset to the selling pressure, however, coming from the CTA (Commodity Trading Advisor) community. If the S&P 500 hits 2,925, this is where CTAs pivot from short to long. Estimated initial size though is rather small. CTAs would purchase $6b over the week and $13b over the month.
Patience folks, patience. Don’t let FOMO guide your capital allocation decision-making. Let discipline and information flow be your guide.
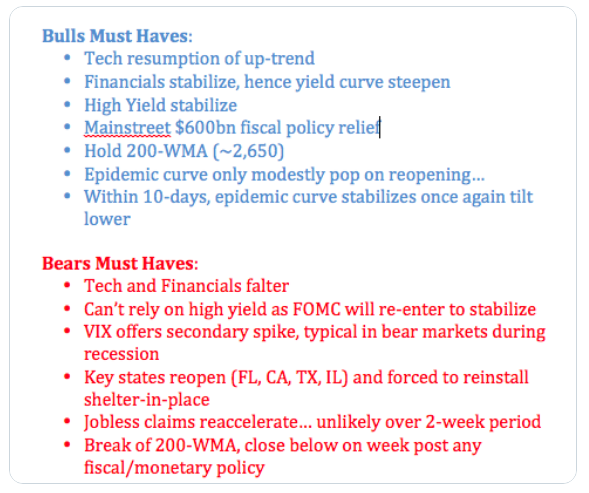
Lastly, but certainly not least, here is a note from Seth Golden regarding the bull vs. bear market battle that will wager on in perpetuity. From his tweet just last night: