
We are off to a strong year in the markets with the S&P 500 (SPX) up roughly 3.5% since January 2nd… and that would be the bare naked truth if it weren’t for the fact that we began the year with a bear market that began late last year. The current snap back rally for equity markets globally and in a vacuum has been rather remarkable, but it has to be understood for greater context, as most global markets achieved bear market territory in 2018. Nonetheless it is a new year and some degree of investor confidence has been found more favorable and with liquidity having returned to the market place. Last week alone found the S&P 500 up 2.5% and as investors were continuing to “buy the dip”. How long will this return of investor optimism last will likely be correlated to earnings season, which will begin this week as the financial sector commences reporting.
Although the S&P 500 is up roughly 3.5% for the year, it remains in a bear market as depicted in the chart. Additionally, with last week’s 65-point rally, the index remains 11.41% below the record low, but off of the December lows by roughly 10 percent.
“Look, we’re up like 10% since the day before Christmas and there’s more overhead resistance than my SAT scores so yea, a few down sessions are inevitable,” wrote Michael Antonelli, managing director of institutional sales and trading at Robert W. Baird & Co., in a Thursday financial blog.
“If I had to guess what market prognosticators are expecting I’d lean towards ‘retest in the coming months’ over ‘that was the low’ but we’ll only know in hindsight and that’s what makes stock market investing so hard,” he wrote.”
Many investors, analysts and market strategists believe that at some point in the not too distant future, a retest of the December lows (2,351) will occur. Finom Group discussed the reasons and rationale for this to probably occur in recent articles, but it’s not a guaranteed occurrence to be clear. Market Symmetry is a factor of human behavior and/or psychology. We are creatures of habit and the market tends to express human, habitual behaviors if not for confirmation bias alone. Even so, the S&P 500 is up more than 10% over the past 12 days. So let’s look at what the historic forward returns were under such conditions.
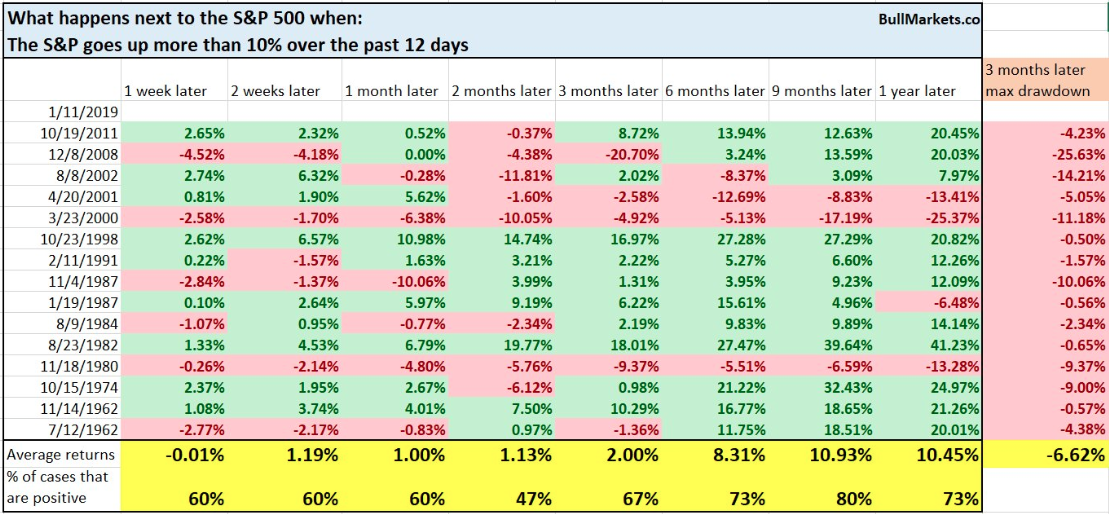
As depicted in the table above by Bullmarkets.co, forward returns were no different than random. But look at the max drawdowns within the table and off to the right side of the table. Within 3 months, the average max drawdown for the S&P 500 was -6.6 percent. Why? Firstly, the S&P 500 rarely rallies this hard under normal conditions. It tends to only rally in this manner after deeply oversold conditions and as a reflexive reaction to the former declines. Secondly, this type of rally (snap back rally) tends to find a retest of former lows in the following weeks or months.
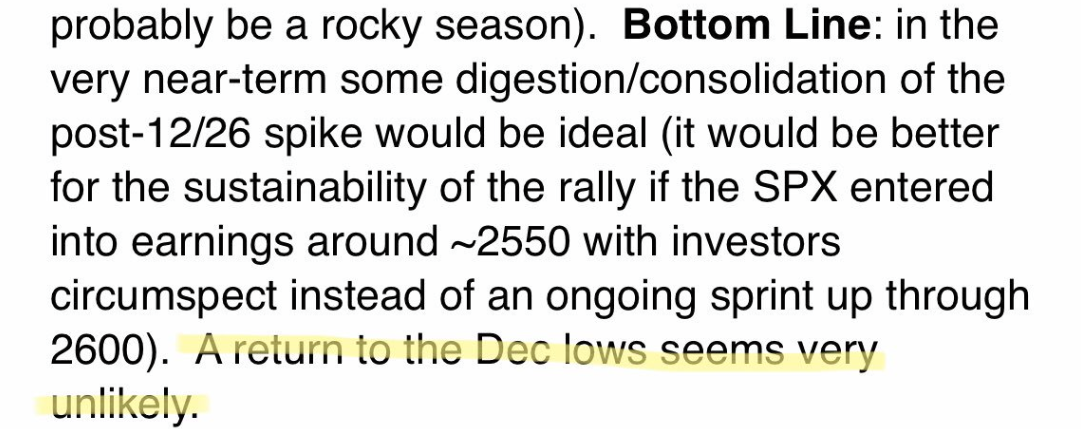
While many suggest a double-bottom is inevitable, a note over the weekend from J.P. Morgan Chase (JPM) suggest no double-bottom according to certain of the firm’s weekend notes.
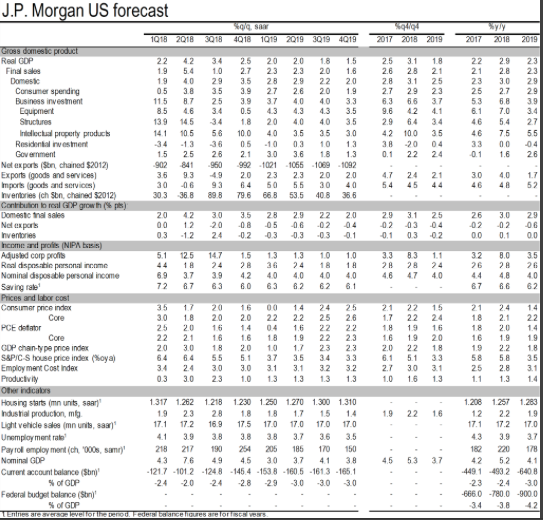
While certain analysts at J.P. Morgan Chase are leaning more bullish on equities in 2019, their economists are seeing more headwinds to the economy in Q1 2019 than previously forecasted. The firm has cut U.S. GDP projection for Q1 from 2.25% to 2.0% due to impact of ongoing shutdown of the Federal government. In the firm’s notes it suggests that each week the government is shut down subtracts 0.1-0.2% from quarterly GDP growth. “Since output of government sector is not priced & sold in the market, it has to be inferred by number of hours worked.” (See JPM forecast table below)
Government Shutdown
While equities have seemingly shrugged off the partial government shutdown in the New Year, it will likely become increasingly worrisome as some 800,000 federal workers failed to receive their first paycheck for the shutdown period. Affected employees are expected to lose an estimated $2.2 billion every paycheck, according to the Center for American Progress. Back-pay for unpaid workers is customary, but not guaranteed. It’s only a matter of time before the issues relate to the shutdown and its furloughed employees impacts consumer spending, credit and the overall economy as pointed out in the J.P. Morgan Chase notes.
The government shutdown seems to have no end in sight as the opposing sides, President Trump and Congress, have polarizing views on Trump’s sought after border wall. For the 800,000 furloughed government employees, some of who are living pay check-pay check, they are possibly failing to make mortgage/rent and/or credit card payments. And there is additional fall-out beyond just the furloughed employees. The millions of Americans who receive food stamps might only have until February before the Supplemental Nutrition Assistance Program runs out of funding because of the partial shutdown. We could quite literally drone on and on about the increasingly concerning impact of a government shutdown on the economy and if it persists, but in doing so we also have to consider how it eventually affects the stock market.
As mentioned earlier, the market is off to a spectacular 2019, but its long-term performance is not correlated to one macro or geopolitical factor. With the bad there is always the good to consider! And what are some of the good to consider you might be asking?
- Since Fed Chair Jerome Powell used the word “patient” last week when referring to the Fed’s approach to hiking interest rates, stocks have gained five straight days. There had been a big disconnect between what the Fed was saying and what markets believed. That seems to have been alleviated now.
- Oil prices ($51.70 a barrel to end the week) have stabilized after crashing in the fourth quarter of 2018. OPEC is doing what it can to stabilize the commodity, and things appear to have calmed down substantially.
- The U.S. Dollar Index has fallen sharply in the last several weeks.
- Mortgage rates hit a 9-month low recently.
- Trade talks with China are continuing, and we think there’s a good chance there could be some type of deal over the coming months, as the pressure is mounting on both sides to find a resolution.
- Following the 2.7% sell-off in the S&P 500 December 24, stocks gained more than 10% in 10 days. You have to go back to July 2009 to find the last time stocks were up that much in 10 days. That wasn’t the worst time to be long stocks.
- Valuations have dropped significantly, and historically this has been a bullish event.
- The S&P 500 was up nearly 3% after the first five trading days in 2019. Since 1950, when the S&P 500 was up more than 1.1% after the first five days of the year, each of those years closed higher 23 out of 23 times before 2018.
- After a midterm election year low (as in 2018), the S&P 500 has been higher a year later every time going back to 1950. We now know the S&P 500 low in 2018 was December 24, and history suggests there’s a good chance stocks will be higher by the same time this year.
If truth were told, nobody can express with any degree of certainty the fallout of the government shutdown. In short, I’m sure everyone would appreciate its conclusion and the equity markets would likely find it beneficial, as one more headwind is removed.
S&P 500: Upon Further Review
The S&P 500 had a 65-point move in the previous week, just outside the 60-point weekly expected move. Although it exceeded the weekly expected move, it was only by a few points and expressed market efficiency. This was the 2nd week in a row whereby the S&P 500 finished within or right around the weekly expected move. Signs of market stabilization are being presented as option and risk pricing becomes more efficient. We can also see this market stability forming in the collapse of the VIX, which peaked at just over 36 in December and has crashed to 18.19 as of this past Friday. Both option/risk pricing in the S&P 500 options and a sub-20 VIX are net positives for investors and traders presently.
On Tuesday this past week, the NYSE experienced a “Zweig breadth thrust.” Created by Marty Zweig, his eponymous indicator occurs when the 10-day average percentage of advancers swings from less than 40% to over 61% within 10 days. As Tom McClellan says, “It is a sign that a rapid surge of money is trying to push its way through the door to get into the market.” Since 1962, there have only been 11 Zweig breadth thrusts.
The forward results are impressive when this occurs. Since 1970, the S&P 500 has continued to rally every time over the next 20 days by a median of about 6% (Quantifiable Edges).
There are a lot of interesting stats on how the S&P 500 performs going forward after a Zweig breadth thrust occurs. As it pertains to what matters most near term we’ll simply outline the occurrence within the context of a double-bottoming process or even a lower low for the S&P 500.
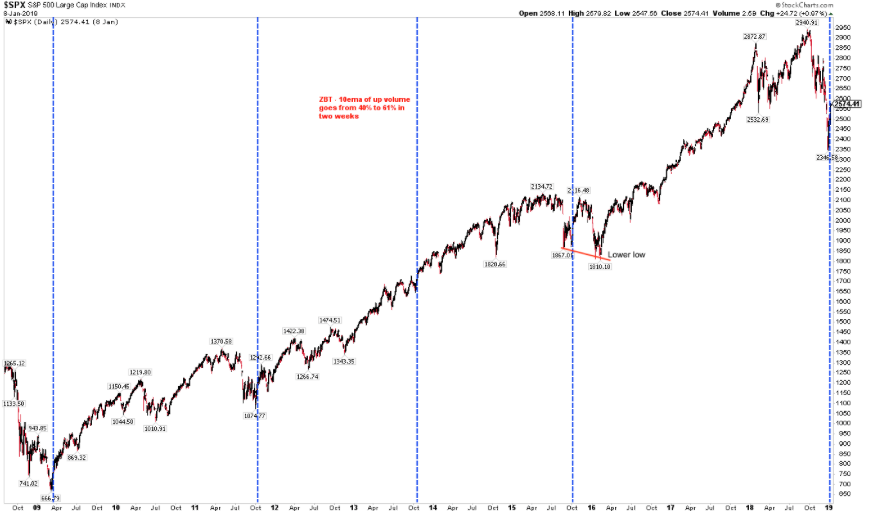
Of the 11 Zweig breadth thrusts in the past 60 years, only one (in 2015) was followed by a lower low before a new high was achieved. In that one instance, the February 2016 low was just 2% below the low on August 2015 (closing basis). Importantly, in between those two dates, SPX came within 1% of its all-time high from May 2015.
The current S&P 500 rally has closed above the most recent support level of 2018 (2,581), which served as a resistance level upon ascension from bear market lows in December 2018. Volume has been modest, but breadth has improved and with a rare Zwieg breadth thrust.
While Finom Group has expressed its understanding and characterization of the present market, we don’t ignore that market characterizations are subjective. A technical bear market to us may not carry weight against the data and breadth indicator cited within this article.
As we enter earnings season this week, it is important to note that the S&P 500 is bound to the strength or weakness of said earnings and FY19 guidance issued. For now, we desire to take a look at what has driven market breadth in the New Year. This will help to either confirm or dismiss such market breadth factors we denoted. Spoiler alert: CONFIRMED!
Fund Flows Show Vast Improvement
Weekly fund flows were positive last week and after a year for which outflows persisted, this is a much welcome investor reading. According to Lipper Fund Flows, for the second week in three, investors were overall net purchasers of fund assets (including those of conventional funds and ETFs), injecting $35.8 billion for Lipper’s fund-flows week ended January 9, 2019. Fund investors were net purchasers of money market funds (+$17.1 billion), equity funds (+$8.7 billion), taxable fixed income funds (+$8.4 billion), and municipal bond funds (+$1.6 billion).
For the third week in four, equity ETFs witnessed net inflows, taking in a little more than $4.3 billion for the most recent fund-flows week. Authorized participants (APs) were net purchasers of domestic equity ETFs (but only to the tune of $744 million), also for the third week in four. SPDR S&P 500 ETF (-$1.3 billion) experienced the largest individual net redemptions, and Consumer Discretionary Select Sector SPDR Fund (-$629 million) suffered the second largest net redemptions of the week. Consumer discretionary has a large retail component that was hit by negative retail preannouncements in the week that was.
For the eighth week in a row, taxable fixed income ETFs witnessed net inflows, taking in $9.3 billion. APs were net purchasers of government-Treasury ETFs (+$6.3 billion) and corporate investment-grade ETFs (+$962 million) while witnessing no net redemptions for the other macro-groups.
While we’d like to see some money coming out of fixed income and the treasury complex, the best part of the fund flow weekly stats came from conventional equity fund flows. For the first week in twenty-nine, conventional fund (ex-ETF) investors were net purchasers of equity funds, injecting $4.4 billion (their largest weekly net inflows since June 20, 2018). Domestic equity funds, taking in a little less than $3.3 billion, witnessed their second weekly net inflows in three while posting a 3.99% return on average for the fund-flows week. Their non-domestic equity fund counterparts, posting a 4.08% return on average, witnessed their first weekly net inflows since September 19, 2018, (+$1.1 billion this past week). On the domestic equity side, fund investors embraced large-cap funds (+$2.5 billion net) and mid-cap funds (+$458 million), while on the non-domestic equity side investors were net purchasers of international equity funds (+$1.4 billion).
Last but not least, as it pertains to the general positive undertones and performance of the market of late, we’ll take a look at investor sentiment as reported through the weekly American Association of Individual Investors survey.
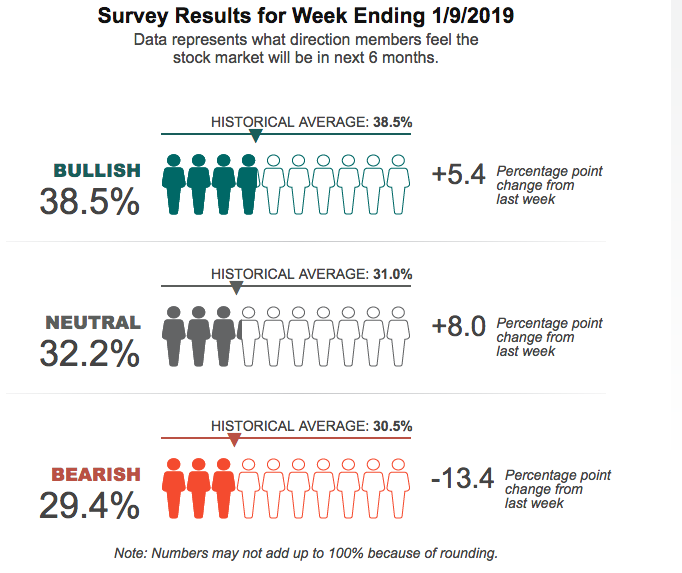
While bullish sentiment has improved greatly in the last two weeks, it’s still hovering at relatively low levels when compared to the underlying economic and corporate earnings fundamentals. Bearish sentiment, expectations that stock prices will fall over the next six months, fell by 13.4 percentage points to 29.4 percent in the latest survey results.
Q4 2018 Reporting Season
Earnings expectations and forecasts have come down for not only the FY19 period, but even the Q4 2018 period, which is set to be announced this coming week. When we now take a look at the Thomson Reuters Q4 2018 forecast for S&P 500 corporate earnings growth, it has declined from just two weeks ago. Prior to the New Year, Thomson Reuters estimated earnings growth rate for the S&P 500 for 18Q4 was 15.8 percent and revenue growth was expected to come in at 8.7% and now …
- Fourth quarter earnings are expected to increase 14.7% from Q4 2017. Excluding the energy sector, the earnings growth estimate declines to 12.7%.
- Of the 20 companies in the S&P 500 that have reported earnings to date for Q4 2018, 90.0% have reported earnings above analyst expectations. This is above the long-term average of 64% and above the prior four quarter average of 78%
- The Q4 2018 blended revenue growth estimate is 5.8%. Excluding the energy sector, the revenue growth estimate declines to 4.9%.
We all know what has impacted Reuters forecast for both earnings and revenue growth for Q4 2018, Apple’s pre-announcement of a significant revenue shortfall. To a great degree, however, the market has largely discounted an earnings growth slowdown for not only Q4 2018, but for FY19. With that said, investors still need the additional information from earnings season and with regards to FY19 earnings and revenue guidance. Fortunately, we’ll have a better indication on this subject matter this coming week and as earnings season progresses.
When we quickly review FactSet’s Q4 2018 S&P 500 earnings forecast, we see a similar lowering of expectations as we saw in Reuter’s forecast. For Q4 2018, the blended earnings growth rate for the S&P 500 is 10.6 percent. If 10.6% is the actual growth rate for the quarter, it will mark the fifth straight quarter of double-digit earnings growth for the index. On December 31, the estimated earnings growth rate for Q4 2018 was 12.3 percent.
Macro factors have been mentioned by CEOs and CFOs on recent earnings calls as earnings season begins, (Only 4% of S&P 500 companies have reported to-date). Although the trade feud has garnered the greatest amount of headlines in 2018 by the financial media, it isn’t the most impactful headwind viewed by CEOs.
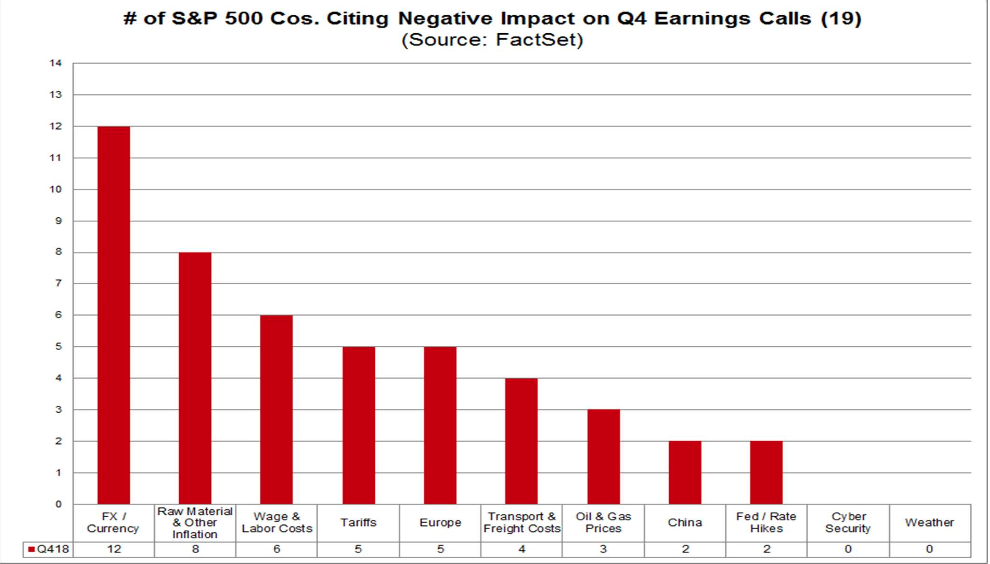
Foreign exchange has been cited by more than 60% of the companies (12) that have reported to date as a factor that either had a negative impact on earnings or revenues in Q4 or is expected to have a negative impact on earnings and revenues in future quarters. It’s for this reason we continue to monitor and detail the movement in the U.S. Dollar Index, which has been declining favorably of late.
In terms of 2019 S&P 500 corporate earnings and revenues, FactSet is now forecasting earnings growth of just 6.9% and revenue growth of just 5.5%, both revised lower from the previous week. The forward 12-month P/E ratio is 15.1. This P/E ratio is below the 5-year average of 16.4 but above the 10-year average of 14.6. It is also above the forward 12-month P/E ratio of 14.4 recorded at the end of the fourth quarter (December 31). Since the end of the fourth quarter (December 31), the price of the index has decreased by 3.6%, while the forward 12-month EPS estimate has decreased by 0.9 percent. By and large, it would be hard to argue the S&P 500 is expensive on a forward 12-month P/E ratio, unless of course earnings guidance underperforms expectations.
Final Thoughts
Fund flows and market breadth has greatly improved alongside a seemingly more dovish FOMC that has expressed, on many occasions now, the willingness and even desire to pause rate hikes. Inflation is not a concern and below the Fed’s target rate. With the Fed now on the sidelines, the notion of the Fed put is back on the table so-to-speak. This also brings about the idea of not fighting the Fed. If the Fed is continuing to backstop the economy and subsequently backstopping market declines, these portend well for equity investors longer-term.


