
The prior week for equity investors and the major averages was shaping up to be a strong week, that is, until the markets hit a wall. The latter trading days, Thursday and Friday, found a lack of buyers and more selling pressure, which ultimately drove the S&P 500 below its 50-DMA once again and in negative territory for the year.
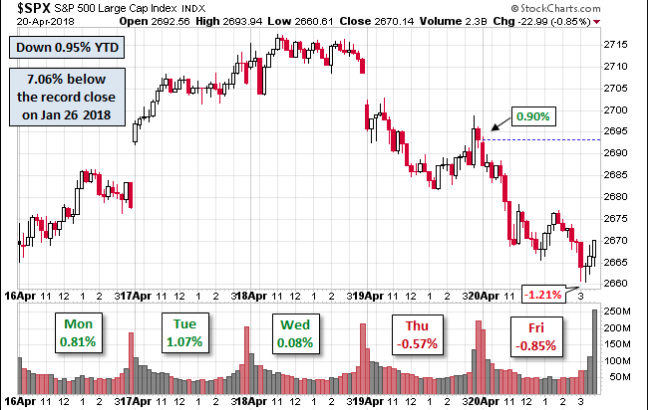
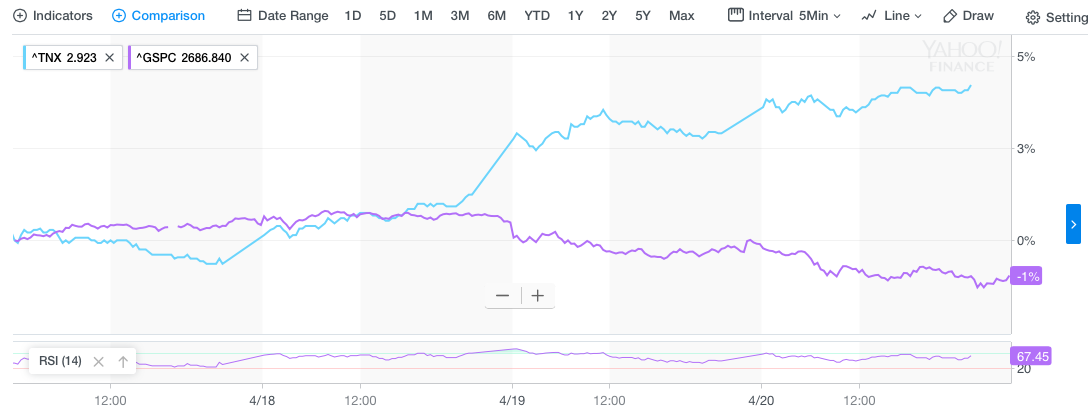
Two major forces have been at work since early February and keeping the major averages from marching higher. Those forces have been geopolitics and rising rates. Last week’s trading was indicative of just how heavily weighted the fear of rising rates was among investors. As it was with the prior chart of the S&P 500 trading week it is with the following chart depicting last week’s move in the 10-year Treasury yield.
The fear amongst investors is that the yield curve will ultimately invert, forecasting a pending economic recession. An inverted curve, where shorter-dated yields exceed those for longer-dated debt, brings about fear amongst investors because it has faithfully preceded all recessions since 1960. But…
The truth is, historically when the yield curve has inverted, markets have still performed well over the next 12-18 months and prior to an actual recession taking place. Raymond James analyst Andrew Adams argues that not every narrowing yield spread between the 2s and 10s results in an inversion, and that some of the best stock-market performance has come amid such flattening yield trends as indicated in the chart below, identifying the S&P rising through a flattening and inverted yield curve.
“It is true that all recessions since 1960 have been preceded by an inverted yield curve (commonly defined these days as when the 2-Year U.S. Treasury yields more than the 10-Year U.S. Treasury), but the problem is that too many people have recently been expanding this relationship to a flattening yield curve as well. Yes, the yield curve has been flattening—the spread between the 10-Year and 2-Year has narrowed from ~130 basis points at the beginning of 2017 to 48 basis points now—but crossing the inversion point is far from imminent. A yield curve as flat as it is now does not always lead to an inverted yield curve and even if it does, the lag time can be years before it occurs. What’s more, some of the best stock market returns in history have come after the yield curve became flatter than it is now, including after 1984, 1988, 1994, and 2005 (see chart 2 on page 2; arrows in lower S&P 500 panel represent when the 10-2 spread first became as narrow as it is currently). In fact, the 10-2 spread was relatively flat for the entirety of the 1994-2000 periods, the greatest stock market run in history. So, are we worried about the yield curve signaling a possible recession is on the way? No, not at this stage.”
Now with the Fed unwinding its balance sheet and the Fed’s inflation target likely to be achieved in 2018, yields are marching higher in what may be seen as a more sustainable manner and for cause. The Fed’s dot plot indicates 3 rate hikes for 2018, pushing Fed rates to 200-225 basis points. At present, that remains the forecast and is also presumed in the CME’s Fed Watch Tool, which prices out Fed Futures in monthly contracts. The main concern for investors being an implementation of a 4th rate hike in 2018 is becoming more realized by Fed Futures, as shown in the CME’s December FFZ8 contract.
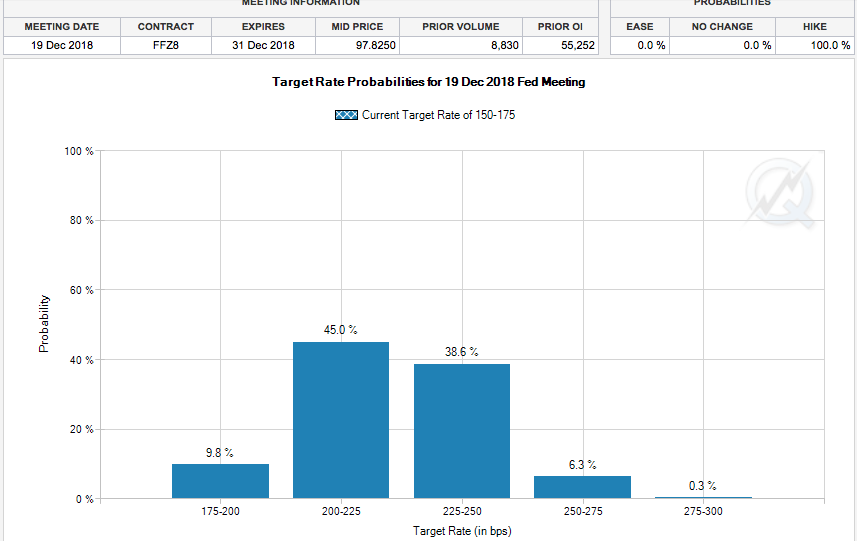 Unless something proves to impact the December contract negatively in the coming months, the likelihood for an increasing probability of a 4th rate hike may improve. Reflation is currently at-hand although expected and still quite modest historically, but in the face of an extended bull market and economic cycle investors are more cautious than ever. The Fed is not giving investors many reasons to believe they will moderate their rate hike path currently. Last week’s Beige Book indicated… “Steady as she goes!”
“Robust” business borrowing, rising consumer spending, and tight labor markets indicate the U.S. economy remains on track for continued growth.
In its periodic “Beige Book” summary of contacts with businesses in its 12 regional districts, the Fed said the overall outlook among businesses “remained positive,” but that many were worried about the Trump administration’s use of tariffs.
“Contacts in various sectors including manufacturing, agriculture, and transportation expressed concern about the newly imposed and/or proposed tariffs,” the central bank said in its report, which covered the period from March to early April.
Markedly stronger growth in loan volumes was seen in commercial and industrial, and commercial real estate,” the Dallas Fed reported.
There are a number of headwinds or macro-factors that markets are contending with and next week’s earnings results may prove to direct investors and markets as to what direction we’re ultimately heading for the year. It will be a very busy earnings week, but also on the agenda next week is a look at Q1 2018 GDP.
The first-quarter may have been marred by a number of factors, but none more important than consumer spending. In the early stages of 2018, Americans curtailed spending to rebuild their bank accounts after the savings rate fell to a 12-year low. As a result, the increase in consumer spending in the first quarter could drop to as low as 1 percent. Consumer spending accounts for some 70% of GDP and after a stellar Q4 2017 shopping spree, consumers spending found itself in need of paying down credit card bills from the holidays.
In terms of expectations for GDP results, the economy likely decelerated to a growth rate of about 2% from a greater pace of 2.9%, 3.2% and 3.1% in the prior three quarters, according to a MarketWatch survey.
With the financial sector largely having reported results last week and in the rear view mirror, the focus now shifts to the large tech titans. The anticipation for strong tech earnings comes as the sector has fallen on hard times, which subsequently has proven to lead the broader markets lower. As such, all eyes and ears will be focusing in on Google’s parent company Alphabet come Monday. Wall Street sees EPS growing 20% to $9.31, with revenue rising 22.5% to $30.31 billion. Some analysts are looking for Alphabet management’s commentary on growing regulatory risk and data privacy issues in the wake of government scrutiny of Facebook. The results are expected after the closing bell. Investors are hoping for strong results to kick-off the trading week and elevate the major indexes. The following are just a few tech titans and other major reports that will be anticipated this week:
- Facebook: The consensus estimate on EPS is $1.36, up 30.8%, on revenue of $11.4 billion, up 43%.
- Amazon: Thursday, with Wall Street looking for EPS of $1.19, down 19.6%, on revenue of $50.16 billion, up 40.4%.
- Microsoft: Thursday. Analysts expect EPS of 85 cents, up 16.4%, on sales of $25.71 billion, also up 16.4%, for the March quarter.
- EBay (EBAY) and PayPal (PYPL) are both set to announce earnings after the market close Wednesday. The consensus estimate on EPS is 53 cents, up 8%, on revenue of $2.59 billion, up 16%. EBay received a strong upgrade and price target increase from Morgan Stanley on Wednesday, based on its recent partnership with payment processor Adyen, as it moves away from PayPal. The consensus estimate on PayPal’s EPS is 54 cents, up 22.7%, on revenue of $3.59 billion, up 21%.
- Texas Instruments (TXN) on Tuesday, Advanced Micro Devices (AMD) and Qualcomm (QCOM) on Wednesday, and Intel (INTC) on Thursday. Analysts expect TI to earn $1.11 a share, up 14% year over year, on sales of $3.65 billion, up 7%. AMD is seen earning 9 cents a share, reversing a year-earlier loss of 4 cents a share, on sales of $1.57 billion, up 59%. Qualcomm is expected to earn 70 cents a share, down 48%, on sales of $5.19 billion, up a fraction. Intel is predicted to earn 72 cents a share, up 9%, on sales of $15.05 billion, up 2%.
The push and pull presently taking place in the market has served to compress multiple expansion, but also gives investors an opportunity to acquire good companies with strong fundamentals and balance sheets. There remains no more truer and determining factor, historically, for equity prices than earnings. And speaking of earnings, let’s round out this latest research report with the most recently updated S&P 500 earnings forecast by Thomson Reuters as noted below:
Aggregate Estimates and Revisions

It was only a week ago, that Thomson Reuters had forecasted Q1 2018 earnings to grow by 18.6 percent. The updated forecast of 20% earnings growth comes on the heels of better than expected reporting from the financial sector, which is also expected to be found in tech sector reports. The revisions for Q1 2018 earnings have come throughout Q1, but still have yet to find the major averages recapturing January 2018 highs.
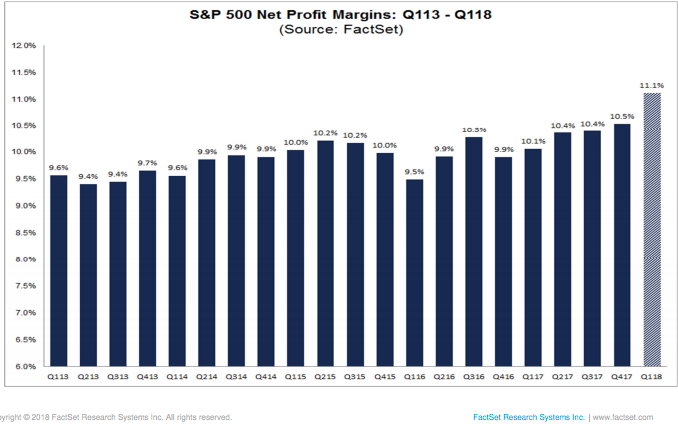
The blended net profit margin for the S&P 500 for Q1 2018 is 11.1 percent. If 11.1% is the actual net profit margin for the quarter, it will mark the highest net profit margin for the S&P 500 since Q3 2008, according to FactSet.
Regardless the market environment and investor sentiment, there is always a trade to be made. Finom Group found such a trade in shares of Target (TGT) late last week and delivered the idea through our private twitter feed for subscribers. The alert is depicted below:

After buying shares of TGT on Thursday’s dip last week, we were able to sell upon Friday’s market opening for a nice scalping profit, even as the broader market endured a sell-off. The opportunity to recapture shares in TGT may be at-hand once again, although a better and more defined opportunity with SPDR S&P Retail ETF (XRT). Subscribe to finomgroup.com today and take advantage of our weekly trading activity and research reports!


