
Are equities about to fall from grace after a seemingly prolonged rally? If you ask two prominent analysts, they seem to believe “the end is near”. The S&P 500 has extended its New Year rally into the current week and after breaking through and closing above a key resistance level last Friday. The feat of strength has come with a good deal of negative market correlations, divergences, light volumes and lesser liquidity than one might think, albeit greater liquidity than what was found in December 2018. Who has been buying into this market rally? Well, we know who hasn’t been.
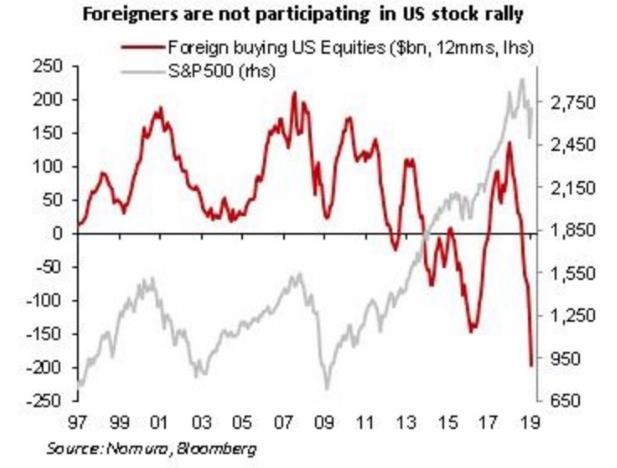
Clearly foreigners haven’t been buying into the rally and even with pension funds initiating new market positions after the Christmas Eve 2018 debacle, their positioning remains very light. According to J.P. Morgan Chase (JPM), when it comes to total equity exposure, equity positioning is still light as many investors remain on the sideline since the Q4 sell-off, awaiting confirmation of the US/China trade deal (given multiple false-positives thus far) before repositioning their portfolios. For example, equity exposure of systematic strategies and Hedge Funds is only ~25th percentile, and US equity funds have continued to see outflows this year following on from record outflows in December.
“This backdrop – low positioning, the high likelihood of a trade pact, and dovish monetary policy – should pave the way for further outperformance of risky assets.”
But for every bullish market thesis we certainly have near-term prognostications for market turmoil and pending declines. Nomura’s Charlie McElligott has been making the case for the market to begin its precipitous decline for many weeks now. The analyst’s rhetoric has been ramping up in March and recently been highlighted by Zero Hedge with a thematic “Ides of March” characterization, a warning of sorts. Last week, McElligott offered updated notes on his Ides of March thesis that centered on the pending shift from bullish positioning to bearish positioning, a rally fueled by corporate share repurchase programs and Quantitative Tightening that was still a process in motion and that would be increasing in the coming weeks.
On Monday, McElligott continued with his bearish outlook with new insights. And what better time to do so than during a FOMC meeting week? Specifically, Nomura expects the FOMC to:
- Substantially revise their interest rate forecast LOWER, in conjunction with downward revisions to the Committee’s Growth- and Inflation- forecasts
- Further clarify their intent to see the balance-sheet runoff complete in October (timing largely related to the Federal debt limit, which will impact the level of reserves in the banking system)
- Keep the aggregate size of the B-S “fixed” for a period thereafter, which will lead to gradual further declines in reserves
- Continue to allow its MBS to run-off (most importantly for my STEEPENER view, we believe that starting-in October, MBS amortizations will be used to purchase the front-end via newly-issued T-Bills as per our “Reverse Operation Twist” thesis, which inherently is a curve steepener—yet still likely with the operational particulars not yet likely to be announced by this week’s meeting)
Finom Group has articulated its concerns surrounding market positioning during this prolonged rebound in 2019. With fund flows a net negative on the year and at their lowest levels since 2008, it’s clear that light positioning, algorithmic trading and corporate buybacks are fueling the rally. To that extent, McElligott believes the flows will serve to impact the markets more negatively than in the recent past. McElligott now suggests that equities are a pure “flow show“, with the derivative strategist warning that following last week’s euphoric burst higher, the coming 2-4 week “window” set a stage for a potential supply/demand pivot, as a result of the following six factors.
- Recall that in Finom Group’s Research Report that we outlined the fund flow stats YTD and with an update for the previous week, which identified capital inflows for the week.
McElligott is of the opinion that while this seems like a positive pivot in flows, it may actually represent late cycle participation that proves contrarian to market direction near-term. Nomura subsequently defined this massive inflow into stocks as a “QE-type fund flows capitulation” from investors (largest 1w inflow for USEQ Passive-, Institutional -and Overall- of the past 12m), and noted that last week’s inflow represented a “100th percentile” US Equities inflow in the history of EPFR fund flow at $25.5B—the 4th largest weekly US Equities inflow in history (data back to 2002). This type of capitulation, however, is concerning because as Deustche Bank noted over the weekend, in a majority of episodes surging inflows were a contrarian indicator. 6 out of the 9 episodes saw the S&P 500 fall an average of -5.9% over the course of the following one month, accompanied by outflows.
- While dealer delta-hedging (see top) helped boost risk assets higher into the seasonal pre-Op-Ex ramp up, with quad-witching in the rear-view mirror, going forward dealer delta-hedging demand fades per standard post Op-Ex seasonality (as McElligott explains there is “less Gamma in the market with 25% of SPX options rolling-off, with SPX / SPY Calls OI in particular -31% WoW”)
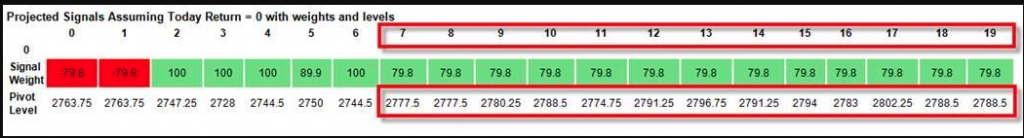
- Another note highlighted by McElligott in the past two weeks has been that as stocks rise, so do CTA sell triggers; in fact, the CTA / Trend “sell triggers” across US stocks “jump” closer to spot by the end of the week and hold-higher looking out the next 3w / 4w. In fact, as shown below, all else equal, within 17 days, the S&P “sell” trigger level will rise as high as 2,802, meaning even a modest downdraft in stocks will results in an accelerated move to the downside as CTAs engage sell programs. Incidentally, S&P CTAs are currently “100% long”, and would resume selling under 2745.9 to get to 56%, more selling under 2700.37 to get to -100%, flip to short under 2700.65, max short under 2700.37
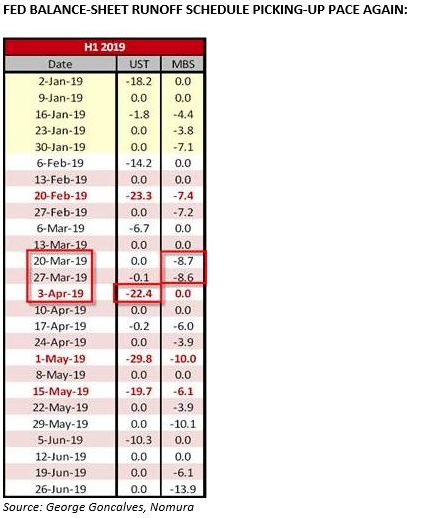
- Even though investors have already pivoted “From QT back to QE”, McElligott warns that – at least until the Fed officially ends the roll off – the ongoing QT/balance-sheet shrinkage is picking-up the pace again, particularly with MBS runoffs to increase meaningfully at the end of the month (-$8.7B March 20th week / -$8.6B March 27th week—and remember, “chunky” MBS roll-offs matter the most for cross-asset volatility), along with a particularly large UST runoff at start April (-$22.4B April 3rd week):
- Unlike the end of 2018 which saw a monster buy-order from Pensions helping to lift stocks in the last days of the year, quarter- and month-end pension rebalancing flows should be particularly significant as SPX has outperform Bonds by over 12% QTD — a 91st %ile move since 1973, according to Nomura, which notes that this “sell equities, buy USTs” flow begins to emerge approximately 5 to 10 days prior to Quarter-end.
McElligott’s colleagues tested this patterns of pensions selling equities, buying bonds by running a backrest in which the “SPX outperforms USTs by > 12.2% on QTD, and contingent on the prior quarter seeing an Equities SELL-OFF” analog, and finds that this “sell Equities” pension rebalancing flow “realizes” in the market ahead of the quarter-end (5 instances: 1980, 1998, 1998, 2003 and 2009) as follows:
- The corporate buyback blackout period begin, with markets “on the margin” seeing the corporate demand significantly reduced over the next 1m into Q1 EPS season.
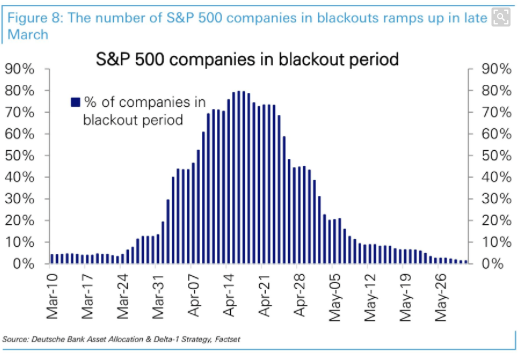
“We are seeing repurchase desks around the Street reference 1Q19 as “THE” largest notional $buyback ever, with last week particularly heavy ahead of the “blackout” commencing in earnest this week (75% of S&P 500 in buyback blackout by 3/19/19)”.
McElligott’s 30-day outlook is most obviously bearish, but it’s more relevant to understand the outlook is a near-term one that he expects to be resolved favorably thereafter. McElligott expects at most a brief pullback as investors flood back in on any more significant drop, mostly due to FOMO. As he explains, his key point regarding this ‘supply/demand shift’ as the markets enter a 1 month pullback window is this: with obvious continued “under-positioning” and thus significantly “under-exposed” to this ongoing Equities re-rack, “I would expect any potential pullback over the next 1m to be shallow and likely ‘get scooped’ on account of performance FOMO”:
- Fundamental L/S (HFR Equities HF Index “20d Beta to SPX” at just 39%);
- Macro HF (Macro Fund “Beta to SPX” at just 9th %ile per internal analysis);
- Risk-Parity investors $exposure to SPX at lows dating-back to Nov16 levels per our internal models;
- Retail with 89 consecutive weeks of OUTFLOWS per EPFR
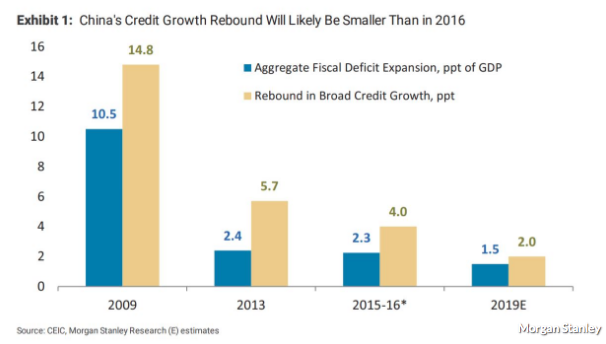
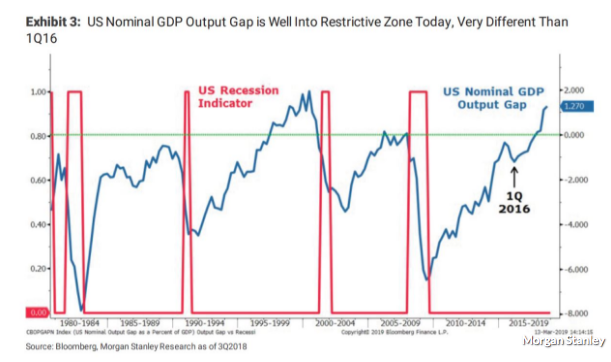
Moreover, McElligott is not the only analyst suggesting a near-term market pullback is a highly probable occurrence. While many investors and analysts are looking at 2016 as a possible model for 2019’s market rebound, Morgan Stanley’s chief equity strategist Mike Wilson warned in a note Monday that there are 3 factors that should prevent a 2016 repeat.
- Significantly tighter monetary policy in the U.S.: Wilson argued, the Federal Reserve “are much further along than they were in early 2016 when they had raised rates only 0.25% cumulatively and weren’t yet contracting the balance sheet.
- Chinese government less committed to stimulus: “China’s stimulus is not as large as in 2016 and is more domestically focused. Our economists believe we are likely to see only half the amount of stimulus this time as measured by the change in broad credit growth.”
- Domestic economy that is operating above capacity: “Most obvious example’ of the U.S. economy running at or beyond its capacity is the labor market. The unemployment rate is near historic lows and we know from reading corporate earnings transcripts that labor costs are increasingly on the minds of management teams.”
Wilson makes a good point with regards to increasing labor costs and it has certainly been a point of emphasis from corporate CEOs. But the concern over input costs has actually been declining according to a Q4 2018 corporate study tied to 2500 conference call transcripts performed by the J.P. Morgan Quant Team, led by Marko Kolanovic.
“Contrary to popular investor narrative, fewer S&P 500 companies are highlighting rising wages as a risk. Labor-intensive industries (typically less specialized workers) remain concerned about the tightening labor market (see Figure 63, Discretionary and Real Estate at cycle highs). On the other hand, sectors that employ a more skilled workforce (Technology, Healthcare, Financials) less frequently discussed labor and wages in company reports. Since the latter makes up ~60% of S&P 500 market cap (and growing), the expanding labor market should be a net positive for S&P 500 profits through rising demand/revenue, which should more than offset wage pressures at this point in the cycle.
To be clear, this is not Wilson’s first or even second warning to market participants. Wilson has been warning investors to approach the year-to-date rally with caution for many weeks now, warning clients as early as January that they should get defensive and prepare for an impending earnings recession (earnings expected to decline by over 3% in Q1 2019).
In fairness, Wilson’s warning from late January only finds the S&P 500 a few percentage points higher, as the market has been somewhat range bound in February and prior to last week’s breakout of sorts.
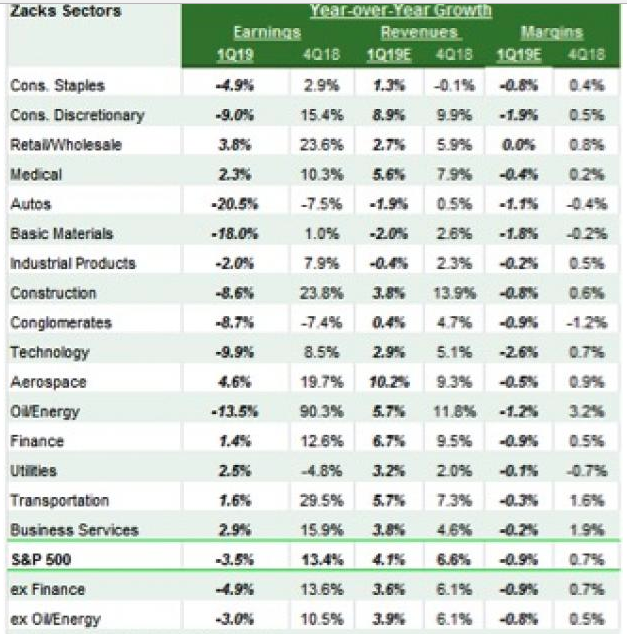
As investors await the Q1 2019 earnings period, most analysts are of the opinion earnings will decline by 3% or worse for the period and represent the first earnings recession since late 2015. For the current week, 7 S&P 500 members with fiscal quarters ending in February are set to report 2019 Q1 results, which include a number of industry leaders like FedEx (FDX), Nike (NKE) and Micron (MU).
One of the bigger factors impacting the Q1 EPS forecast has been the price of oil and the strength of the U.S. Dollar (DXY). According to Zacks Research, the energy sector is expected to produce one of the larger headwinds for earnings in the Q1 period, with a decline in earnings of 13.5% YOY.
Having said that, the price of oil has rebounded in 2019 and is now on par with its Q1 2018 average price per barrel of light sweet crude. (See chart below)
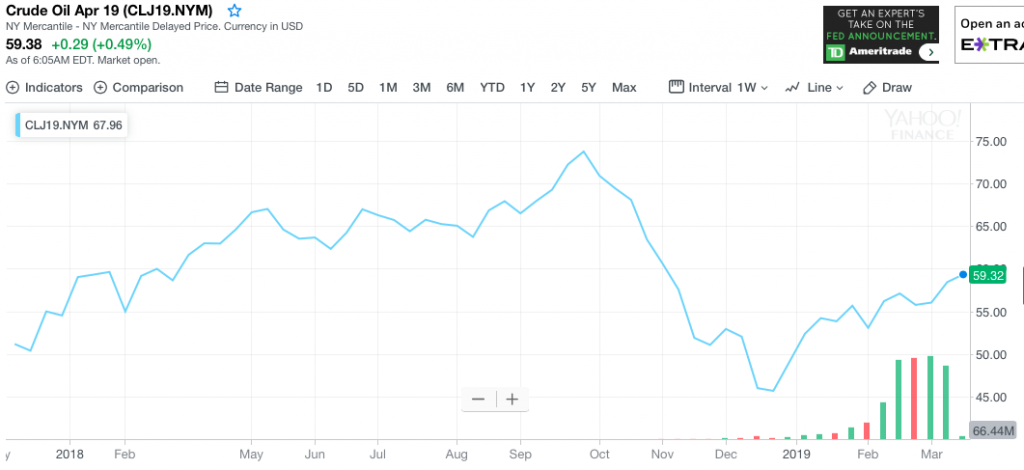
But the price per barrel is also reflecting geopolitical issues that are seemingly moving in a more positive direction. Of course, in this regard we’re looking at a resolution of the U.S./China trade feud. While many questioned the demand side of the equation for pricing crude oil in 2018’s dip in prices, it’s been made clear the issue was a result of supply and not demand. Even as China’s growth continues to slow, the country is growing and so is its demand for crude oil.
In the year before the trade dispute emerged, China had accounted for, on average, around 20% of all U.S. exports, equivalent to over 11 million barrels per month.
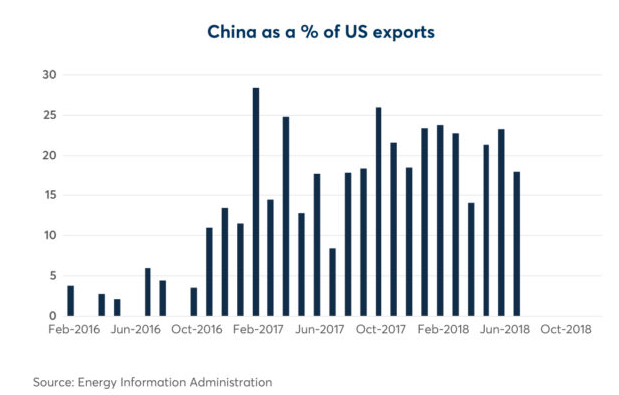
China imported a record 10.4 million barrels per day of crude oil in November and has started this year strongly. Even though there are some doubts about the pace of Chinese economic growth in 2019, China should be a key import market for U.S. crude oil.
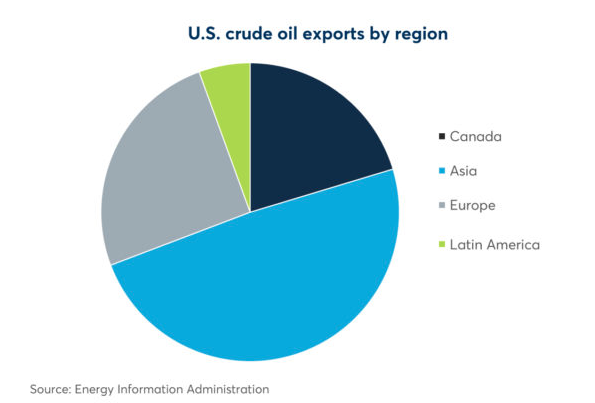
Unfortunately, with the tariffs implemented on China in July of 2018 and since not removed, China did not import a single barrel of U.S. crude oil in December. In fact, the world’s second largest consumer has barely imported any U.S. crude since July 2018. For U.S. exporters, Asia represents their largest opportunity. Economic growth is faster in Asia than in other potential export markets such as Europe, Canada and Latin America. As a result, Asia accounted for around half of all U.S. exports in November, even despite the absence of China.
The energy markets are closely watching the progress of trade negotiations between the two nations, and any signals from the talks are immediately impacting oil prices. China needs ever more energy imports to satisfy its economic development needs. At the same time, the U.S. is setting new records for energy exports on an almost monthly basis.
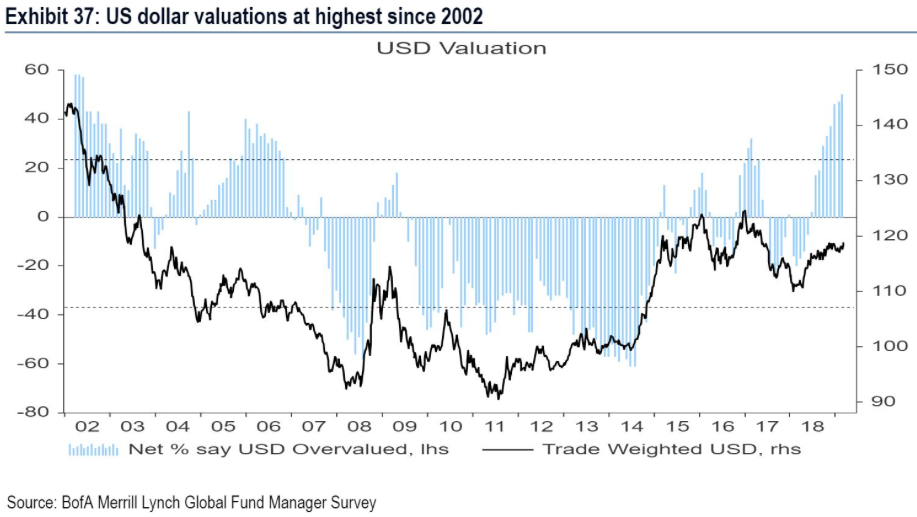
Beyond the price of crude oil, earnings estimates are dependent on the outlook for the U.S. Dollar given that some 50% of U.S. corporate sales are derived overseas. Unfortunately, thus far in 2019 the weakness anticipated for the DXY hasn’t come to pass as of yet. In fact, fund managers suggest the DXY is at its most overvalued level since 2002.
Nonetheless, the DXY has retreated from nearly hitting $98 a couple of weeks ago to its present level of $96.40. It’s clear though, that the current retracement of the DXY’s strength may not be long-lived given the chart below from Adam Mancini.
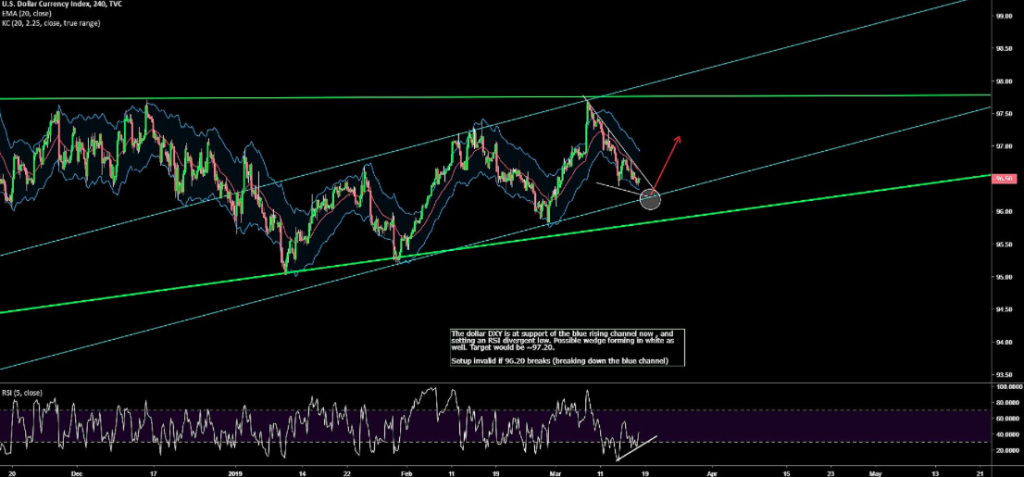
“Stocks have clearly been getting a boost from the DXY selling off since March 8th, but DXY has been in a clean rising channel all year and is now nearing support and its a good zone to see a run back to 97.10ish. Big picture, we’re still consolidating for a large move, noted Mancini.”
Despite the headwinds both domestically and geopolitically for equities in 2019, the rally marches on. There are certainly some green shoots beginning to sprout about the global economy, but roots may need to deepen and earnings results may need to be realized before the next leg of the equity market rally commences. With that being put forth, equity futures are sharply higher Tuesday morning.
Pessimism over the market rally has centered on a great many divergences that find defensive market positioning across the equity and bond market performance spectrum. But even so, some analysts remain with an upbeat market outlook. On Wednesday, Credit Suisse raised their S&P 500 price target for 2019 by 100 points, from 2,925 to 3025.
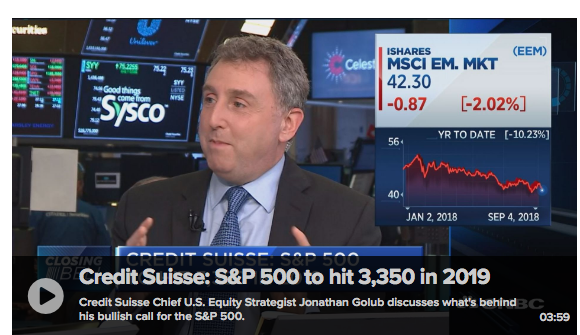
“All the market risks that tanked stocks in December are now “receding,” according to Credit Suisse’s chief U.S. equity strategist, Jonathan Golub.
“Investors might be pleased with the market’s recent performance, but it’s unlikely they find the underlying dynamics—a more favorable risk backdrop, with decelerating economic and earnings growth—particularly inspiring,” Golub said.
“More specifically, less hawkish comments from the Fed, declining inflation and recession fears, and the potential for a resolution to China trade issues are the primary forces driving volatility and spreads lower, and stocks higher,”
Credit Suisse’s new estimates represent an earnings growth rate of 4.4 percent in 2019, versus the Street’s consensus of 3.8 percent growth this year, according to FactSet.
The bank also noted low bond yields are implying a “much higher” market multiple. The forward price-earnings ratio for the S&P 500 is currently at 16.4 times, while the low rates are pointing to 20.4 times, the bank said.
“Our work indicates that investors have not fully re-risked portfolios following 4Q’s turbulence—despite a sharp decline in volatility and spreads—and that valuations will drift higher as they do so.”
Echoing, to some degree, the Credit Suisse analyst upbeat tone is Lindsey Bell, CFRA Investment Strategist. She suggests that earnings for the Q1 2019 period will likely surprise to the upside.
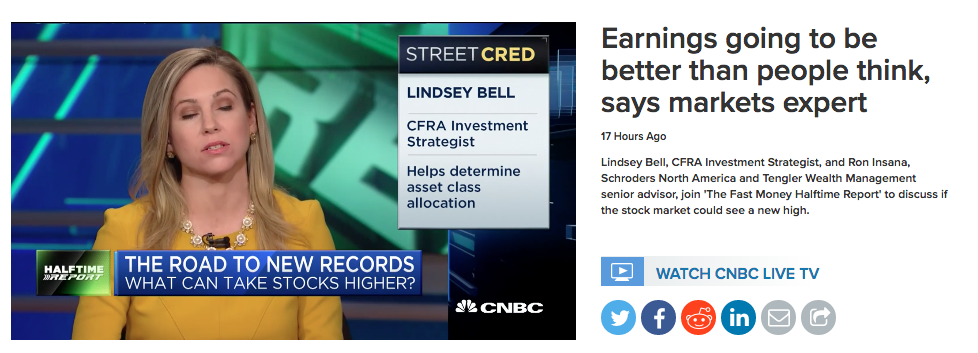
Bell recalls the Q1 2015 expectations for an earning decline that were met with an upside surprise. Will the stars align for a positive surprise this go around for earnings or not remains to be seen? What is clear is that the debate will wager onward and until late April, when earnings season will kick into high gear and with the financial sector reporting.
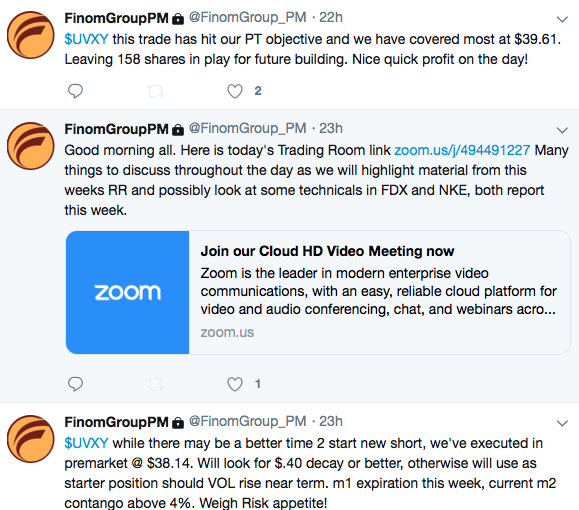
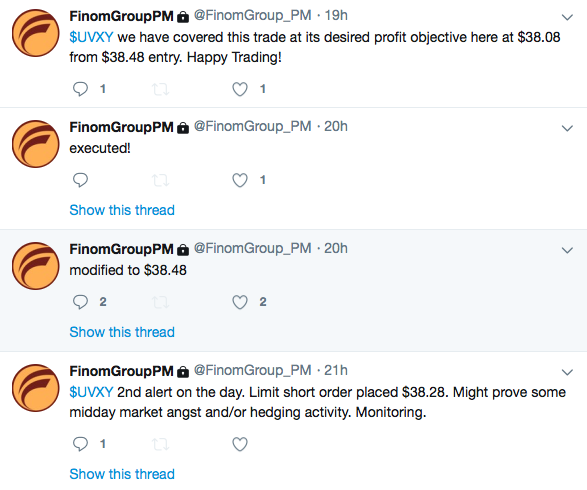
Regardless of what happens inside the markets on any given day, Finom Group will be looking to trade whatever the market delivers. On Monday, and with varied bouts of intraday volatility, we executed and offered the following, 2 separate UVXY trade alerts to subscribers.
While we continue to trade volatility and look for ongoing opportunities within the Volatility complex, we’re also in the “hurt locker” with our latest initiated position in shares of Facebook (FB). Having said that, the longterm potential for Facebook, despite the downgrades and media-centered headlines remains quite positive. No other platform allows brand marketing advertisers access to over 2 billion users across the globe. It’s one of the reasons Facebook cost per ad continues to increase, suggesting any increased cost the company might incur from operations around privacy and regulation would be offset in its unique pricing mote.


