
Where U.S. Treasury Secretary Steve Mnuchin left positive comments on the U.S./China trade feud Wednesday, China picked up the ball and ran with it. With the U.S. President in travels to Osaka, Japan for the G-20 Summit meeting that kicks off on Friday, the South China Morning Post reported that the U.S. and China have tentatively agreed to a tariff truce in order to resume trade talks. Details will reportedly be announced ahead of Saturday’s meeting between Presidents Donald Trump and Xi Jinping.
While U.S. equity futures pointed to a strong day on Wednesday on trade headlines, once Wall Street opened for trading, every bit of the futures gains was lost. While the Nasdaq (NDX) finished the day up 25 points, the S&P 500 (SPX), Dow Jones Industrial Average (DJIA) and Russell 2000 (RUT) all finished in the red. But like Wednesday, the positive spurring of equity futures from trade headlines is once again lifting equity futures on Thursday and on the heels of strength in the overnight trading session in Asia.
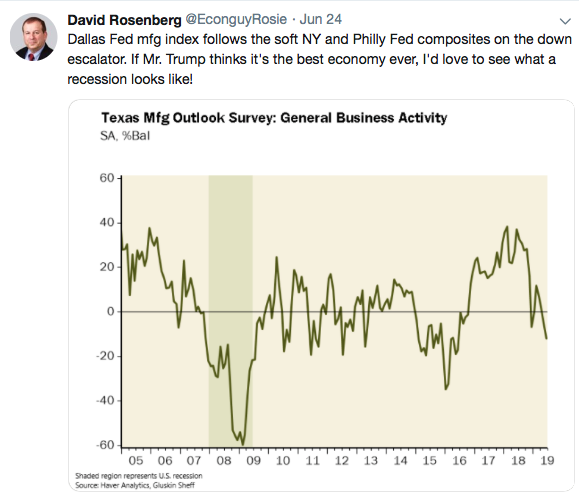
The good news for the market near-term is that it may receive some relief from consequential trade headlines post the G-20 Summit. The bad news is that market investors will find something else to fear. I should rather be more specific by saying the permabears will find something else to fear. One of the more popular fear mongering statistical and surveys that the permabear camp has been marching out of late is all the May manufacturing data. With the Philly Fed, Empire State, Richmond Fed and Dallas Fed manufacturing indexes all tanking in May, it’s been an easy narrative for the bears to proliferate.
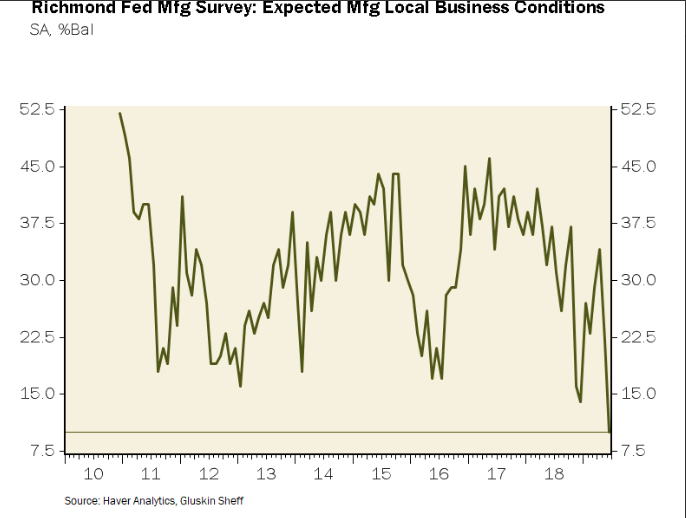
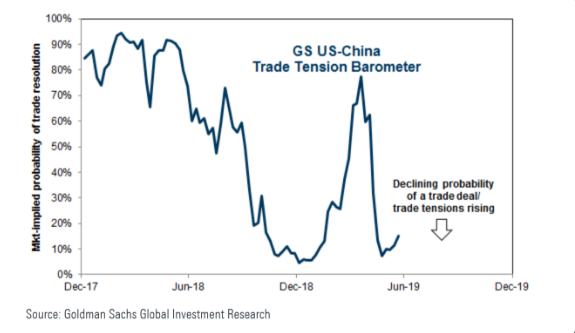
Now, we all know why the May and early June manufacturing data proved to deteriorate from the already waning manufacturing data since H2 2018, levied tariffs between the U.S. and China. With this known issue finding some relief near-term, potentially, greater certainty amongst the business community should find increased business sentiment and capital spending. This could prove a stimulus for the global economy in H2 2019. With regards to the trade feud that is nearly 20 months old, the market and business community has been reeling so long from the feud that the market isn’t even expected an all-inclusive deal. Goldman Sachs chart of the day suggest the market is only pricing in a 15% probability of a trade deal.
Moreover and beyond the trade issues that have weighed down economic activity, the bears have been touting the market weakness amongst the Dow Jones Transports (DJT) and Russell index. Both have been underperforming recently and almost immediately after the S&P 500 hit a new all-time high in June. When it comes to the Russell, there are a few important definitions of the small-cap index investors should understand. They are key to valuing the index against its peers.
The Russell 2000 is a much smaller index than any of its peers. The S&P 500 represents roughly 74% of the total market capitalization of U.S. equities in comparison to the Russell, which is just about 8 percent. The 6 largest components of the Dow have a greater combined market capitalization than all 2000 components of the Russell. Regardless of these facts, the market pundits and/or bears will promote the relevance of the Russell weakness as foreshadowing market doom ahead. While all of the aforementioned is a reality, none of the aforementioned prevents broader market declines. Simply put, however, the Russell doesn’t cause broader market declines and at best it can be symptomatic of risk tolerance.
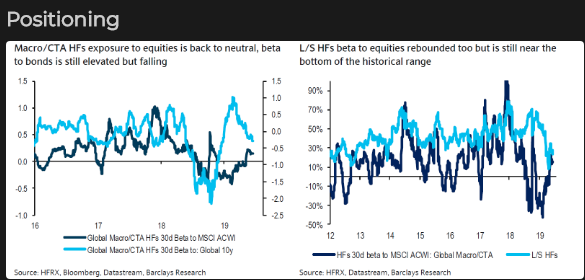
As we’ve discussed and/or outlined since the commenced V-shape bottom in January, fund managers did not position for a V-shaped rally. Equity positioning has been extremely light when compared to a nearly 25% move off the December 2018 bottom. The latest Barclays beta positioning amongst long/short hedge funds shows that beta positioning to equities has rebounded slightly in June, but still remains at the low end of the historic range.
It’s clear that investors haven’t found an appetite for risky assets in 2019, which serves to figure why the Russell has underperformed its peers, even lately. The Russell consists of small companies, much less followed by Wall Street analysts and more speculative in nature. The average beta of the Russell is about 30% higher than the S&P 500. When investors are bullish, you should expect RUT to outperform SPX, as it has most often done into an important top. The reverse is also true when investors are bearish; investors sell speculative small cap stocks into an important low.
In a recent article from Bloomberg, the media outlet adds fuel to the bear camp! Bloomberg offers the relative weakness in the Russell versus the broader market as being an indicator of market weakness that lay ahead.
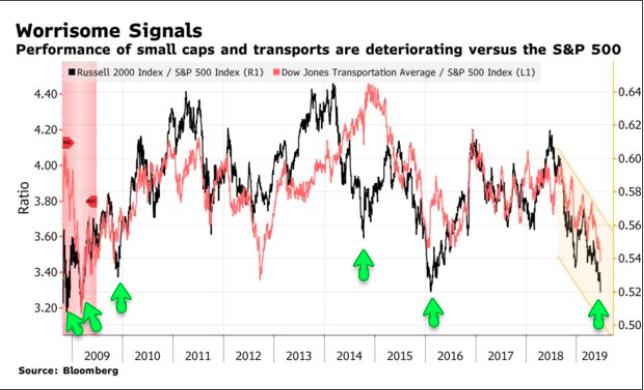
In contrast to the Bloomberg chart, however, the following chart shows the occurrences in the past 11 years where the small-cap index has significantly lagged the S&P 500 (the lower panel is the same as the chart above). Most have not signified economic weakness and the S&P 500 (upper panel) has, in fact, been near a low for the relative time period.
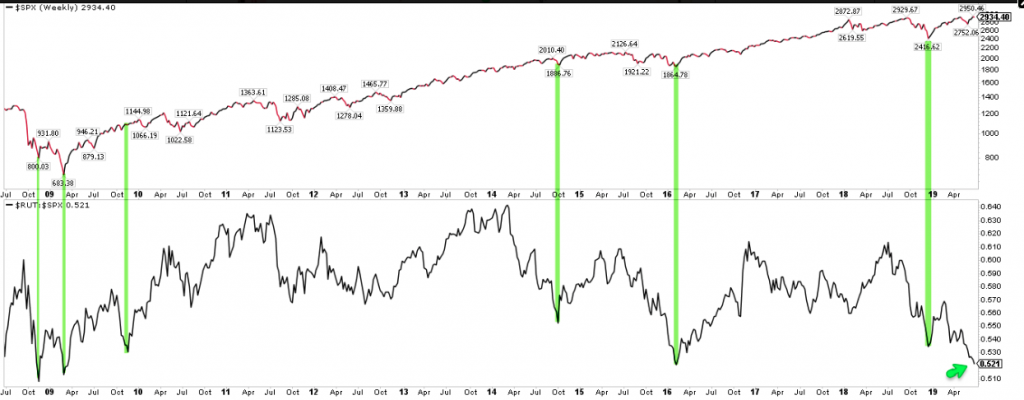
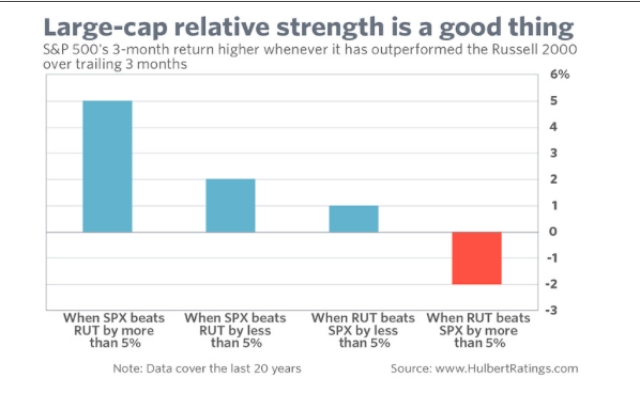
In keeping with the theme of debunking the fears surrounding the weakness in the Russell, Mark Hulbert also lends some commentary and evidence to the subject. The S&P 500 has done much better when it leads the Russell than when the relationship performance is the opposite.
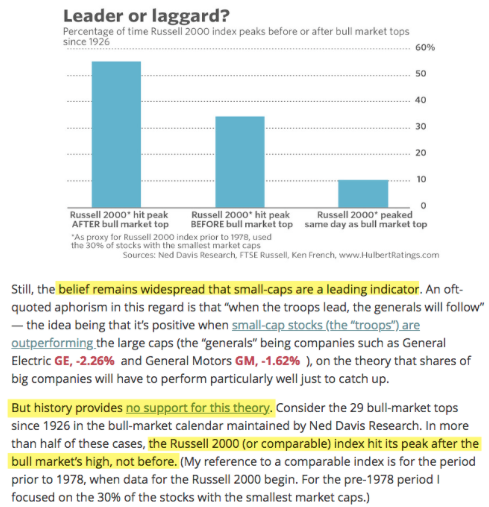
Moreover, a lagging Russell has marked a top in the broader stock market in just 1/3 of these cycles. It’s important to recall that the Russell last made an all-time high 10 months ago.
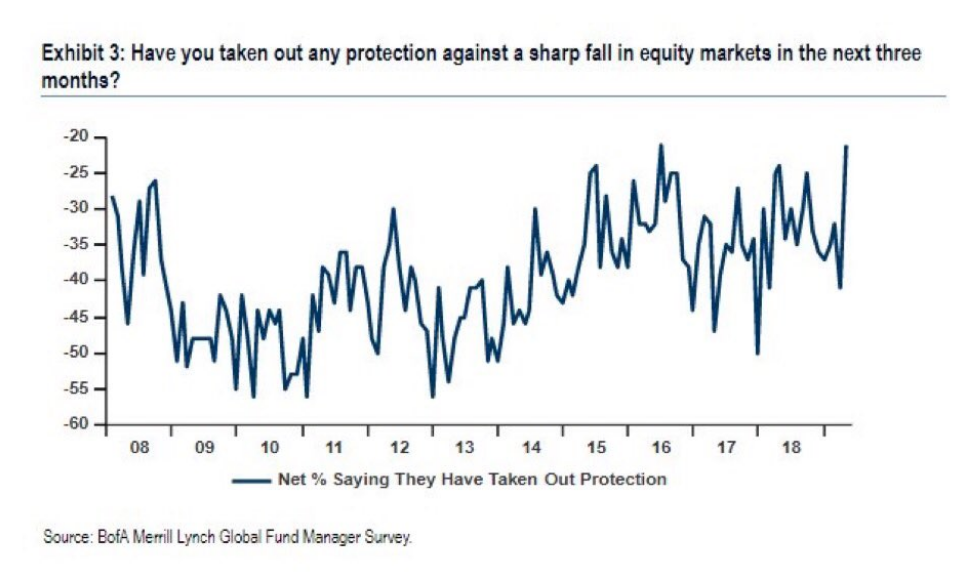
While it is clearer than ever that the relative weakness in the Russell is not a harbinger of doom for large-cap indices, it is something more symptomatic of risk tolerance this “late” in the economic cycle. For those fund managers, which have gone further out on the risk curve, even they are seeking protection for long portfolio positions. (See chart below)
Economic indicators and/or data have weakened in the middle of 2019. The late cycle weakness has given rise to additional fears amongst the average American worker/consumer. Millions of American believe a downturn is coming: 40% of people polled by personal-finance site Bankrate.com say they feel the next recession has already begun or will begin within the next 12 months.
“The stark contrast between everyday Americans’ assessment of the economy and what data say about the economy highlights the risk of talking ourselves into a recession,” says Greg McBride, chief financial analyst for that site. “Consumers that think the economy is weak will spend less and business owners that think the economy is weak won’t hire more people.” Nine analysts polled by Bankrate disagreed with the predictions by the general public.”
Gary Shilling told media group Real Vision: “I think we’re probably already in a recession, but I think [it will] probably be a run of the mill affair, which means real GDP would decline 1.5% to 2%, not to 3.5% to 4%, you had in the very serious [past] recessions,” said the president of money manager A. Gary Shilling & Co.
In North America, nearly three-fourths of CFOs said they expect a deceleration of economic activity by the end of 2020, while only 15% expect a decline, according to a survey of chief financial officers by Deloitte.
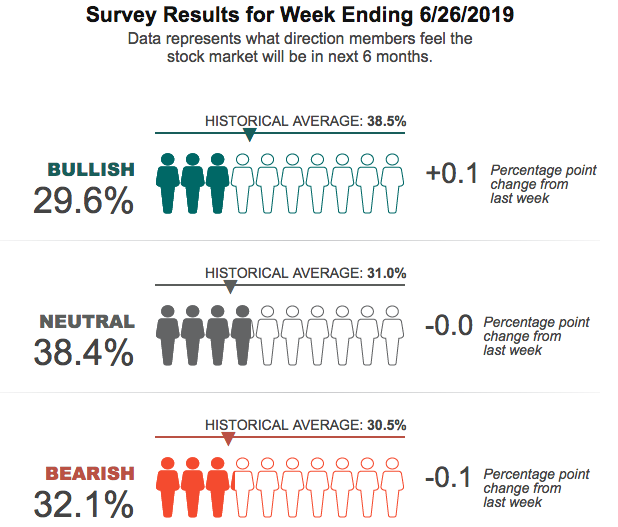
There’s a lot of pessimism out there in America this late in the economic cycle and with a litany of geopolitical issues that have pervaded the business community through 2019. It’s no wonder individual investor sentiment remains rather bearish. (Latest AAII Survey below)
Despite the broad, fearful narratives abound in both the consumer and investor communities, Finom Group remains net positive for the back half of 2019. We suggest the existing and near-term economic weakness to dissipate and give way to modest improvements in the economy through the back half of 2019. Once the soft/sentiment/manufacturing data troughs it usually gives way to hard data improvements and a more optimistic sentiment for economic conditions that provide a positive earnings feedback loop. The driver for such a turnaround is likely rooted in global trading conditions. If the trade war fears are removed, it acts as a de facto economic stimulus.
Lastly, but certainly not least we aim to reiterate the outlook we’ve held for the current trading week. In Finom Group’s weekly Research Report we denoted the likelihood for the market to express a drawdown due to structural issues centered on last week’s quad-witching event.
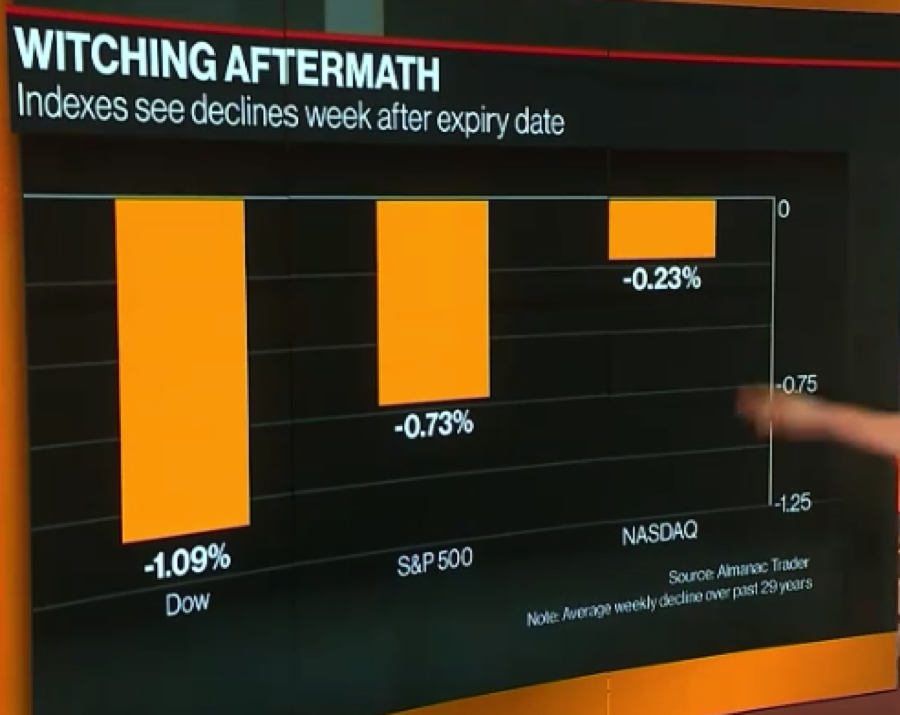
“As shown in the chart above from Bloomberg TV, the week after a quad-witching Friday the major indices are usually found to decline. The declines aren’t terribly significant, but in 25 out of the last 29 years, all three major averages have declined after a quad-witching day. The reason for the declines is that demand diminishes in the options pit.”
As of Thursday, the S&P 500 is down a little over 1% for the week. With 2 trading sessions remaining in the week, it seems as though the odds suggest history will lean on the side of another drawdown post the quad-witching event. Nothing out of the ordinary folks, just structural issues that need to play out.
While Finom Group remains constructive on the markets for 2019, we are not alone in expressing this sentiment as many analysts maintain S&P 500 year-end price targets above the all-time high recently achieved in the benchmark index.
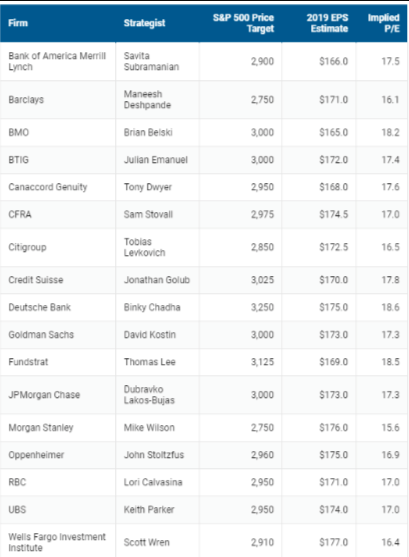
Additionally, here is what Goldman Sachs recently offered to clients in a note: “We remain modestly pro-risk for 12m: OW equities, N Credit & Commodities, UW bonds. A 2H recovery in global growth remains likely, especially with recent weak global growth data and easier financial conditions. This should drive some pro-cyclical rotation across and within assets eventually.”


