 Research Report Insight #1
The benchmark index fell ~1% for the month, breaking from the typical seasonal pattern. February is usually a down month for the market and yet, the benchmark index rose ~2.6% for the month, also breaking a seasonal pattern dating back to the turn-of-the-century.
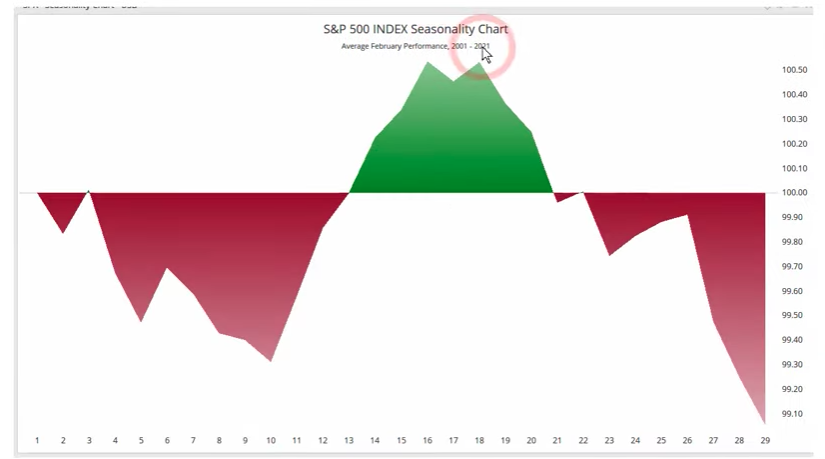
- In the chart above, if just go back to 2001, we can see that the majority of the time the month of February is a down month.
Research Report Insight #2
Of course, what is on the minds of many investors right now, however, is how the downturn at the end of February seems to align with 2020. Kind of wish we could forget 2020, but hard to forget such a moment in U.S. market history, right? Nonetheless, there are grave differences we can identify in the broad market between February 2020 and February 2021. This year’s stock market looks a lot different than last year. The chart below shows the performance of S&P 500 sectors on a YTD basis as of the close on February 18th last year versus this year. (Feb 19th was peak in 2020)
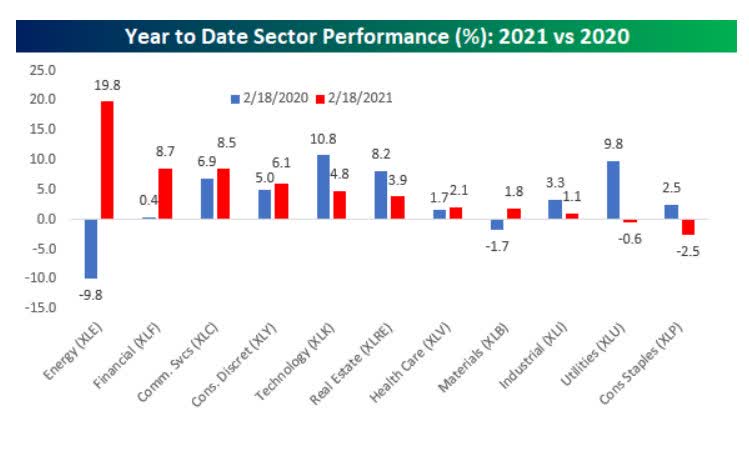
Technology (XLK) and yield-sensitive sectors like Utilities (XLU) and Real Estate (XLRE) led the rally in 2020. On the downside, Energy (XLE) and Materials (XLB) were the only two sectors down on the year. This year, Energy is leading the way higher with a gain of just under 20%, while Financials (XLF) and Communications Services (XLC) are both up over 8 percent. We have seen a complete reversal from 2020 leadership. Just like scary headlines promoted in the financial media, sometimes you have to look underneath the surface to find the truth of what’s going on in the markets. Now let’s take a look at March since we rid ourselves of March 2020 mimic-market fears.
Research Report Insight #3
Now as you can see below, if the S&P 500 could just go sideways for the next 2 or 3 days, the current trend and the Roadmap will be back in sync.
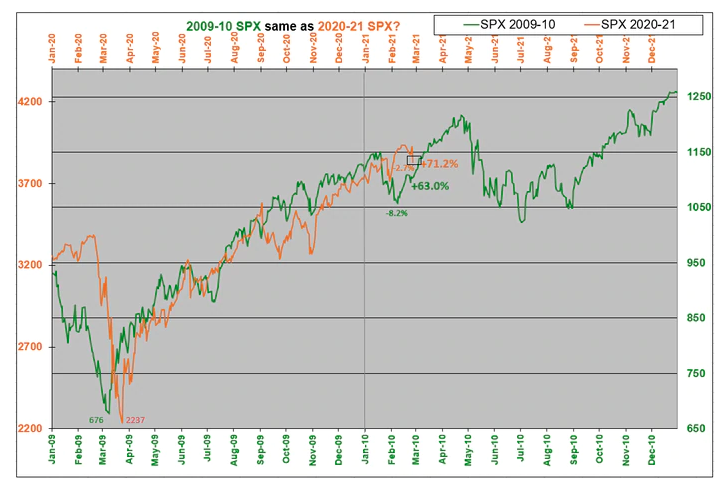
This is pretty awesome if it comes to fruition, as it would lend credibility to the fundamental argument that the magnitude of fiscal policy in 2020-2021 far exceeded that in 2009-2010, thus the equity market should prove more resilient in 2020-2021. I could also point out that the earnings recession from the previous period was far great than the present period, but we’ll leave that for a fundamental conversation. The key to the above analogue is no different than it was last year: 2021 may travel the same path, but on a different time plane, from time-to-time.
Research Report Insight #4
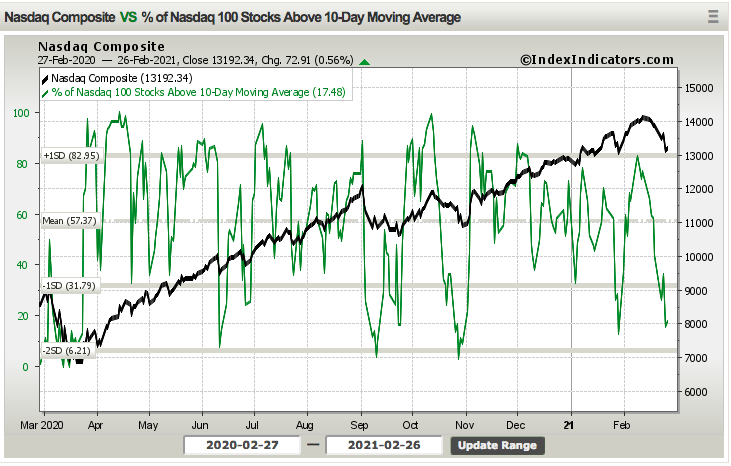
Moreover and with respect to the Nasdaq, it may be more greatly reflecting the FAAMG valuation consideration near-term that signals a bottoming in the indexes underperformance. Reflecting on what we outlined in the percentage of stocks trading above their 10-DMA for the S&P 500, we can see a greater deterioration in the same breadth indicator for the Nasdaq, which may be on the cusp of offering a buy signal, if it hasn’t already! (Chart below)
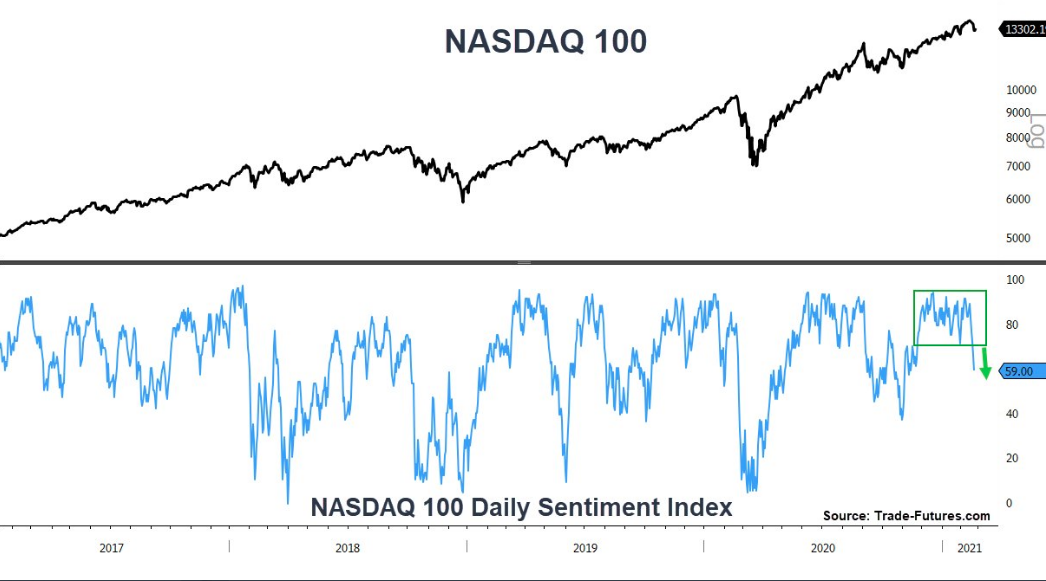
Additionally, given that the Nasdaq has been under the most pressure, as it it highly leveraged to the Technology sector of industry components, sentiment has also become increasingly bearish for the Nasdaq. NASDAQ Daily Sentiment Index fell below 60 for the first time in more than 3 months. Historically, long streaks of elevated sentiment always led to more gains for the NASDAQ over the next 3 months.
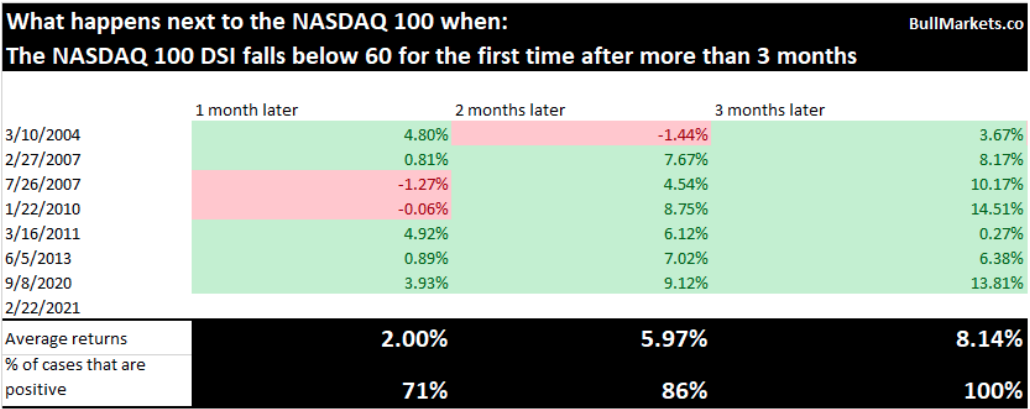
What we care mostly about, however, is how the index performs after the DSI falls below 60 for the first time in at least 3 months. Here are the results, based on a recent study from Troy Bombardia:
Research Report Insight #5
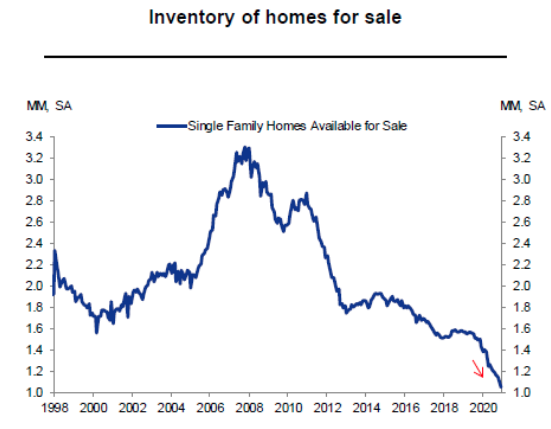
Pending home sales took a step backward in January as inventory constraints continue to hold back prospective buyers. The same issues surrounding New home sales inventory plague just about every segment of home sales. I don’t see this abating until possibly fixed rate mortgage rates get closer to 3.5% or 2022, whichever comes first. Higher mortgage rates my artificially slow demand, given home builders the opportunity to catch up to existing demand while existing home owners ponder selling their homes. Either way, the aforementioned variables have created a tailwind for home price appreciation.
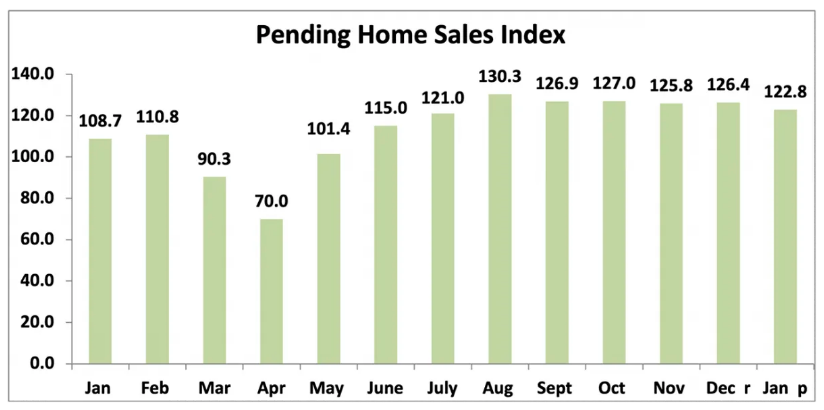
The Pending Home Sales Index, a forward-looking indicator of home sales based on contract signings, dropped 2.8% to 122.8 in January. Year-over-year, contract signings rose 13.0%. Lawrence Yun, NAR’s chief economist:
“Pending home sales fell in January because there are simply not enough homes to match the demand on the market. That said, there has been an increase in permits and requests to build new homes.”
Research Report Insight #6
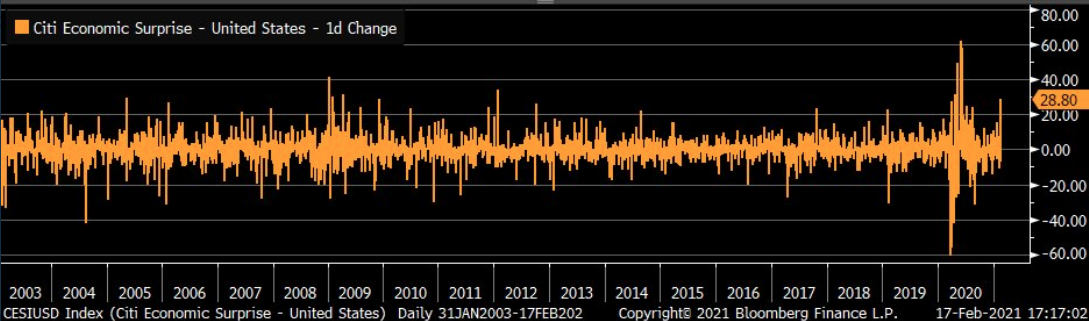
A useless indicator during the present economic situation, the Citi Economic Surprise Index, recently shot up and after the previous week’s monthly Retail Sales report proved much stronger than anticipated. It is now hovering at 7-month highs.
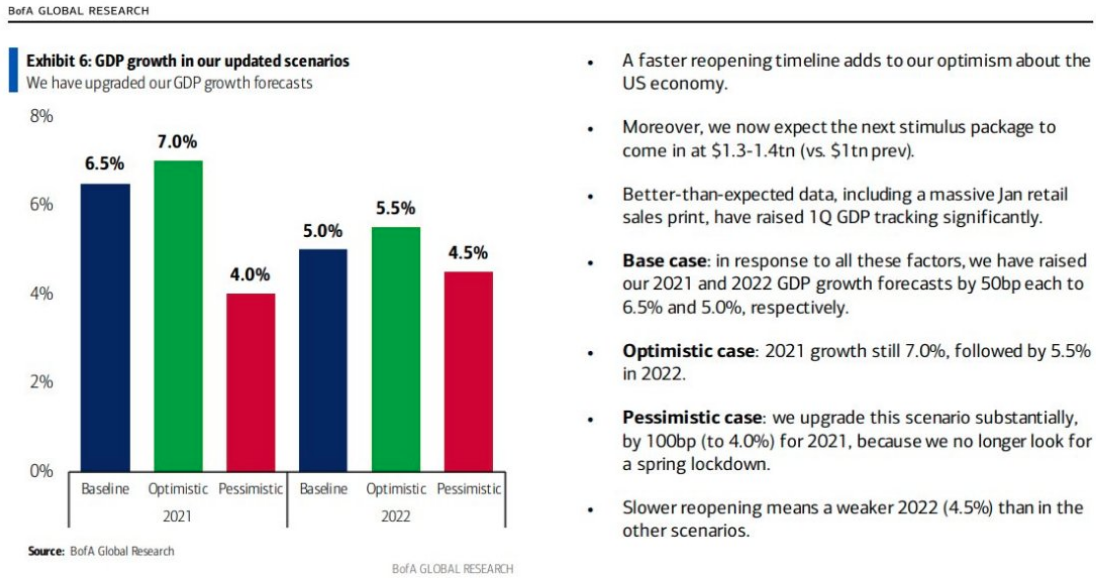
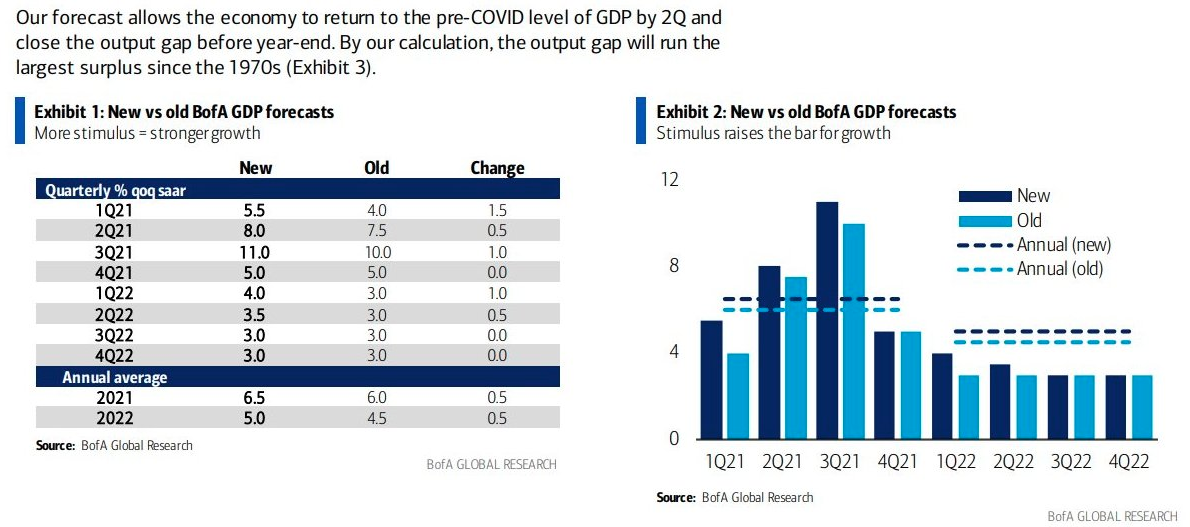
The outperformance of the economic data since January has found economists raising their GDP forecasts, which on the surface seems a positive reinforcing tool regarding the economic recovery, but it has also forced into question where interest rates/yields should be. Nonetheless, here is the latest revised GDP Outlook and rational from Bank of America Global Research:
Research Report Insight #7
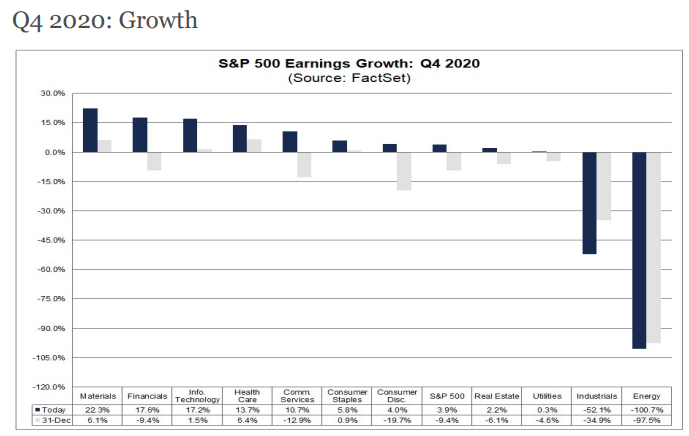
Okay! All of that brings us to the end of earnings season this coming week, as a bevy of retailers issue results. The latest FactSet Q4 2020 EPS tracking has continued to improved with each passing week. For Q4 2020, the blended earnings growth rate for the S&P 500 is 3.9%. If 3.9% is the actual growth rate for the quarter, it will mark the first quarter in which the index has reported a year-over-year earnings growth since Q4 2019.
Now let’s look at what FactSet is projecting for 2021. For all of 2020, S&P 500 companies are reporting a decline in earnings of -11.2% and a decline in revenue of -1.0%.
- For Q1 2021, analysts are projecting earnings growth of 21.5% and revenue growth of 6.0%.
- For Q2 2021, analysts are projecting earnings growth of 49.7% and revenue growth of 16.1%.
- For Q3 2021, analysts are projecting earnings growth of 16.9% and revenue growth of 9.7%.
- For Q4 2021, analysts are projecting earnings growth of 13.0% and revenue growth of 7.0%.
- For CY 2021, analysts are projecting earnings growth of 23.9% and revenue growth of 9.3%.
- The forward 12-month P/E ratio is 21.5. This P/E ratio is above the 5-year average of 17.7 and above the 10-year average of 15.8. However, it is below the forward 12-month P/E ratio of 22.4 recorded at the end of the fourth quarter (December 31).
Research Report Insight #8
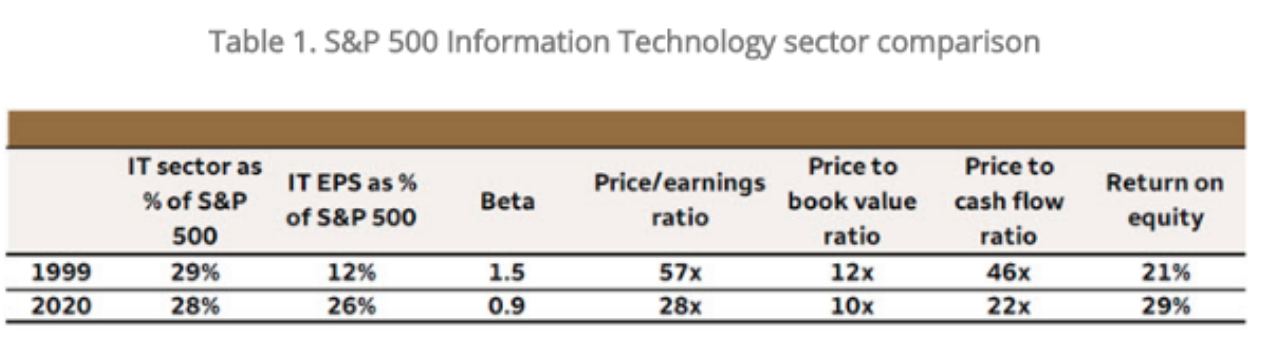
Today’s Nasdaq, S&P 500 or Information Technology sector is not the same as what we witnessed in the 1990s. In the 1990s, valuations for the Technology sector were much higher than today on an absolute basis & higher than S&P 500 valuations on a relative basis. Forward P/E for the Technology sector was 57X on December 31, 1999 vs. 27X today. The price-to-cash flow ratio informs the same story i.e. NOT A BUBBLE!
I’m not terribly certain there is a bubble in anything more than maybe SPACs, IPOs and the VIX at this point. To confirm my feelings recall that just six weeks ago on January 8th the S&P 500 closed at 3,824, and based on the close Friday (3,811) the S&P 500 lost 13 points. Where is this euphoria the media hyperbolizes? Please, show me where?
Research Report Insight #9
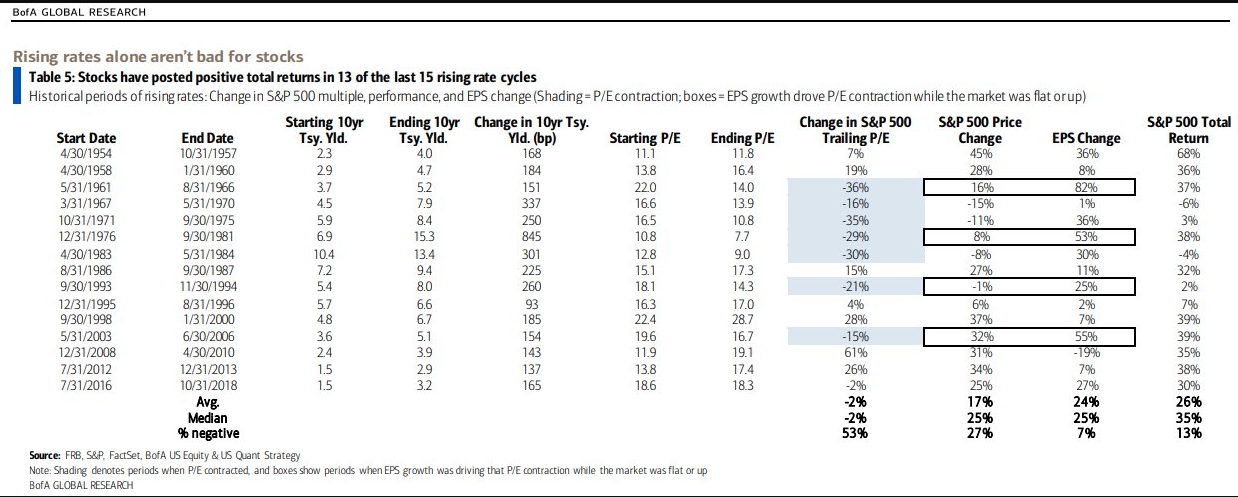
In the last 13 of 15 rate increase cycles, equities have climbed with yields.
As I’m combing through weekly notes from Wells Fargo, Morgan Stanley, Goldman Sachs, I’m now doing my reading up on the latest from J.P. Morgan, and apparently I am a good speculator. Nonetheless, as I’ve stated and will restate, I believe we are closer to the end of the current VAR shock and I believe the capitulation characteristics of the recent bond market sell-off signal the near-term end.
The main points Finom Group and our coverage of 3rd party analysts are making should be received as follows:
- Rates/yields and stocks tend to rise together over time, as economic growth extends year-after-year.
- VAR shocks from such revaluing the strength of an economic recovery are norma, to-be-expected, and an opportunity to buy dips with long-term considerations.
- The immediate impact on risk assets from a rate/yield revaluation can prove fierce and come with implied and realized volatility, but quickly subside.
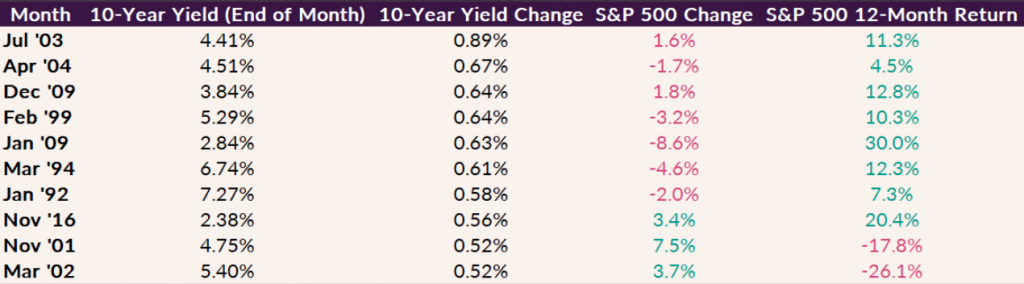
- Quick jumps in the 10-year yield tend to freak out stocks, BUT stocks tend to do well in the 12 months after.
- Above is a table of months since 1990 when the 10-year yield has risen the most.
- Whenever people start getting concerned about how higher rates might affect the stock market, I refer to this gem written by Mike Cintolo several years ago.
- The 3 biggest bull moves of the past 15 years all occurred amid rising interest rates.
- In 2003, as a new bull market kicked off, the 10-yr. yield rose from 3.07% to 4.67% in just three months. In 2009, rates actually bottomed at 2.04% before doubling by the middle of 2009. Of course, stocks soared all year following the recovery from the bear market. And in 2013, when the S&P 500 rose 30%, we saw the 10-yr. yield move from 1.75% t 3.04%.
And if you don’t believe that tech or the Nasdaq will find improved performance post these VAR shocks from rates/yields rising, here’s a study that includes the Nasdaq 100 ETF (QQQ).
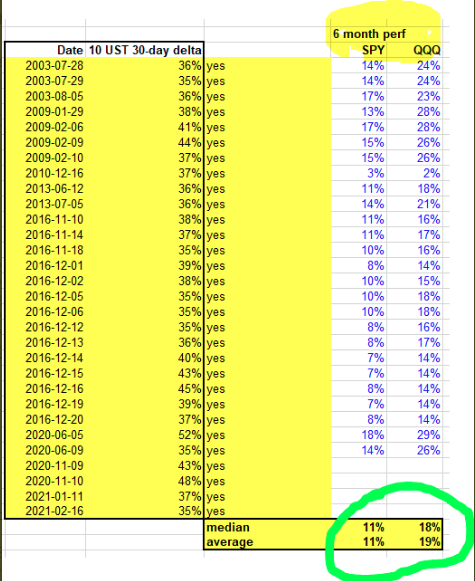
- Since 1962 6 months after 10-yr. Treasury yield rises 35% or more, S&P 500 was ALWAYS higher 6 months later.
- SPY was up 11% & QQQ 18-19 percent.
- How’s that for an indicator of rising rates?
- The economy is expanding, rates rise, earnings rise, the equity market rises too!