
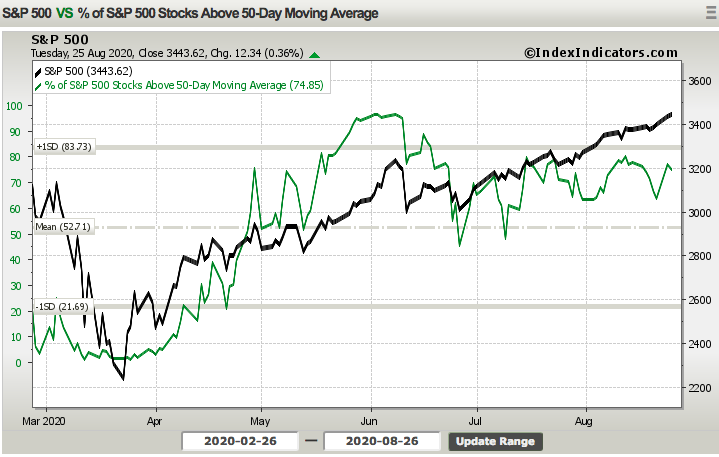
Over the last 10 trading days, it’s been all the rage to clammer over the weakening market breadth as the markets travel higher. The S&P 500 (SPX) and Nasdaq (COMPQ) have continued to set new record highs while declining stocks have been outpacing advancing stocks. Additionally, there has been some divergence in the percentage of stocks trading over their 50-DMA (chart below), further echoing the weakening breadth warnings amongst many market participants. For this daily market dispatch we’re simply going to recognize that, indeed, breadth has weakened and/or narrowed. Having said that, after a greater than 1,200 point rally in the S&P 500 and all the necessary qualifiers for a new bull market have been achieved, one should expect market breadth to cool off. Furthermore, there’s simply not much an investor can utilize in real time from weakening or even strengthening breadth. Market breadth analysis is something to follow, but investors should recognize that markets can move higher on weak or strong breadth. When breadth is extremely weak and showing signs of a washout, that is when breadth is most actionable and signaling to “buy the dip”.
It seems as though MOST traders, strategists and analysts are beckoning a pullback in perpetuity. They will jump from one narrative to the next. One week it is the Covid positive test rate, the next week it is debt:GDP ratio and another week it is political turmoil. Don’t get me wrong, these are all macro-concerns to be aware of, but they have no impact on the market in real-time as the market generally does not follow narratives and performs a forward-looking earning’s discounting operation. Markets discount earnings and follow liquidity regimes. Once the market feels confident that it has completed this operation, the more near-term concerns tend to offer market participants to lock-in profits, rebalance and consolidate market gains. The apparent question, therefore, is when do you know whether or not the market is confident that it has discounted earnings out some 3-4 quarters? Simple answer is: You don’t! I’ll offer, however, that you don’t need to know. Your focus shouldn’t be on timing whether or not the market has completed the earnings discounting operation but rather how to navigate the market for long-term capital returns. The market goes up over time. Let that be that basis for which you make capital allocation decisions, not breadth or weekly market narratives about this macro topic or that macro topic of concern.
So why don’t most analysts and strategists appreciate the aforementioned market fundamentals? They simply can’t wrap their minds around a market that has incessantly melted-up over the last 2+ months and without any pullback of consequence. Many Wall Street analysts find their market analysis absent the recognition of equity market liquidity paradigms and the affect of liquidity on trends in the market.As previously mentioned, liquidity. As markets evolve and investor participation follows, equity market liquidity has declined over time. We can see this in the following charts:
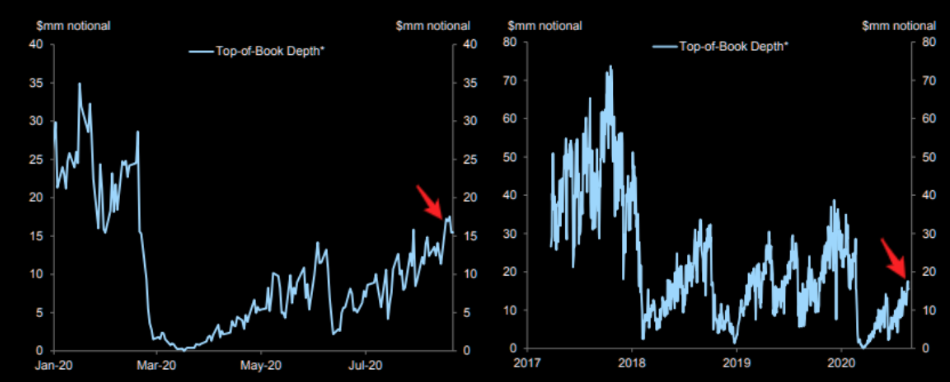
It’s pretty grotesque to know that back in 2016, their were 3,500+ S&P 500 futures contracts within a $1 of the bid. This is how we define market liquidity. Since 2016, even before, we’ve seen liquidity drop to as little as a couple of hundred contracts before more recently rising back above 1,000 contracts. Even so, it is unlikely we’ll ever see those 3,000-6,000 contracts available within $1 of the bid that were found from the turn of the century. Coming into the month of August, we recognize the abnormal liquidity level in the futures market as follows:
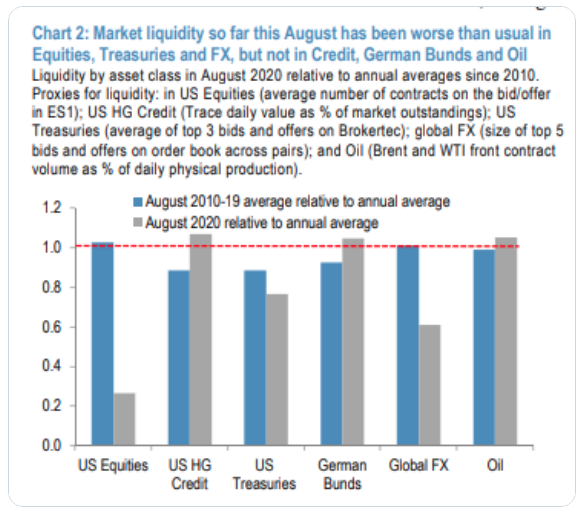
This gives investors a more elongated look at U.S. equity market liquidity when compared to other asset classes. So when you hear traders/investors suggest that the Fed is pumping liquidity into the markets, know that they are not referring to the equity markets. In pulling together my previous comments about analysts calling for pullback and the lack of recognizing the power of market liquidity…
- Equity markets liquidity remains awful, but as I’ve said in the past, liquidity works both ways. Think of it like the Titanic pointed in one direction. Drain liquidity/water out of the ocean, the Titanic sinks to the bottom of the sand bed. It proves impossible to turn on bed of sand. This is not altogether different for equity markets and why uptrends can prove extremely difficult to reverse or provide a meaningful and/or sustained pullback. Simply put, if you want the markets to go higher, you have to buy the futures, which will in-turn pull the markets higher absent any substantial negative flows to offset and then some.
It’s painfully clear to many permabears and many analysts/strategists that the rally has proven longer and of greater magnitude than most assumed was probable. Miller Tabek’s Matt Maley has been heralding a pullback for months.
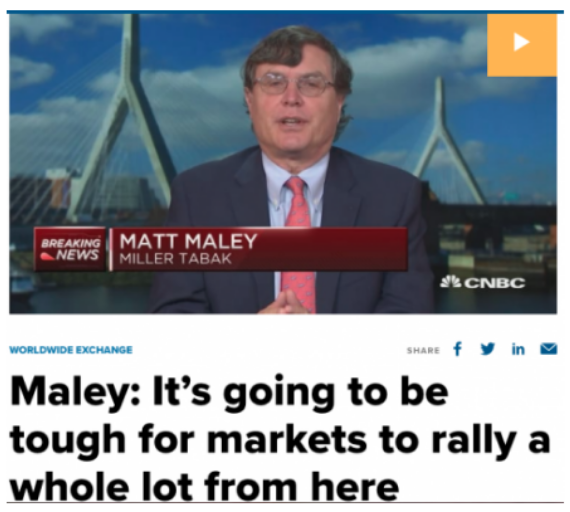
- In May, “Markets can’t go much higher.”
- In June, “Markets only higher because of Fed.”
- In Aug, “Prepare for the pullbacks… I had erroneously offered in the past while I forecast higher prices after.
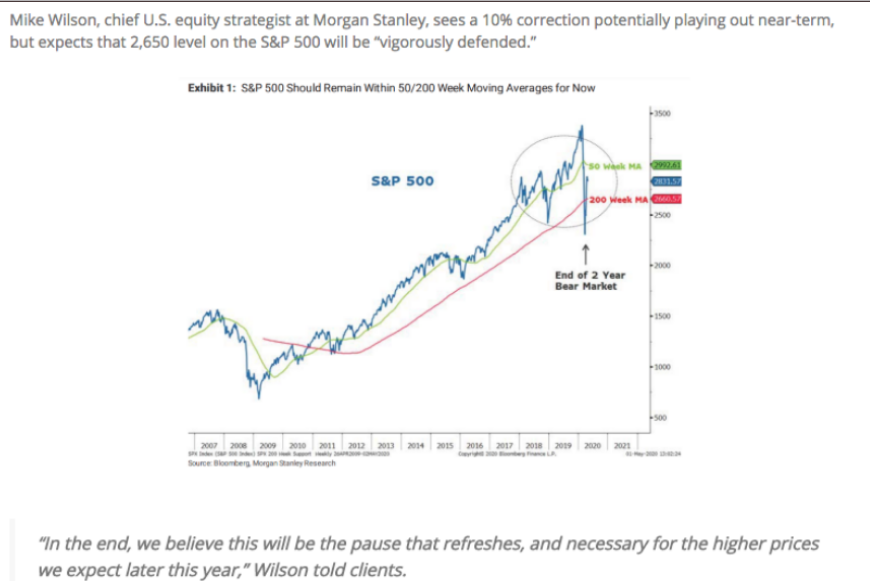
Morgan Stanley’s chief equity strategist Mike Wilson turned more bullish on markets back in April, but each and every month since he has also been heralding a market correction. At some point, an investor has to recognize there’s no real market call to consider from these folks, it’s just a matter of eventuality. Yes, eventually the market will pause, pullback or correct to some degree. Eventuality is not analysis nor is it a call; it’s just eventuality playing out. This is why analysts make the big bucks? No, the big bucks come from making markets for clients. Nonetheless, let’s look at the monthly notes from Mike Wilson to Morgan Stanley clients as follows:
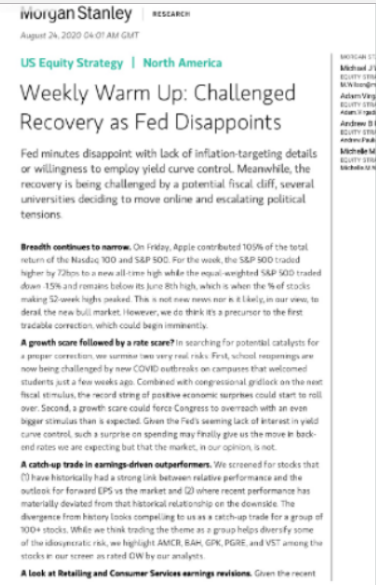
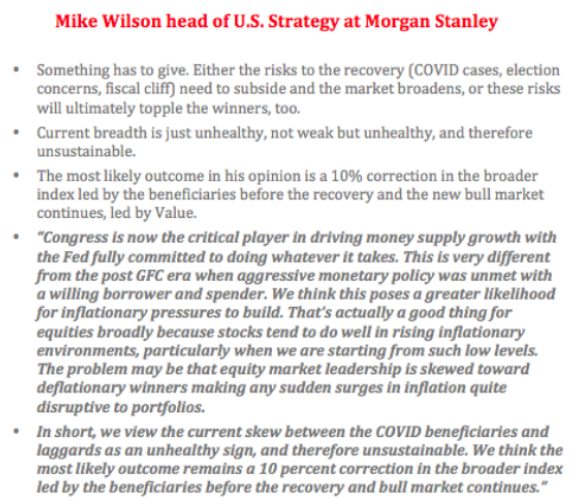
While blurred a bit, the premise of Wilson’s latest report calls for a “more proper pullback”. His 3 major points for a pullback are as follows:
- Breadth continues to narrow.
- A growth scare.
- A rate scare.
In his Monday released report and for this monthly go-round, Wilson doesn’t really offer a pullback price target. I think he’s learned a bit of a lesson in that regard and as you’ll see from the previous monthly missives of Wilson.
Now let’s travel back in time a bit to review the monthly reports from Mike Wilson, and what he forecasted for clients of Morgan Stanley. After a strong, 10% gain in the month of April for the S&P 500, we have to consolidate those gains, have a correction of sorts don’t we? Well, on May 6th that is what Morgan Stanley outlined for his clients in the following notes and call for a pullback:
- May 6: “…markets can’t go much higher…”
Fast-forward to the month of June and mid-month, after already producing an 8% correction in a matter of 4 trading sessions, Mike Wilson was out with another pullback call as follows:
- June 15 “..7-10% correction…”
Once again we fast-forward to July. What do you think is coming from Mike Wilson in July and after recapturing all the gains from June? That’s right, another pullback call!
- July 13 “…downside correction target 2,800-2,850
What about liquidity, did you see anything in any of the monthly thesis that promoted a pullback mention liquidity. Certainly these are not his full reports, but trust we’ve covered the bases and no liquidity considerations were considered. But atop his latest narrative, Wilson jumps on the “market breadth bandwagon”. This is not to omit breadth as an issue, but we can see that it is just part of a newer narrative for Wilson. Perspective folks, keep a flexible approach to markets and allow for a wide ranging perspective of near-term issue while focussing on your longer-term investing goals.
Speaking of perspective and offering a real-time example, here is something we offered to our Finom Group subscribers in this weekend’s Research Report:
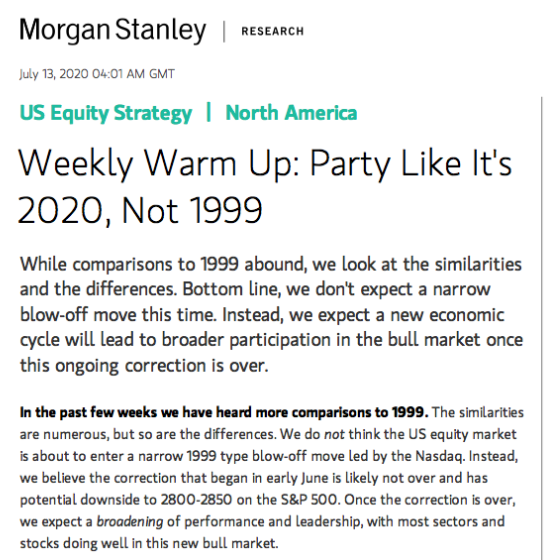
“This is where perspective comes in handy folks. Whenever you look at a chart, consider the time frame being identified. Longer time periods tend to have more favorable results. With that being said, now let’s look at how well the SPY:TLT ratio has performed:
It would appear that the SPY:TLT ratio has found formidable resistance this past week. At the end of the week, there is no determination on what will happen going into the next trading week. This particular chart ratio falls into the “to be determined” category. We’ll be monitoring this more closely in the Finom Group Trading Room in the week/s ahead. If the ratio weakens there is nothing we can do to change that, but we can certainly modify how much risk we are taking with equities for the day/week.“
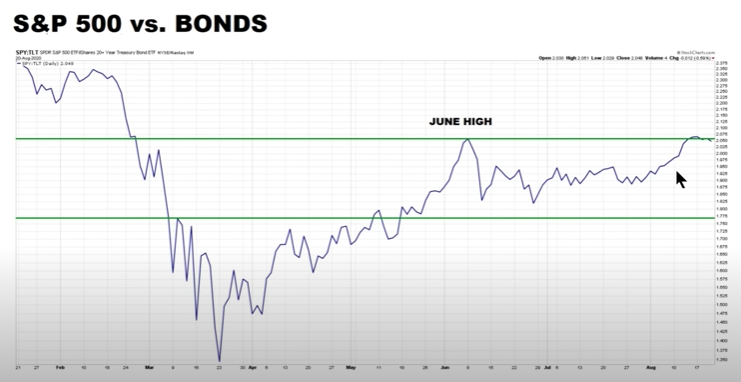
I hope you read that carefully because the market offered us some new information about the SPY:TLT ratio in the first couple of trading days of the new week! (Chart from Chris Ciovacco)
The SPY:TLT ratio cleared a stall area and is making a second run at trying to clear and hold above the June high. Clearly, there has been some improvement in the ratio this week, as the S&P 500 made more new highs and bonds have retreated with yields moving higher. Now I’m recalling what Mike Wilson offered as a potential threat to the market; a rate scare! And with rates rising once again, we’ve seen a rally in the financials so far this week.
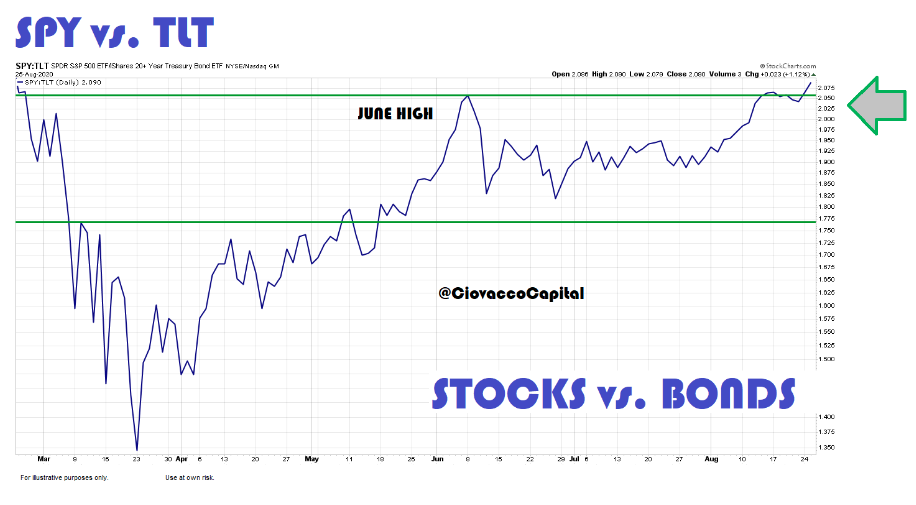
The chart of the Financial sector ETF (XLF) above identifies the potential for resistance ahead. XLF rallied nicely on Monday, but is facing key resistance at the 200-DMA and Fibonacci level. Relative performance remains very abysmal as investors question the viability of bank stocks in a perpetual low-rate environment whereby QE infinity reigns supreme. We’ll be monitoring the progress of this chart for the remainder of the week, even as financials have lost a goodly portion of their market weighting in recent years and to a greater degree in 2020.
Normal economic recovery cycles tend to bode well for banks/financials. What led the market in the 2009 equity market recovery? Banks/financials! That clearly isn’t the case this time around. When we think of the financials we think of net interest margins. Usually rates rise a couple of years out from a recession and banks stocks price that in ahead of time. Harkening back to net interest margins, rising rates facilitate greater interest margins banks can achieve per loan, but for the sake of QE this can be called into question. On the subject of rising rates, which are critical for the viability of an investment thesis in the banks/financials, here is what LPL Financial had to offer:
“…historically rates don’t start to move higher until a median of about two years after a recession starts, and five of the last seven recessions were at least 20 months.
“The first month of this recession was back in March, so historically you would expect rates to stay stable or even fall until early 2022,” said LPL Financial Chief Market Strategist Ryan Detrick. “But with a short recession, progress on treatments or a vaccine helping to address the recession’s underlying cause, and massive fiscal and monetary stimulus, we expect to be on the shorter end of history this time around.”

If Detrick is correct, the banks/financials may be on the cusp of discounting rising rates and greater net interest margins, maybe! In contemplating where Detrick could fall short, we have to recognize the Fed artificially suppressing yields/rates through QE. We’ll hear and have a good deal more information from the Fed and it’s plans on rates and inflation with more headlines around the revised policy framework when Fed Chair Jerome Powell speaks at the virtual Jackson Hole symposium later this week. Ahead of the symposium, however, Chairman Powell will be speaking Wednesday morning. What will he offer is speculated upon by Fed watcher Tim Duy:

“It is widely expected that he will reveal the outcomes of the Fed’s policy review and indicate that the Fed will be adopting some form of average inflation targeting. The Fed’s objective under such a scheme will be to allow inflation to rise above the 2% target to at least partially compensate for below target outcomes. The given rational will be that this will allow the Fed to more quickly meet its employment mandate and will help firm up inflation expectations in the low inflation, low interest rate world. Operationally, the Fed will lean more heavily on actual inflation than inflation forecasts derived from Phillips curve-based models and will pursue a lower for longer interest rate policy.”
Powell could move markets, and has in the past. With the S&P 500 trading significanlty above even its 50-DMA with struggling breadth, markets tend to look for excuses to pullback. To what degree is anybody’s guess. Moreover, the greater consideration is do you have a game plan that includes “buying the dip”. And why should you be a dip buyer?
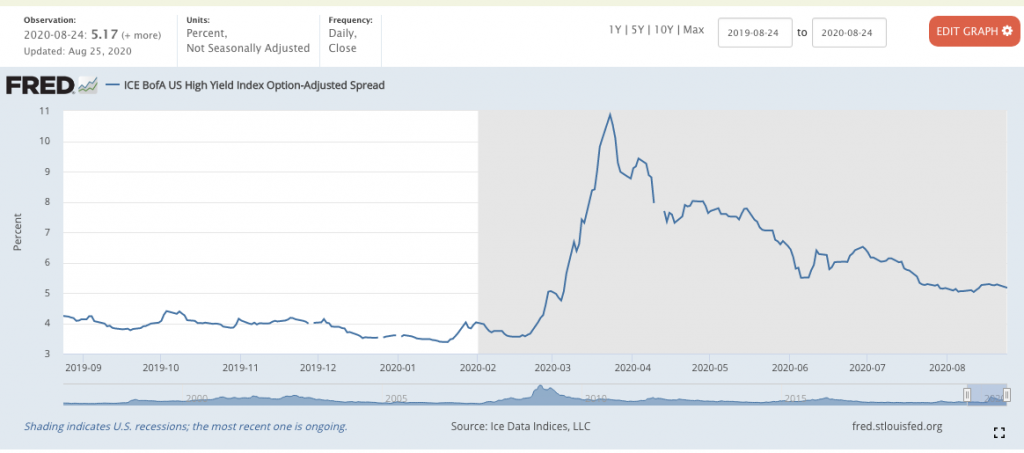
A credit crisis has been averted. Check! The Fed has delivered substantial liquidity to the credit markets and provided for ample facilities to deliver an abundance of confidence to investors who otherwise would be fearful that another credit crisis would occur. The Fed has moved quickly during the pandemic crisis when compared to the former, 2008 Great Financial Crisis.
Another reason to be a dip buyer that we highlighted in this past weekend’s Research Report centered on earnings. Take notice of the estimates, and the lower level orange line representing Q2 2020 EPS. Now let’s look at the latest WoW change below:
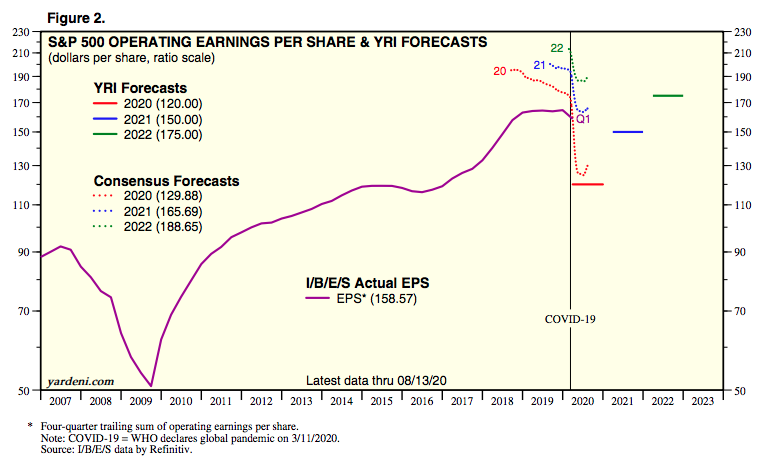
- The FY2020 EPS consensus estimate has improved from $124.79 in the previous week to $129.88 as of this past week.
- What if Q3 EPS estimates prove too low?
- Will we see another $5 increase in the FY2020 EPS consensus estimates?
- Is that why the markets continue to climb?
For 2021, we also see a positive revision from $163.61 to $165.69 a share. Like the economic data from recent weeks, the market has been front-running better than anticipated earnings. The market knows what the financial media speculates and opines. Speculating and opining is perfectly acceptable, but not so much when done with such persistent pessimism, in my opinion.
Thirdly, and trust that I could add 10 more reasons to buy the dip, the equity risk premium remains favorable. It has weakened, like breadth, but remains favorable. Essentially and in “plain speak”, the ERP suggests equities are a better long-term value or risk/reward than bonds.
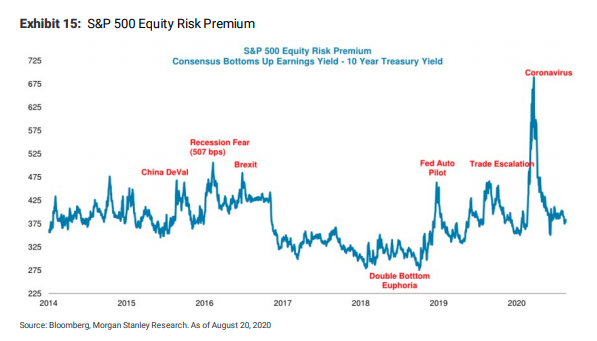
The historic data also supports a more favorable allocation to equities over bonds for the foreseeable future and absent another exogenous shock to the economy/earnings. Don’t get MY NARRATIVE wrong, I’m interested and follow what the strategists and analysts have to say, but it is not to be used as the main reason for taking action with one’s portfolio. Like any other market watcher or participating investor, analysts are just as prone to a lapse in judgement as you or I. With that in mind, unbiased and factual historic data proves a better guide; it is not a guarantee, but a guide! So what does the data tell us about such strong 100 day rallies in the S&P 500?
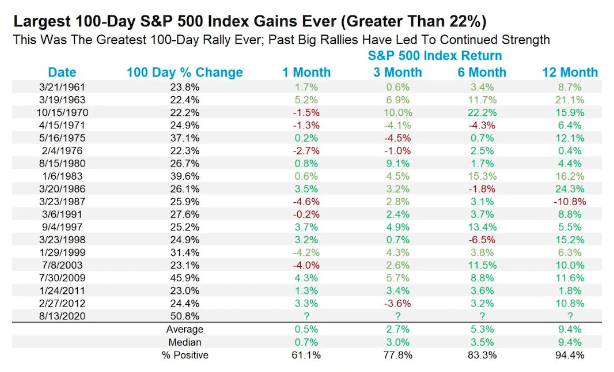
Looks pretty darn positive to me folks. Anything is possible, but as investors we shouldn’t care about possible; we should care mostly about probabilities. What’s more/most probable based on the historic data?
My final commentary of the week will consider that everyone has also focused on the big 5 stocks carrying the market higher. We dispensed with this hyperbolic language and characterization of market breadth in the past. As such, I’d encourage readers to subscribe to our reporting to receive all of our exclusive content which has proven to dive more deeply than what the financial media offers. One of the deeper considerations on the highly concentrated market gains, however, that I’ve studied is sector weightings.
Markets evolve with the evolving economy and advancing technologies. You guessed it, while the big 5 tech stocks aren’t all in the Technology sector, they are still recognized as such and have enforced an acceleration of sector weighting evolution during the pandemic crisis… because they are on-trend! Why is this subject of sector weighting important? Here are 3 reasons:
- Markets are so expensive at 23 times Forward Earnings
- Big 5 Tech are carrying the markets
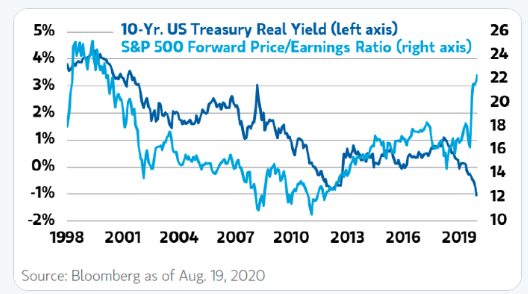
- Do valuations still matter? During the dotcom bubble, forward valuation metrics were almost as rich as they are today.
I’ve gone a record many times since April of this year as stating that PE multiples over the next 10 years will be greater, on average, over the next 5 and 10-year periods.
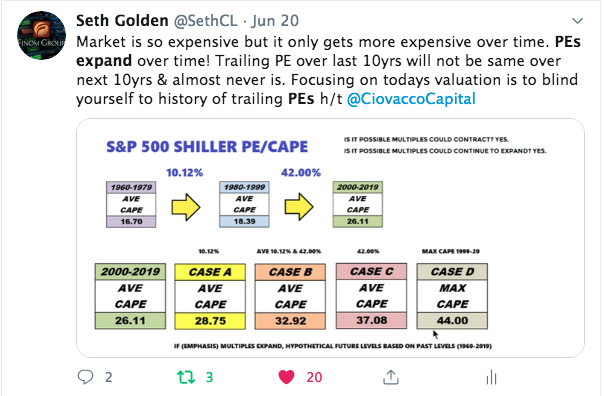
Other than trailing PEs growing organically over time, I’m of the opinion forward PEs will perform in-kind, given that the higher PE’s are afforded to… that’s right, Information Technology and Communication Services stocks. This is why it is relevant, even critical for recognizing the secotr weighting probabilities as they will play a roll in the S&P 500’s forward PE… going forward!
So let’s step way back in time, way, way back 😉 !
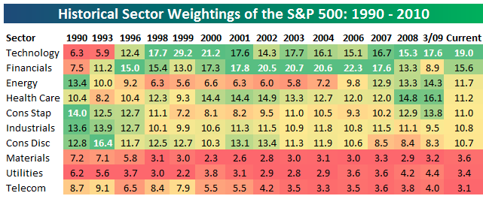
The table above tracks the sector weights of the S&P 500 from 1990-2010. Technology grew in the dotcom era and by 2010 it held a 19% weighting in the S&P 500. Financials were the next heaviest weighting at 15.6% in 2010. Energy prove the 3rd largest weighting. Let’s now fast forward to 2015 – June of 2020.
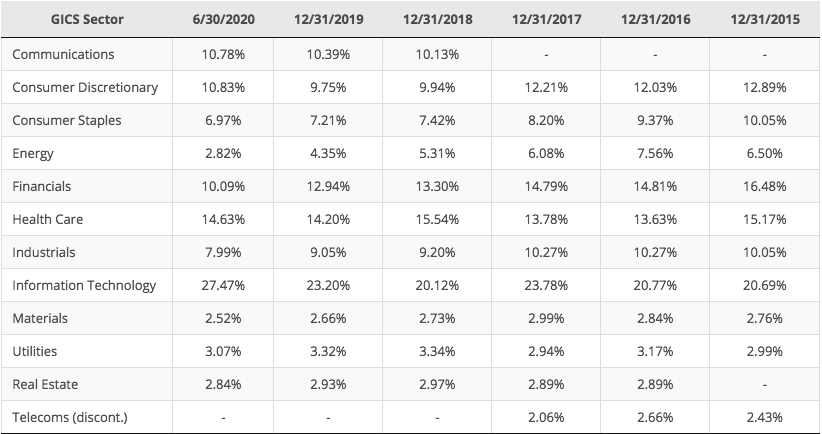
Information Technology grew into a 27.47% weighting. Look at what happened to Financials, which fell to a 10.09% weighting and… holy crap, cheese and a monkey!!! Energy fell to below a 3% weighting. Communications Services grew to a 10.78% weighting since being introduced in 2018. The on-trend sectors, carrying the most outsized PEs are a greater component of the S&P 500 than ever before, ergo, the S&P 500s PE should, logically, also recognize this PE growth. Now let’s look at the present day sector weights in the chart below:
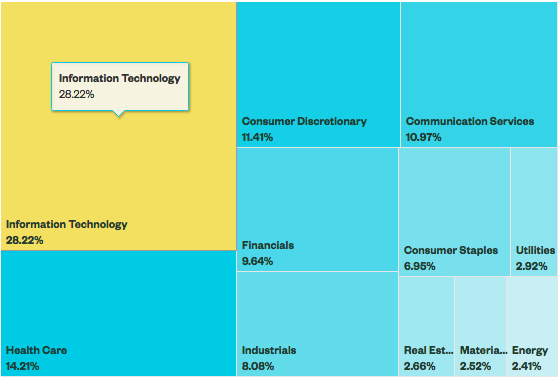
Boom! Information Technology, Healthcare and Communication Services continue to increase their weights in the S&P 500. Additionally, Consumer Discretionary has gained weighting as Amazon reigns supreme in the sector. When we put the jigsaw pieces together, they seem to align and point to expanding multiples going forward as the technology era provides greater PE’s for on-trend business models and with those business models solidifying their earnings power. So if you think the market is expensive today, you might consider a variety of perspectives and recognize the inevitability of higher prices in the future.


