
Did you see that coming? It was quite the rally on Wall Street Tuesday, the first trading day after the Columbus Day holiday. With the bond market back up and running and no deflating U.S./China trade headlines, the S&P 500 (SPX) rallied sharply. The benchmark index finished a cool 1% higher on the day with only the Nasdaq (NDX) outperforming the index. This is largely what we expected to see and outlined in the Finom Group weekly Research Report, in part, due to favorable seasonality as well as technical set-ups.
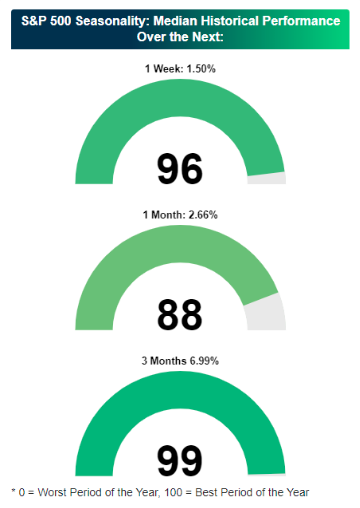
Aside from the seasonal set-up noted in the Bespoke Investment Group seasonal graphic, here is what we discussed in this weekend’s Research Report:
“Taken as a whole, we like the set-up for the market in the coming week/s. Market breadth/internals have/are improving alongside a temporary headwind from trade negotiations having been removed. Absent any exogenous, trade-headline shocks to the market, we should see the market move beyond trade and in favor of earnings season. Earnings season is abound over the next 3 weeks, with the financials and big money center banks set to report results this coming week.
When combined with the near-term seasonality indicator, Finom Group is of the opinion the S&P 500 has a better than average probability of moving higher near-term.”
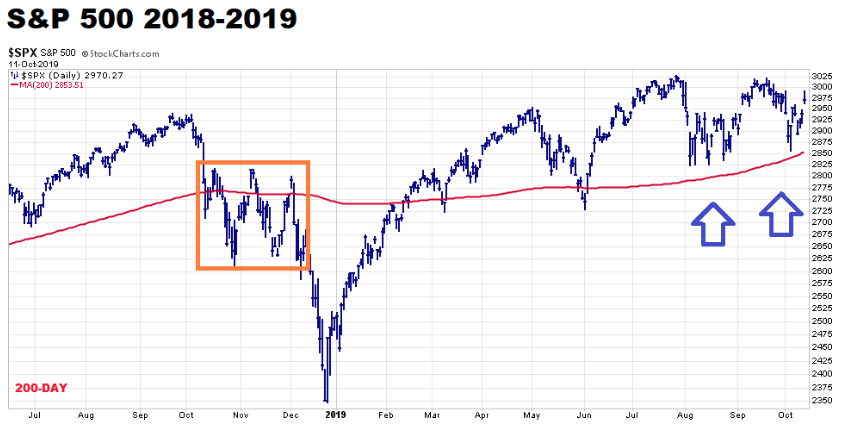
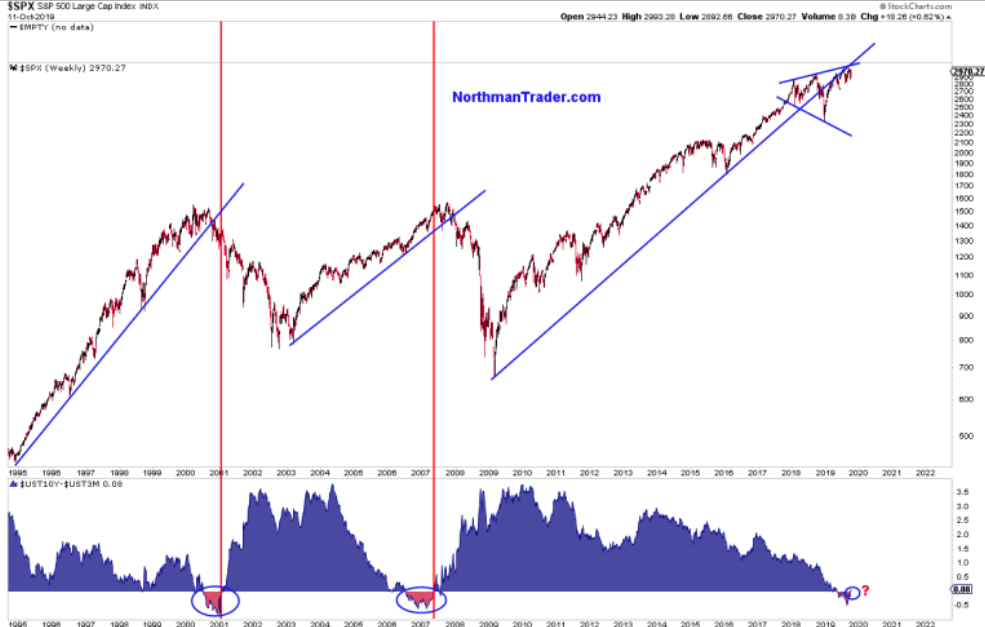
With Tuesday’s 1%+ market gains, it has now been 94 trading days since the S&P 500 closed below its 200-day moving average. This is a very different situation from the pre-plunge period in November-December 2018. Prior to last December’s plunge, the S&P 500 was consolidating above and below a rather flat 200-DMA. In August, September, and thus far in October, the S&P 500 has consolidated above an upward-sloping 200-day moving average.
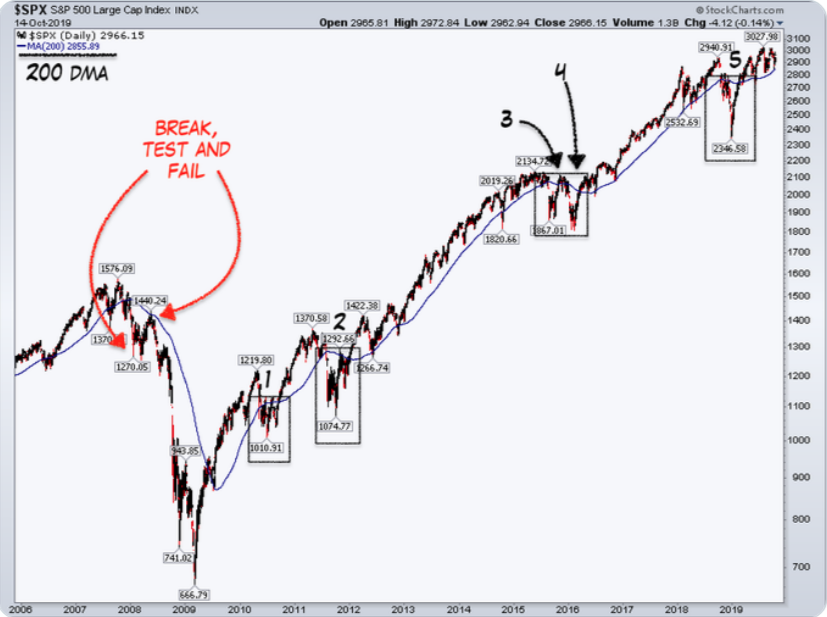
For those worried about a repeat of the Q4 2018 period, technically speaking, at least, the set-up is quite different in 2019. Additionally and with respect to the 200-DMA accomplishment noted previously, we can draw a comparison all the way back to 2008. In 2008, the market broke through, retested, and failed at the 200-DMA. Since then there have been 5 repeats of this same set-up fail, but to the upside. Again, technically speaking the market is displaying far healthier technicals than either the Q4 2018 period or the 2008 period.
With the charts noted, it’s hard for bulls and bears not to express a certain degree of confidence in the forward look prospects… and why? Let’s face it; we’ve been here before in 2019. The SPX 3,000-level has been achieved several times before in 2019, only to fail to hold the level for any significant period of time. The record high for the SPX still resides at 3,027.98 and almost demands a retest and new high level achievement to find the bears with greater concerns.
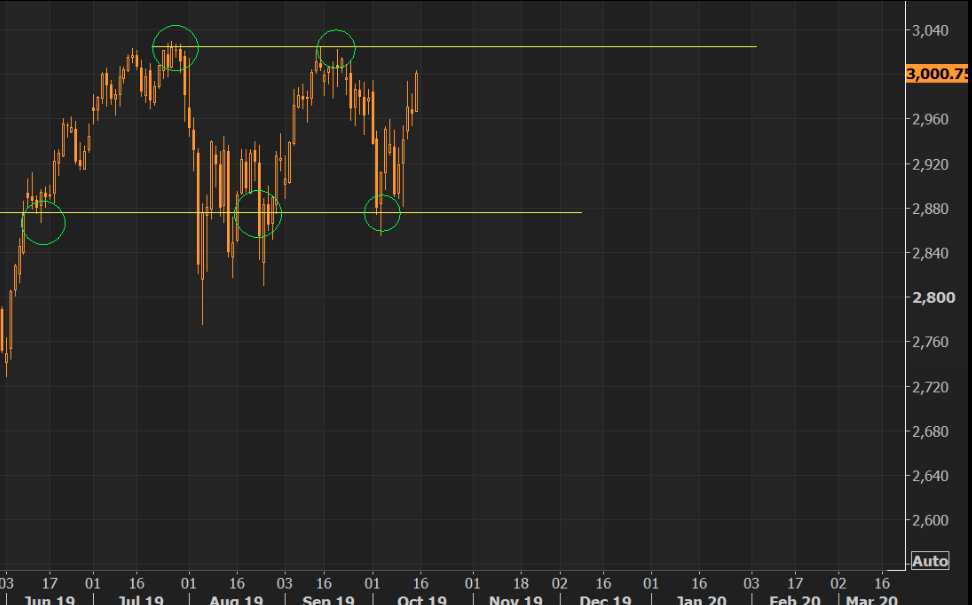
While the S&P 500 broke above the 3,000 level once again on Tuesday, it failed to close above this critical level, as equity futures point to some retracement on Wednesday. Economic data and earnings season will likely continue to provide the index with the impetus for its next leg higher or lower.
Moving beyond equities to focus on the bond market; there has been some steady progress made in terms of the yield curve. Just recently, the spread between the 3-month and 10-year Treasury yield has un-inverted.
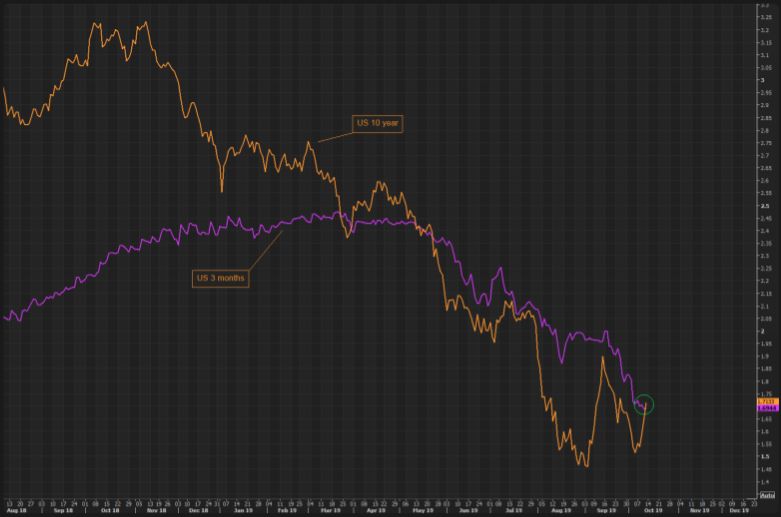
Remember, the yield curve had first inverted back in May, before briefly un-inverting then re-inverting once again and since. The 3-mth/10-yr. yield had been inverted for almost 5 months before it has recently begun steepening. While the steepening of the yield curve is a positive for the financial sector, it also begs of recession calls from historians and market pundits. As the yield curve steepens, calls for a recession are growing because usually after yield curve inversions, steepening is coincident with recessions. The 10-year-3 month spread has gone from inverted by about 50 basis points to slightly positive over the last week. We wouldn’t suggest that to be consistent with a recession if this indicator is to be found accurate. More importantly, this can be a bullish steepening. The curve inverted because investors were very bearish on nominal growth. The long bond (10-year) yield fell significantly. In the past the 3-month or 2-year bonds would rise to invert with the 10-year yield. But here is a visual aid to identify why past steepening is not akin to the present steepening in the yield curve and why this time may indeed be different.
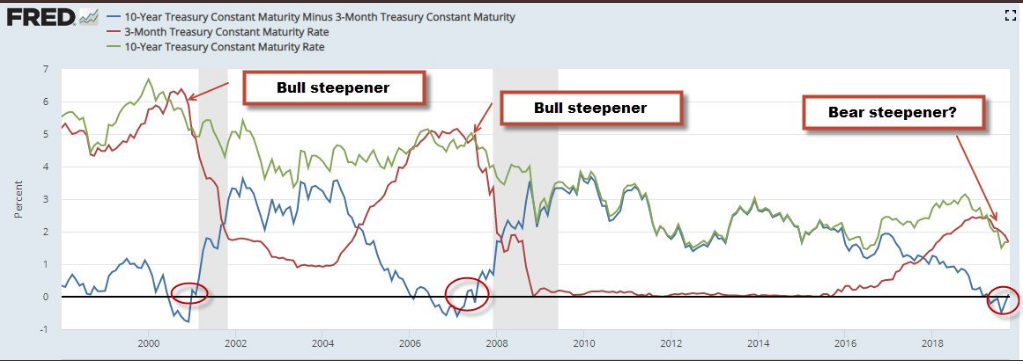
As LPL Financial’s Ryan Detrick explains, the previous 2 times the yield curve steepened post an inversion, a recession was just around the corner. Those 2 times, however, saw short-term (ST) rates fall to produce a steeper yield curve. This is known as a bull steepener and something to be concerned about. Currently, however, the long-term (LT) rates are increasing more than short-term rates, which is known as a bear steepener. This is a more normal steepening process and less concerning. In short, the 10-year moving higher to cross over the 3-month is better than the 3-month moving higher to cross over the 10-year. Everyone follow? And the main point which was missed by the more recent Oped from Sven Henrich.
Recall from last weekend where Henrich offered the following narrative that aimed squarely at the yield curve steepening, identifying the next leg for the economy to produce a recession. Here is what Henrich had to say to investors:

“…all of our senses and perceptions have been dulled by the constant droning on of central bankers telling us that without their existence the stone age is coming back? Please.
Yes they are all afraid of the consequences of debt/credit monstrosity they have unleashed and their only choice to blow an even bigger bubble.
Whether they will succeed is another question. But know that all this frantic action to manipulate the liquidity and rate equation is in response to one chart, the chart that says we are at the beginning of the end.
First comes the yield curve inversion, then comes the steepening, and that’s exactly what happened this week:”
“Why are central bankers acting like there is a global crisis? Because they know exactly the history of this chart and hence they are trying everything in their power to avert the inevitable. And if that means they have to lie and not call it QE then that’s what they have to do.
They’re buying treasuries because the US government has an insatiable demand for debt. Spending keeps increasing, courtesy both GOP and Democrats, increased military spending, liability obligations, you name it, revenue is not large enough as growth is slowing, hence trillion dollar deficits are here and debt must be financed and when you have that much debt to sell you need buyers. And now the Fed is back in the game.“
Kind of a superficial overview of what is exactly taking place from the yield curve. But then again, this is likely one of the reasons why Henrich’s doomsday calls for the S&P 500 over the last 10 years never quite pan out, superficial overviews. Remember, the 10-year yield moving higher and above short term rates is the favored outcome from a steepening yield curve. Additionally and as you may have heard from the permabears in the past, “It doesn’t matter how the yield curve inverts, it’s that it is inverted“. Well, we’ll just have to wait and see how that sentiment pans out for the steepening process this time around.
While we can look to the yield curve for signs of a future recession, the bear market checklist shows only 1 indicator out of 20 is signaling danger presently.
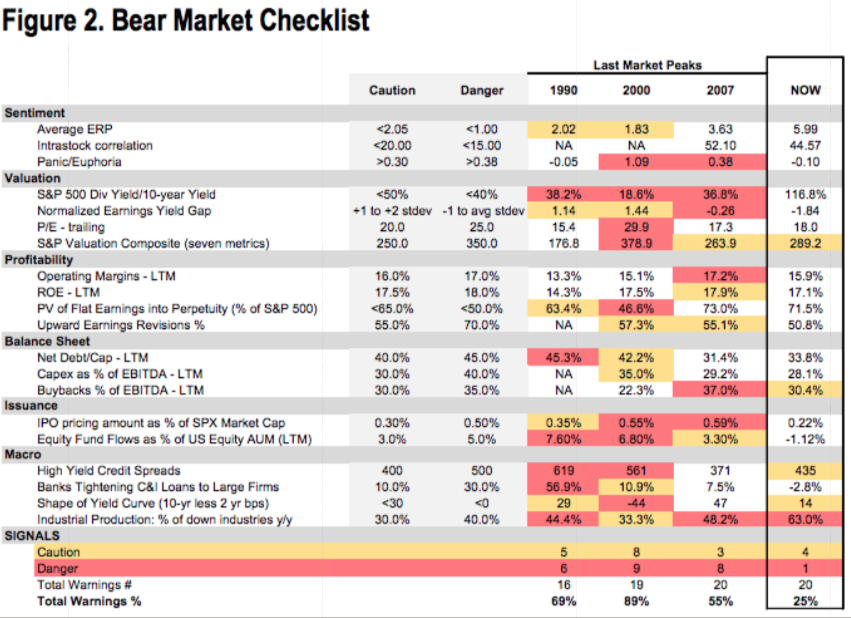
As we can see from the table above, the percentage of industrial production industries showing negative yearly growth is the only danger signal at the moment. One of the most bullish indicators in the Beark Market checklist is the relationship between the 10-year yield and the S&P 500’s dividend yield.
One thing is for sure, the greater the spreads between yields the better the net interest margin performance from banks. And speaking of bank earnings, they will continue to roll out on Wednesday with Bank of America set to report before the opening bell. What we’ve seen from the banks thus far is pretty positive for the financial sector, which carries a significant weighting within the S&P 500 index.
- Large banks clear a relatively low bar on the first day of 3Q19 earnings
- Large banks beat on deposit costs, and deposit growth trends have inflected positively.
- Loan growth misses expectations
- Fee income better than expected with notable strength in capital markets
- Despite fears, credit remains benign once again
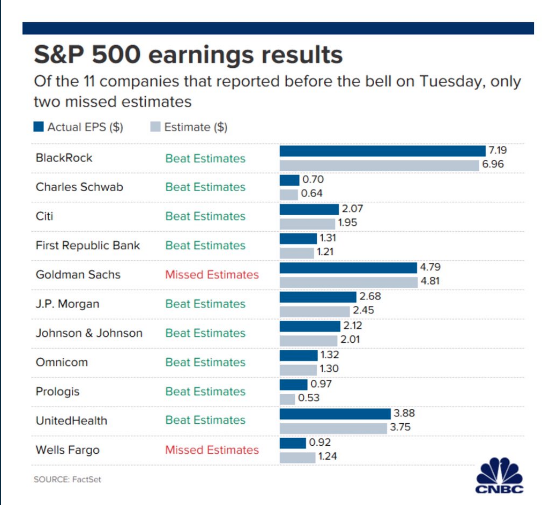
Shares of JPMorgan Chase & Co. rose 3% after reporting revenue and earnings that rose more than expected on the back of its consumer banking division, while Wells Fargo & Co. was also up after it reported a surprise increase in revenue, though its third-quarter profits fell more than expected.
Citigroup Inc. shares gained 1.4% after reporting quarterly sales and profits that beat expectations, while Goldman Sachs Group Inc. reported a steep 26% decline in profit from the year ago period, reflecting weakness in the mergers and acquisitions market and debt and equity underwriting. Goldman shares rose 0.3 percent.
“Corporate America is unlikely to deliver much, if any, earnings growth in the third quarter,” said John Lynch, chief investment strategist at LPL Financial. “However, we think better days lie ahead. We expect progress on trade to keep U.S. economic growth at or above the trend for the current economic expansion. The U.S.-China trade conflict is unlikely to be resolved anytime soon, but we believe any small steps forward could increase business confidence and spark capital investment, lifting corporate profits.”
As investors await earnings from Bank of America this morning, the most anticipated earnings result will likely come after the closing bell and from Netflix Inc. (NFLX). After a wild miss for U.S. and international subscriber growth in Q2 2019, investors are wondering if the threat of competition is impacting company results or if the Q2 results were an anomaly. The good news, investors might be proven right, according to the firm’s reporting history.
Netflix posted a huge subscriber miss in its last earnings report, but has never fallen short on that metric in back-to-back quarters. In fact, Netflix’s most recent misses have been followed by hefty rebounds in the following quarterly report.
After missing by 19% in the June 2018 quarter, for example, Netflix rallied to deliver 34% upside to consensus estimates in the following quarter. And while the company posted a 7% miss in March 2017, it beat forecasts by 61% three months later. The company failed to exceed Wall Street’s projections for net additions five times from June 2014 to September 2018, with none of those coming in the same calendar year, according to FactSet data.
Moreover, when we look at the options market it would seem as though investors have already done their due diligence on the miss and successive smash estimates record by Netflix. The options market is suggesting NFLX will crush earnings once again. The top 3 largest positions in open interest for NFLX are 43,448 Oct $300 calls 20,693 Oct $330 calls 16,964 Oct $285 calls. This is about 16% of current open interest and very bullish. We’ll find out if they are right after the closing bell folks.
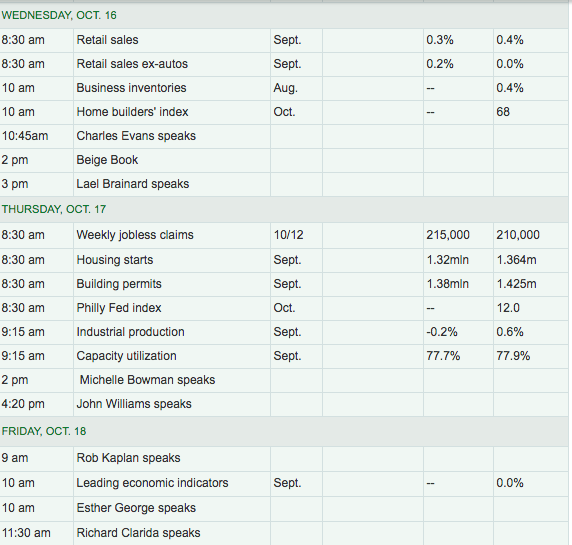
The economic data of the day will also prove more relevant given the weighting of the consumer on U.S. GDP. As business sentiment has waned through 2019 and largely as a byproduct of the protracted trade feud, consumer sentiment and consumer spending has held up rather well, even better than expected. As of late, however, investors and economists alike have questioned how long this period of waning business sentiment can be offset by a strong consumer. Investors will get another clue that aims at answering this question by way of the Census Bureau’s monthly retail sales.
As shown in the MarketWatch table below, retail sales for the month of September are estimated to come in with growth of .3% and .2% ex-autos.
And when we look back at the latest September auto-sales estimates, they came in pretty strong once again. The BEA released their estimate of September vehicle sales last week. The BEA estimated sales of 17.19 million SAAR in September 2019 (Seasonally Adjusted Annual Rate), up 1.1% from the August sales rate, and down 0.7% from September 2019. Sales in 2019 are averaging 16.96 million (average of seasonally adjusted rate), down 1.1% compared to the same period in 2018. Auto sales should continue to support the total monthly retail sales data.
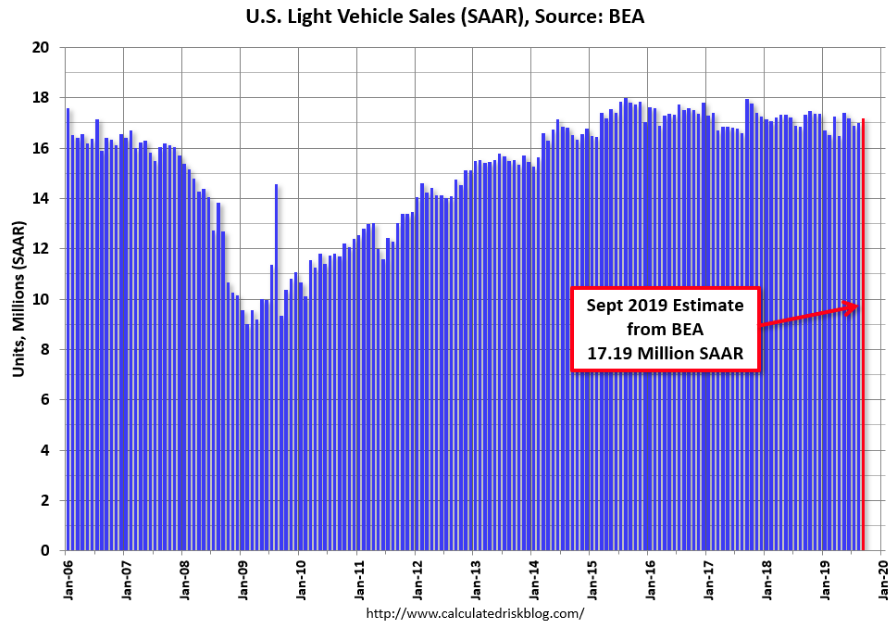
As mentioned previously, Finom Group is not expecting a significant boost in MoM retail sales for September. A lot of retail sales strength from the spring and through the summer might demand of some slowing in the September period and as consumers pay down some degree of debt. Additionally, ahead of the holiday season we would not be surprised to see greater savings during the September period. Having said that, we do expect YoY retail sales growth to maintain above 3 percent, a slow down from the previous annualized run rate but healthy nonetheless.
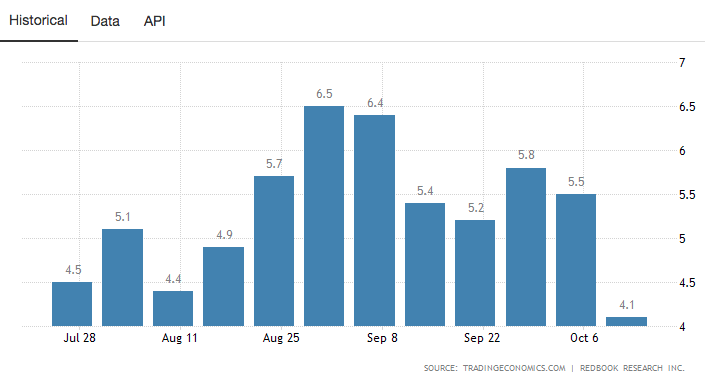
With all that being said, the latest look at Johnson’s Redbook retail sales for the month of September did appear to shown signs of strength from the previous month. The Johnson Redbook Index measures the growth in the U.S. retail sales. The index is based on the sales data of around 9,000 large general merchandise retailers representing over 80 percent of the equivalent ‘official’ retail sales series collected and published by the US Department of Commerce.
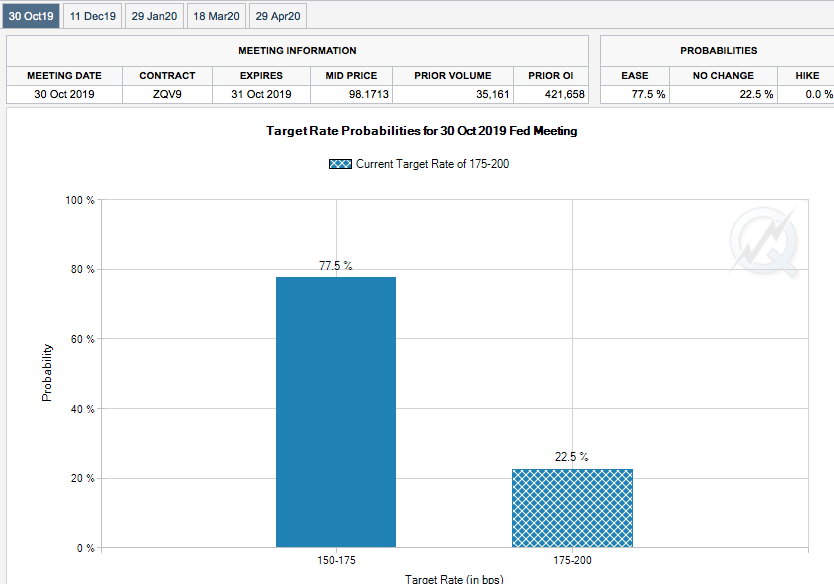
This week will also mark the final week before the Fed officials go dark and enter their so-called quiet period. Several Fed speakers will be making “the rounds” through week’s end. The main question asked of these regional Fed Presidents is related to the next rate decision. At present, the market is expecting and pricing in yet another 25 bps rate cut.
With the VIX collapsing over the first two trading days of the week, the fear gauge is getting a little bit of a boost here Wednesday morning. Wednesday also marks the beginning of a new VIX-Futures (November) cycle. And start it will, with a rather robust roll yield. Take a look at the VIX Futures Term Structure metrics and curve below:
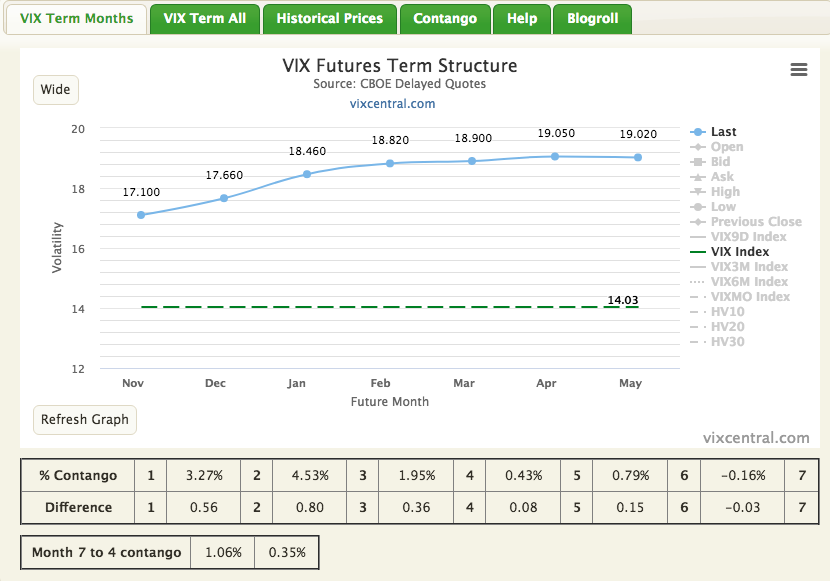
What is roll yield you might be asking? Roll yield is the difference between the spot price of the VIX future (November/m1) and the current spot VIX price/level. With each passing calendar day, the VIX future will need to edge closer to spot VIX and converge onto it at the expiration date. This particular VIX future cycle (November) will have 34 days until expiration, which is above the average of 30 days. As such, we assert that one of the lesser reasons for the significant roll yield is in part due to the elongated futures cycle.
Given the current roll yield is above $3, it suggests that futures don’t agree with the current level of spot VIX. We’ll see just how much decay is expressed in VIX futures over the next 34 days, as the convergence process unfolds. One thing we can say is that contango is very light at just 3.27%, but roll yield does favor duration short-VOL positioning as of the commencement of the new VIX futures calendar cycle.


