
Welcome to another trading week. In appreciation for all of our Basic Membership level participants and daily readers of finomgroup.com content, we offer the following excerpts from within our weekly Research Report. Our weekly Research Report is extremely detailed and has proven to help guide investors and traders during all types of market conditions with thoughtful insights and analysis, graphs, studies, and historical data. We encourage our readers to upgrade to our Contributor Membership level ($14.99/monthly, cancel anytime) to receive our weekly Research Report and State of the Market videos. Have a great trading week and take a look at some of the materials from within this week’s Research Report…
Research Report Excerpt #1
As we look at the performance for the S&P 500 month-to-date, we recognize there are only 5-trading sessions left in the month of April. Since the March 31 closing date, the index is higher by a measly 24 points, or roughly .50 percent.
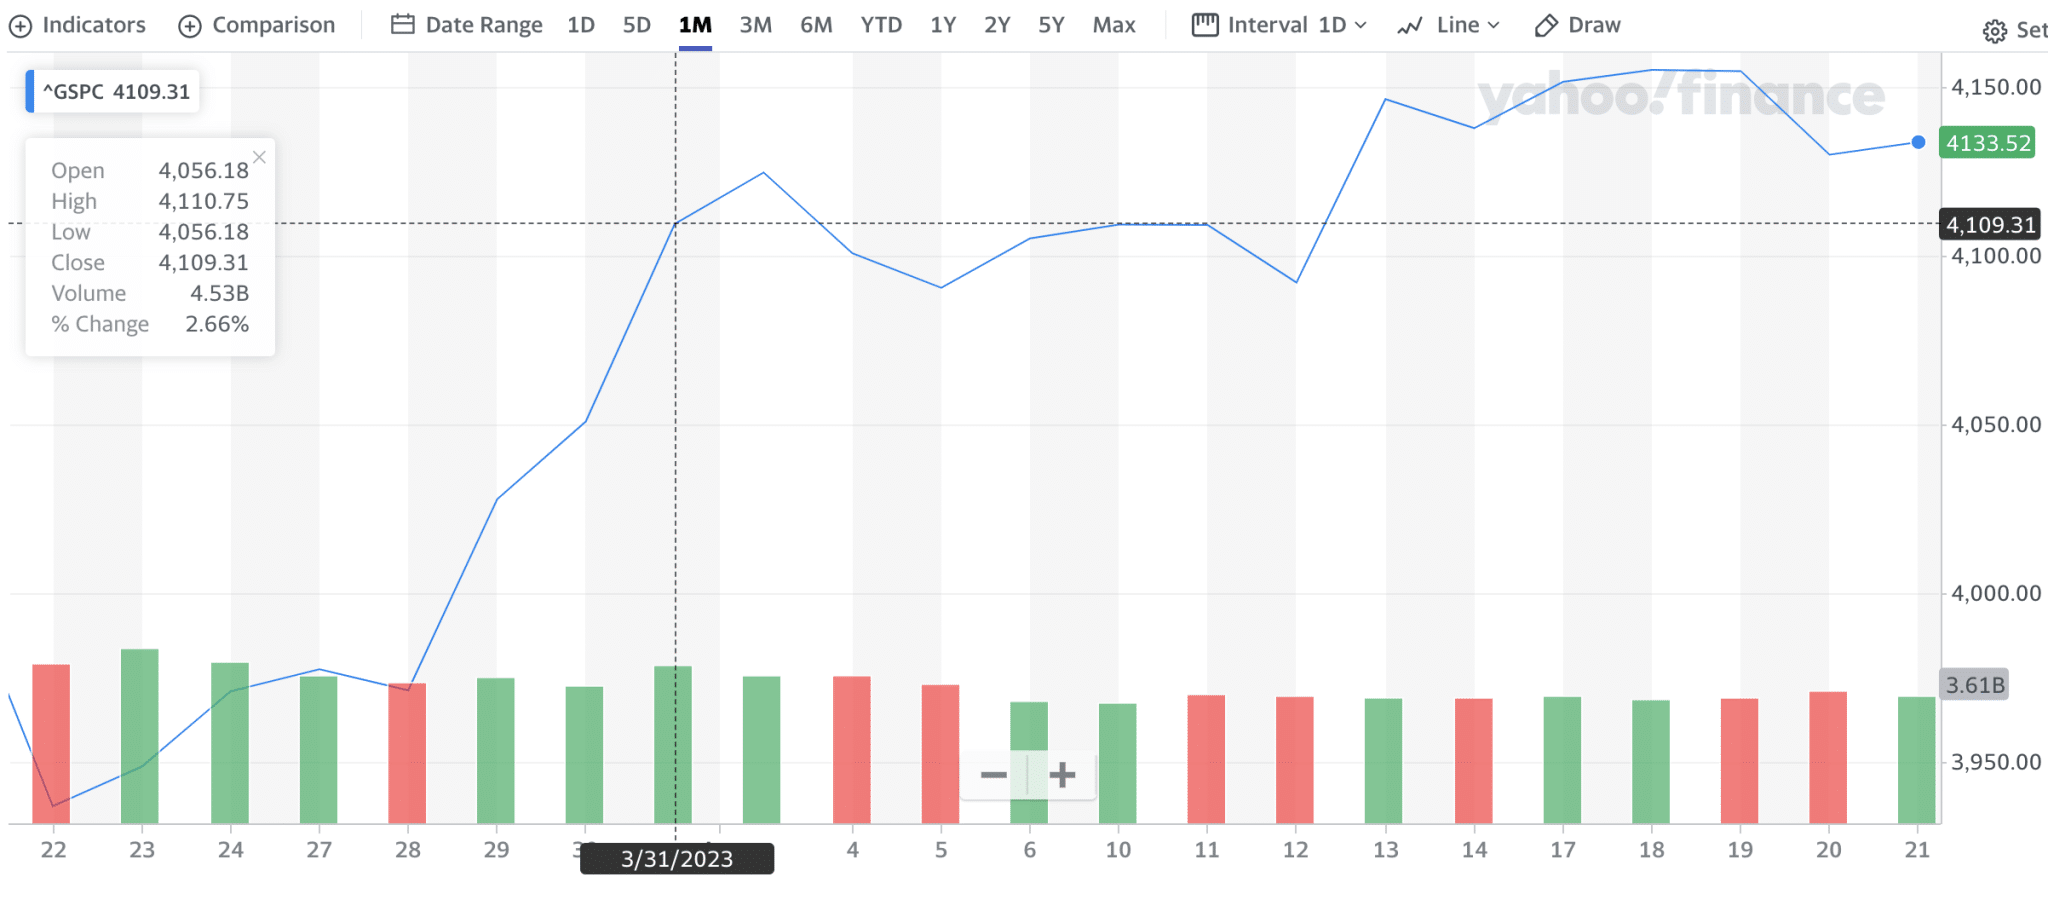
Volatility has subsided during the month of April as well, which is rather consistent with a sideways market. What’s holding the index back, and from breaking out? I would suggest it is not one thing, not 2 things, but a multitude of variables that include the inevitable debt-ceiling debate, which looms large for the coming summer months.
Research Report Excerpt #2
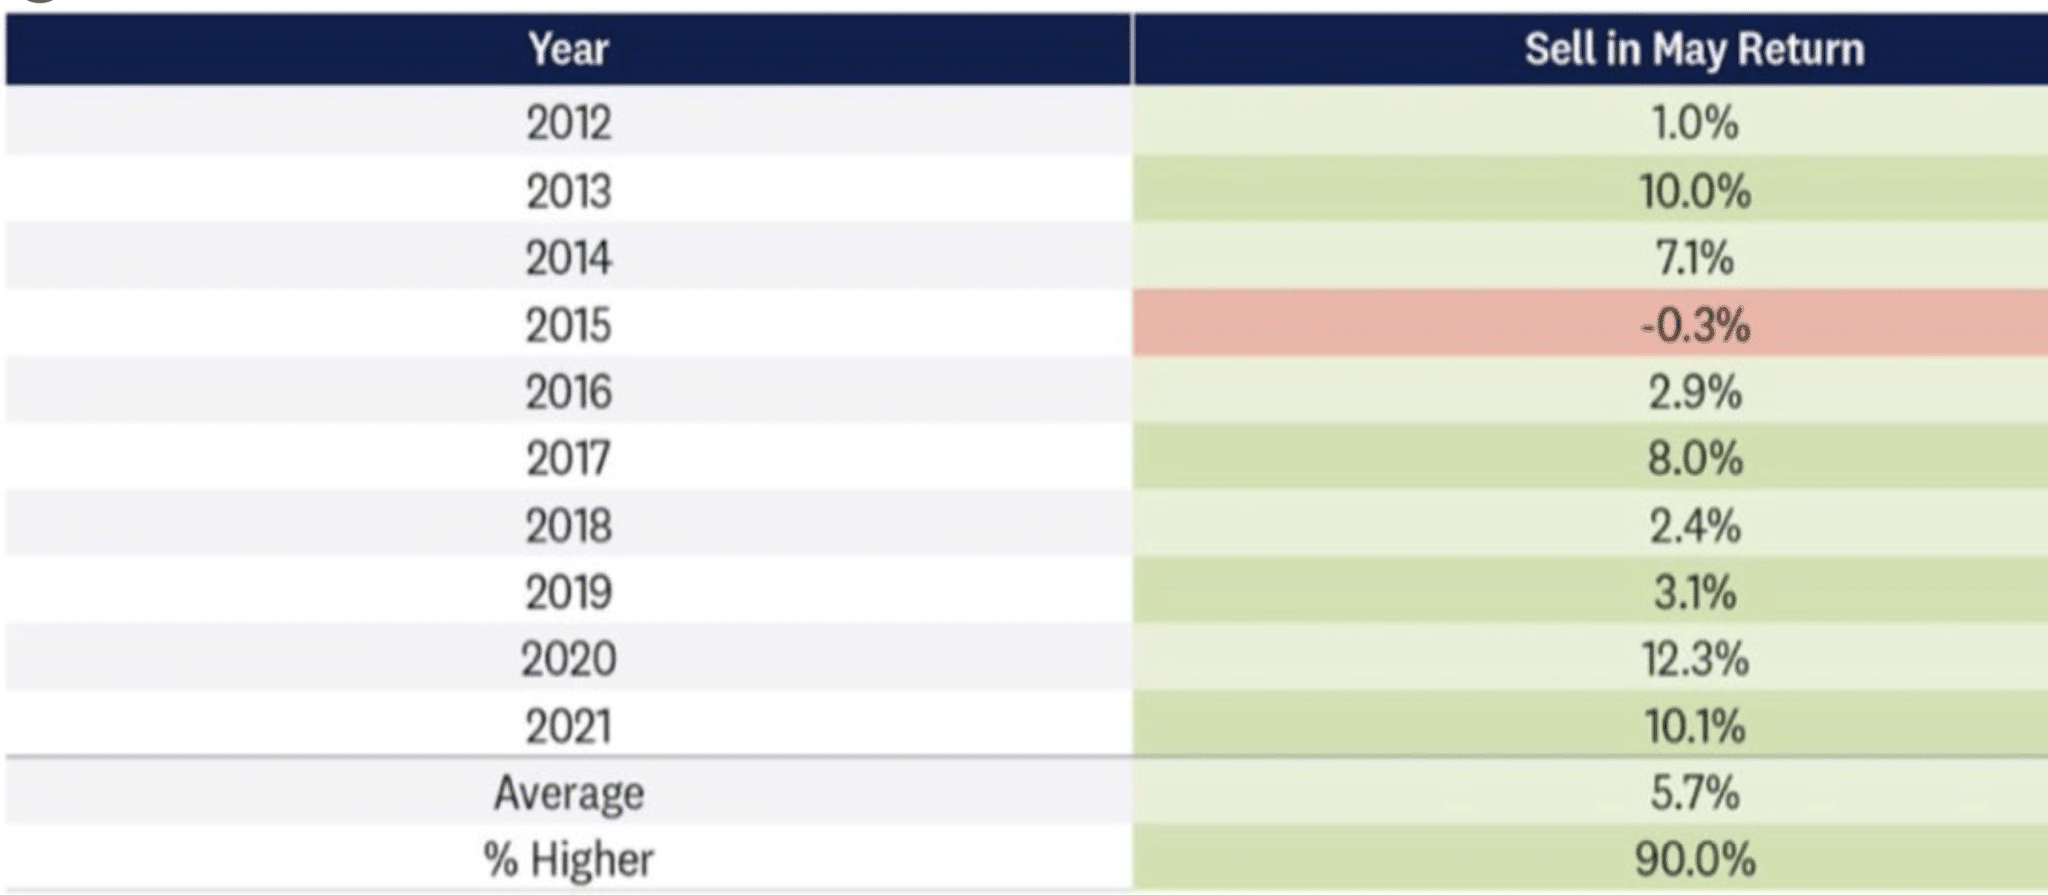
In 2022, the “Sell In May & Go Away” (May-Oct) period lost -8 percent. This was the 1st negative return since 2015 in the Sell in May period. Fact: Since 2008, here are the negative returns for the Sell in May period (2008, 2011, 2015, 2022-?? ), which was followed by a positive Sell in May period the following year each time. If the pattern continues, it suggests a positive return for the 2023 Sell in May period.
Research Report Excerpt #3
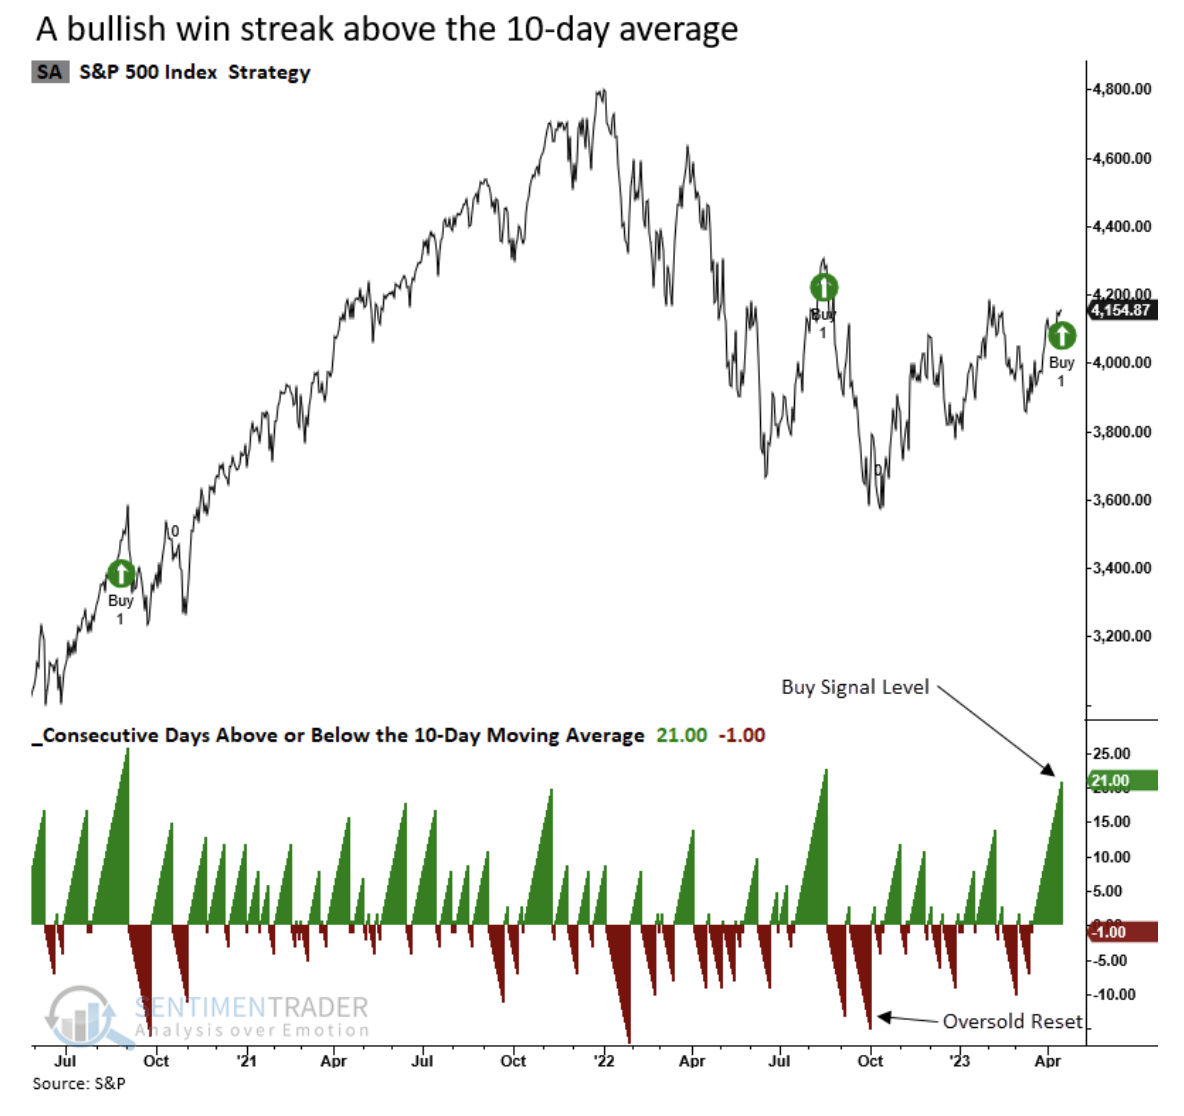
“The S&P 500 closed above its 10-day average for 21 consecutive trading days, triggering the second buy signal for a TCTM Composite Confirmation Model component in seven months. After similar price trend alerts over the last 95 years, returns, win rates, and z-scores for the S&P 500 were excellent across medium and long-term horizons, especially if a signal occurred after a 1-year low, which it did.”
Research Report Excerpt #4
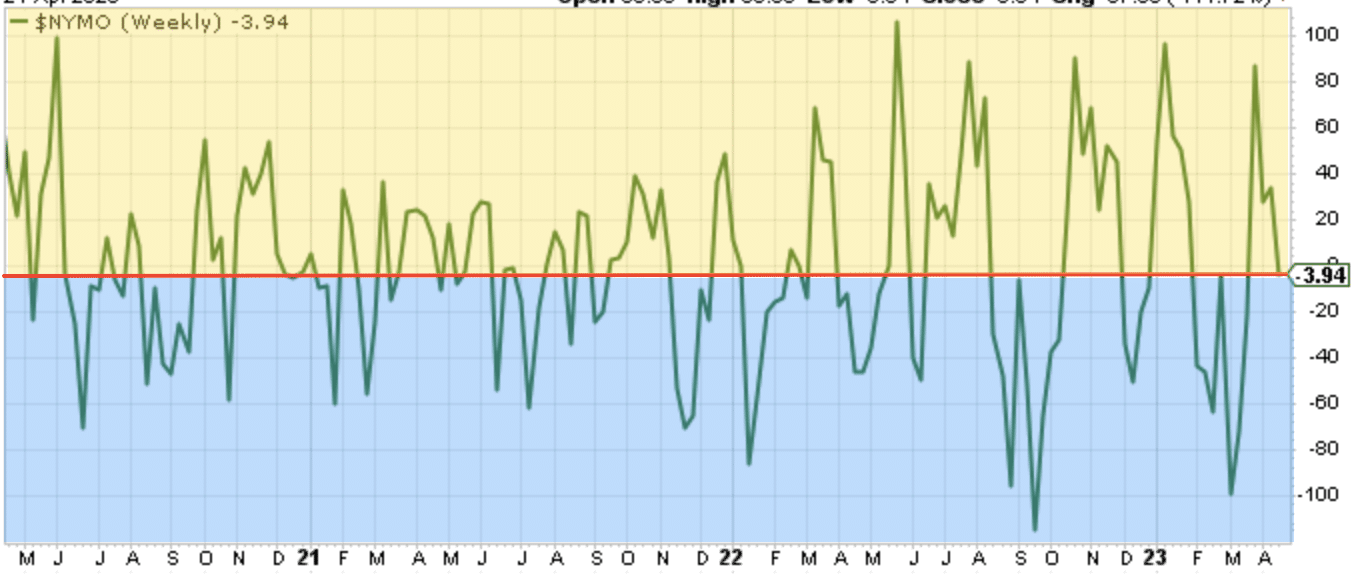
We’re also not seeing a positive set-up for the coming week, at least not the onset of the trading week. The McClellan Oscillator (NYMO chart above) is a market breadth indicator that is based on the difference between the number of advancing and declining issues on a stock exchange, such as the New York Stock Exchange. A positive and rising indicator suggests that stocks on the exchange are being accumulated. A negative and falling indicator signals that stocks are being sold. Typically such action confirms the current trend in the index. At present, the NYMO did confirm the slight decline in the NYSE and large-cap peers for the week. It finished the week in negative territory (-3.94) but not indicating deeply oversold conditions. Additionally, and as color-coded in the chart above, NYMO rarely stops its downtrend at the current level; it typically falls further into “frigid waters.” Breadth momentum is not favoring the bulls into the coming week. As we know, things can shift quickly in markets, but holding the right and evidenced expectations is crucial to game planning and executing that game plan.
Research Report Excerpt #5
Nonetheless, it is important to note the index moved back into positive territory for the first time in 5 months. Most of the relevant components in the Empire State PMI demonstrated sharp increases.
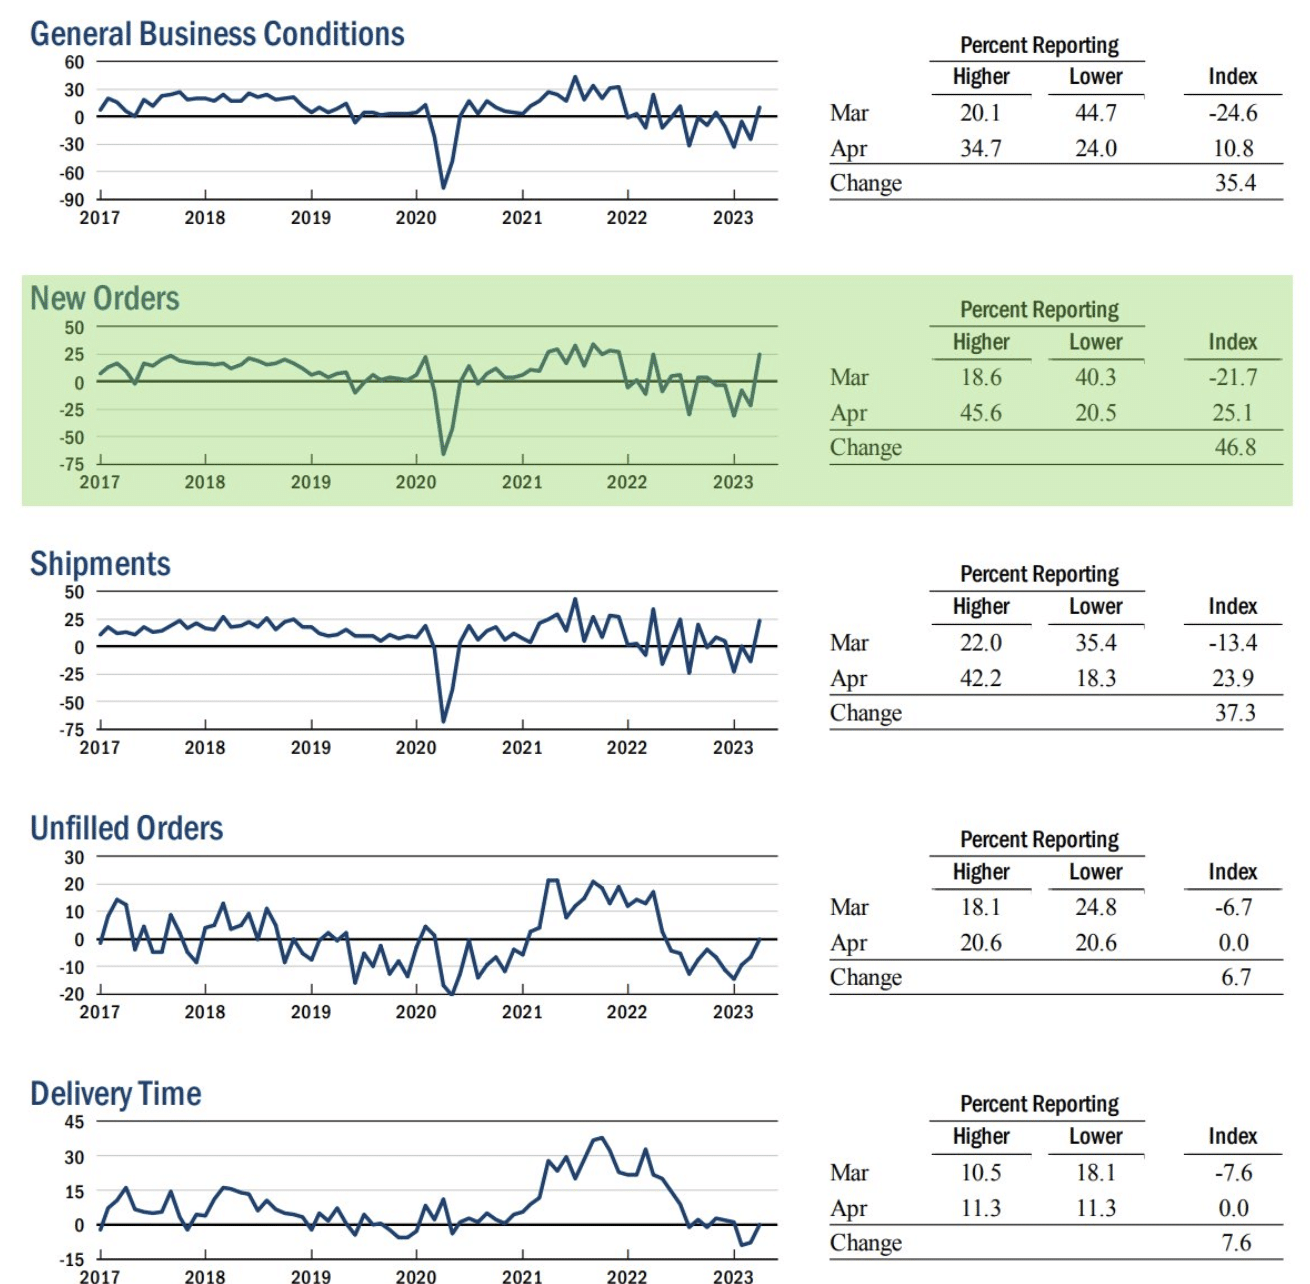
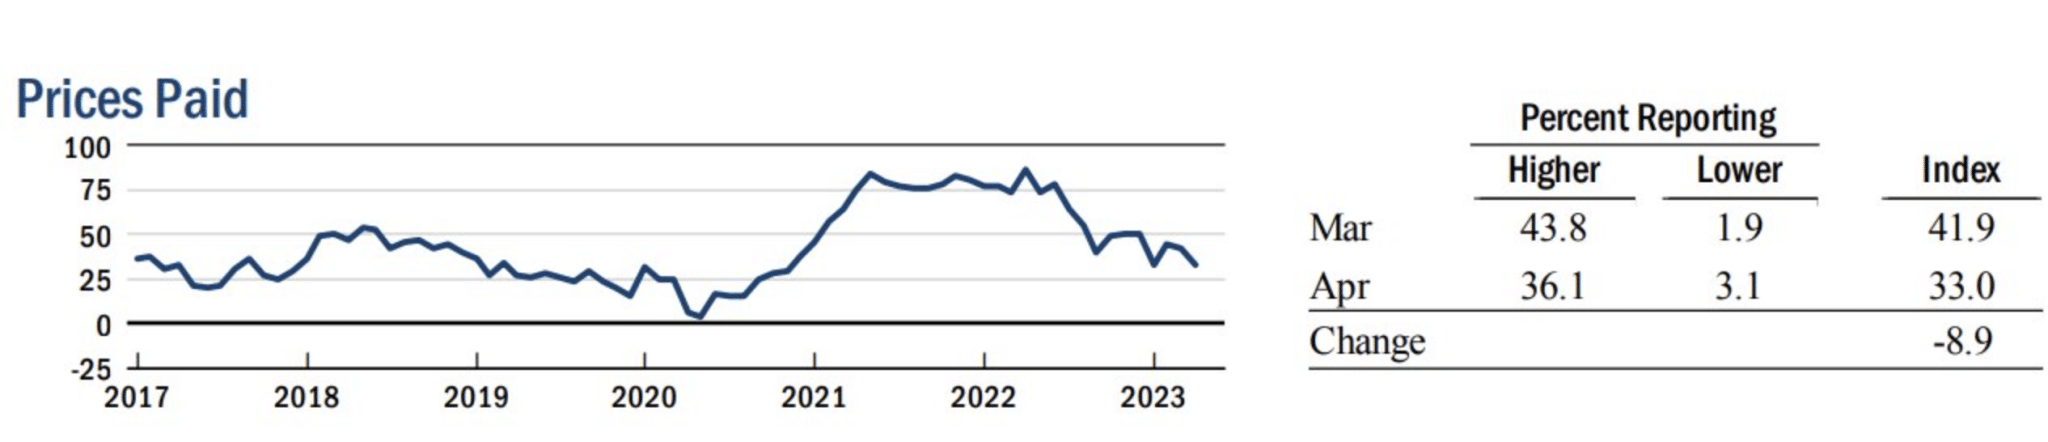
The one area of the Empire State PMI feared to have increased alongside such an advance in the survey would have been Prices Paid. Fortunately, this sub index continued its downtrend, which should serve to sustain the overall disinflation process that began in 2022.
Research Report Excerpt #6

March marked 12 consecutive monthly declines for LEI, which has only been reached and/or exceeded during recessions that started in 1973, 1980, and 2007. The last time it hit the 12-month mark was March 2008, which was when Bear Stearns collapsed. An imperfect and softening economy indeed, but keep in mind that the Coincident Economic Indicators (CEI) hit an all-time high in March.
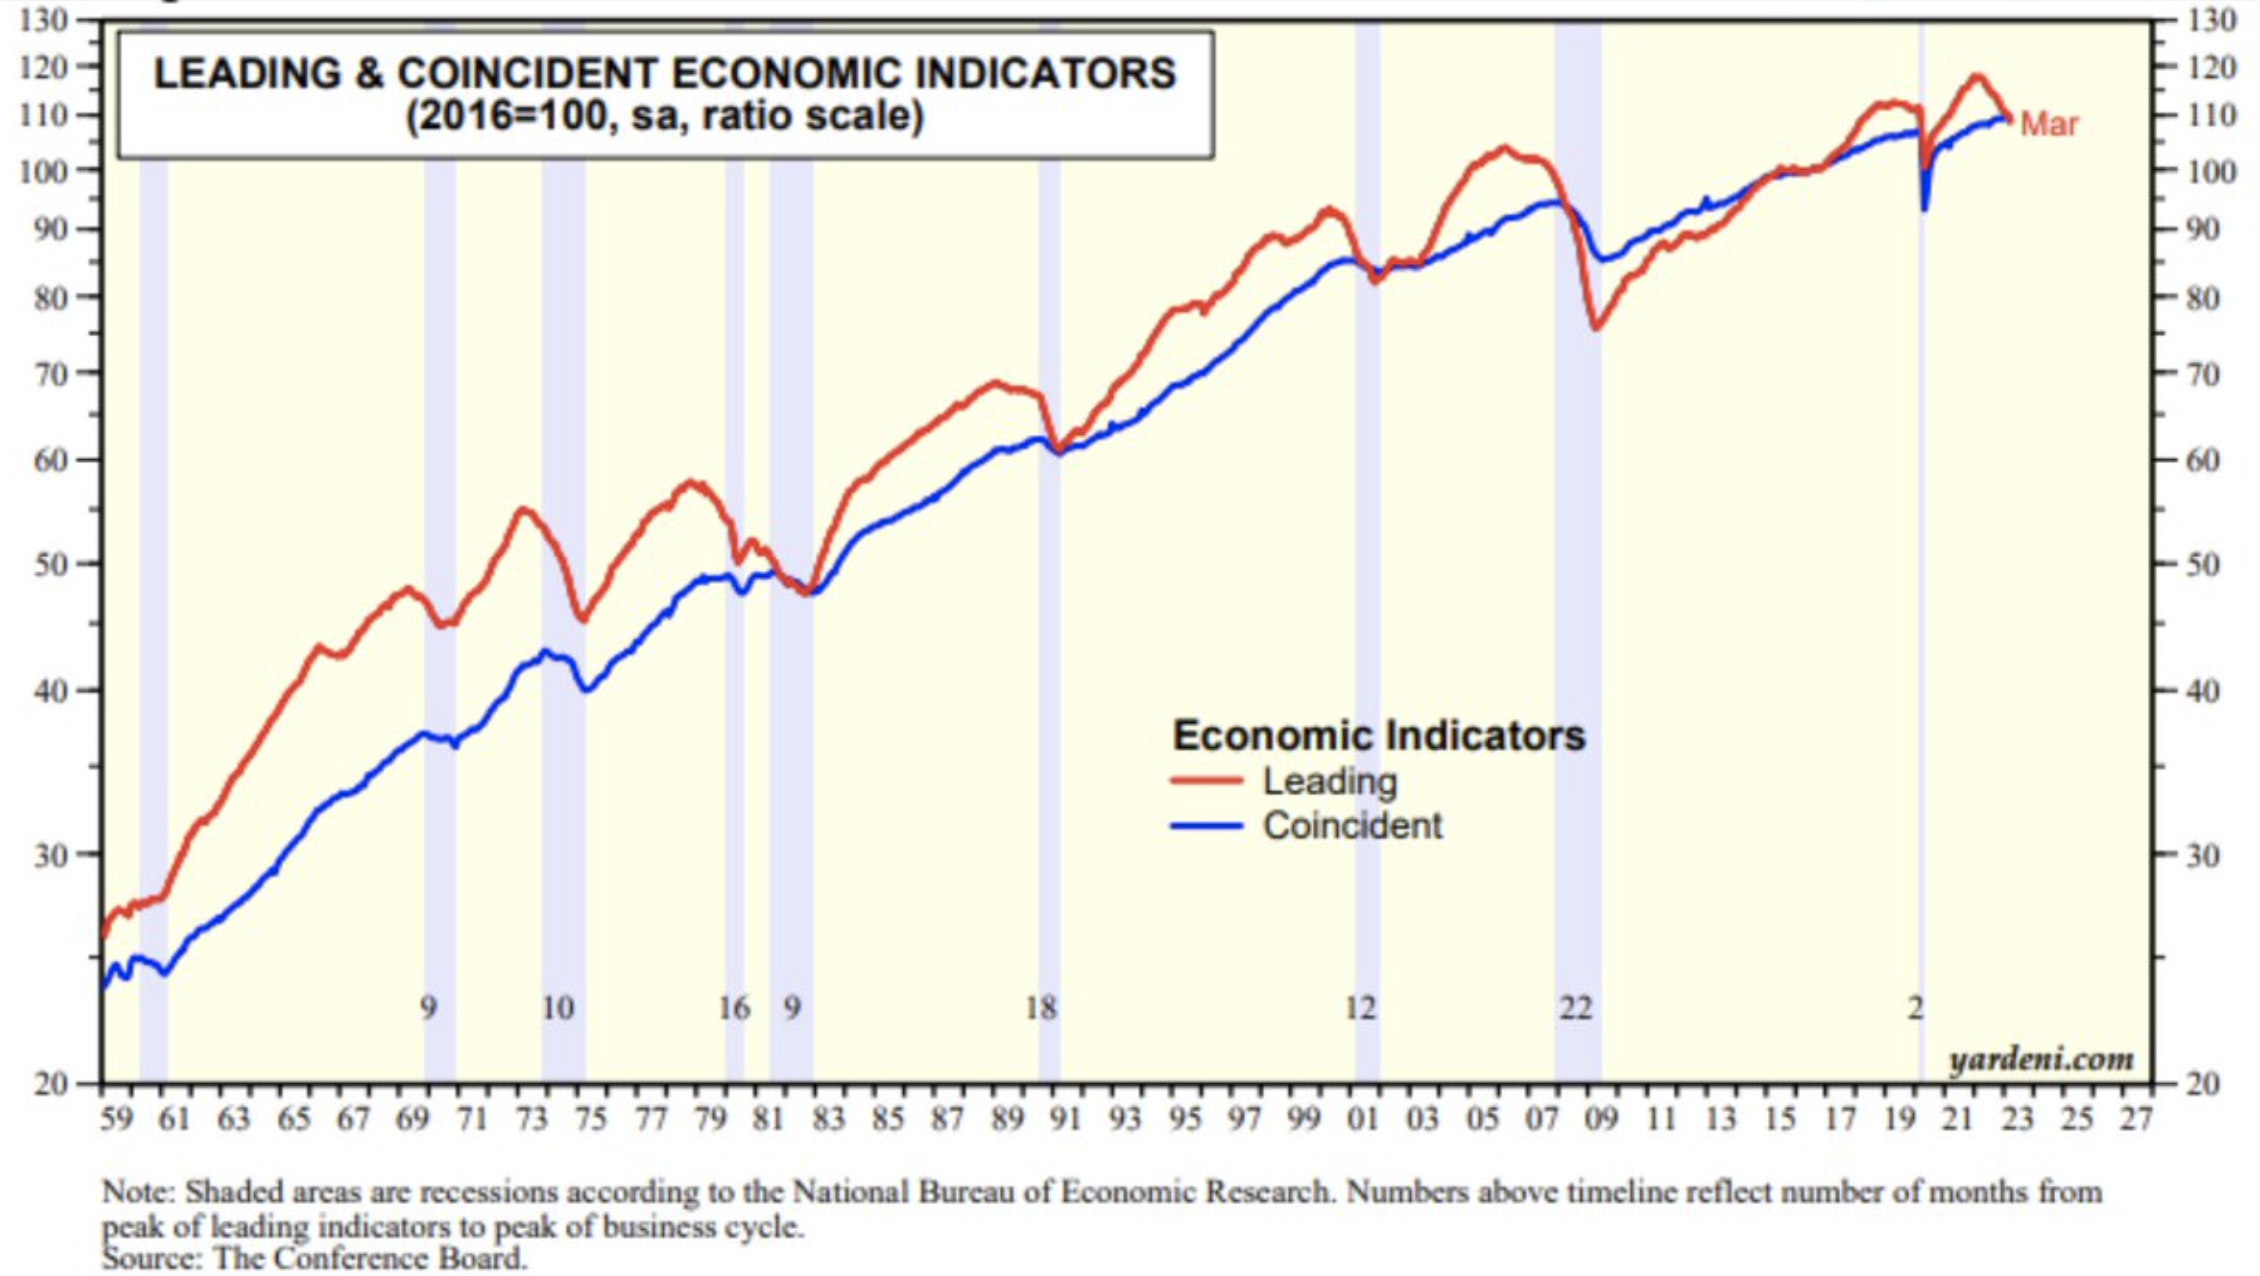
The CEI has a more closely correlated relationship with the National Bureau of Economic Research’s “recession” measurements and a new high in the CEI does not suggest a recession is afoot.
Research Report Excerpt #7
And then came Friday’s S&P Global PMI, which like the Empire State PMI, showed a meaningful bounce back into expansion territory. The Composite PMI jumped to an 11-month high, with both Services and Manufacturing surging off of recent lows, pushing the Manufacturing component and overall PMI back into expansion territory.
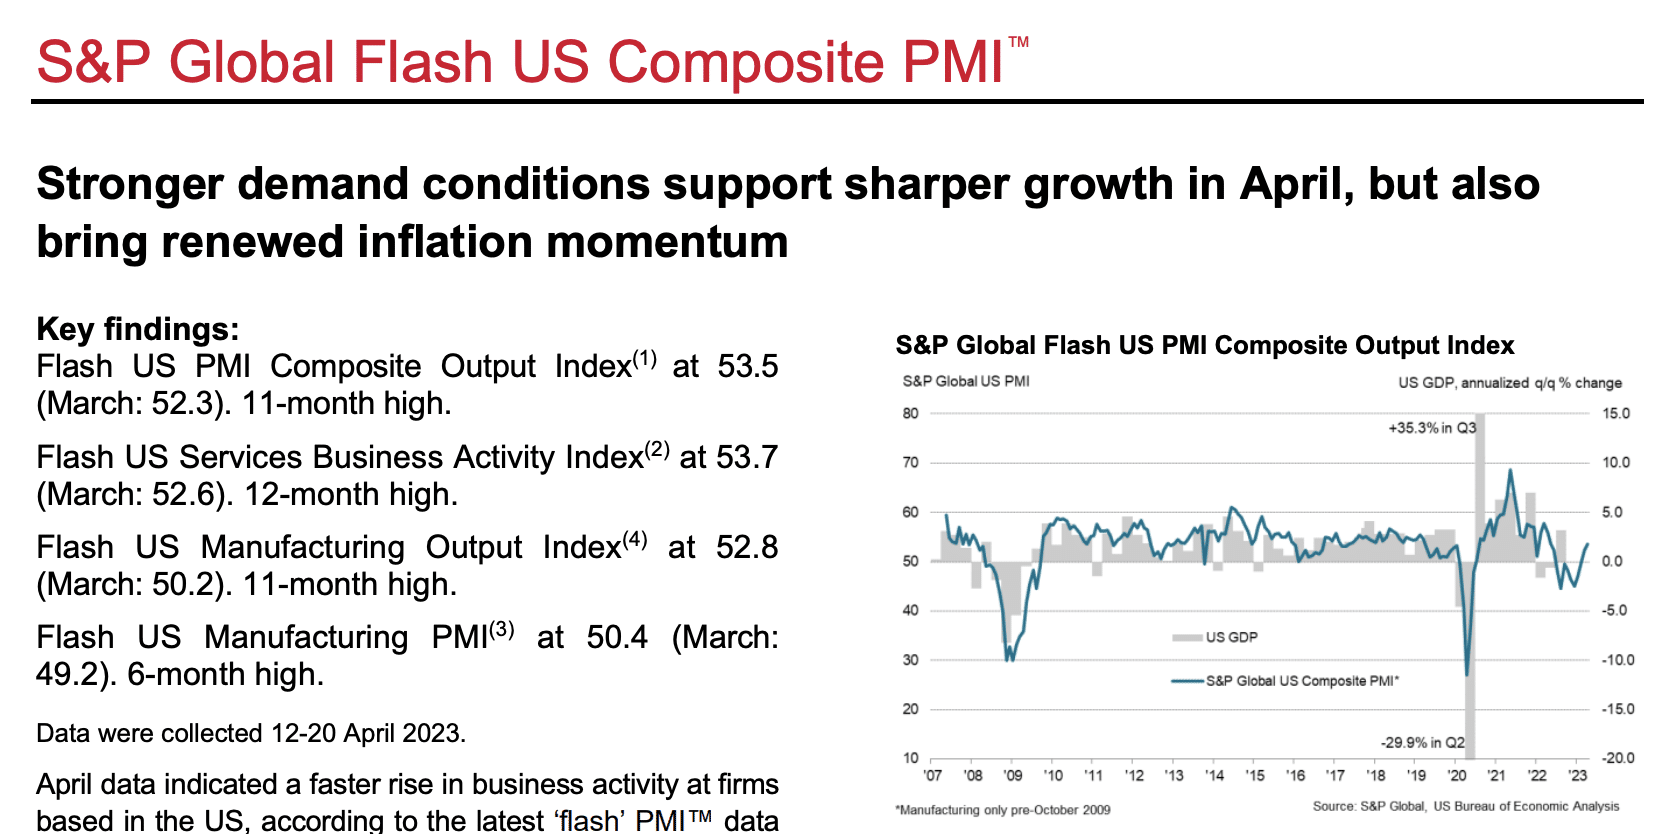
Confused yet? Don’t worry, most have been and remain as such. There are a great many moving parts in the economy which continue to point to an ongoing expansion cycle, which is backstopped by a still tight labor market.
Research Report Excerpt #8
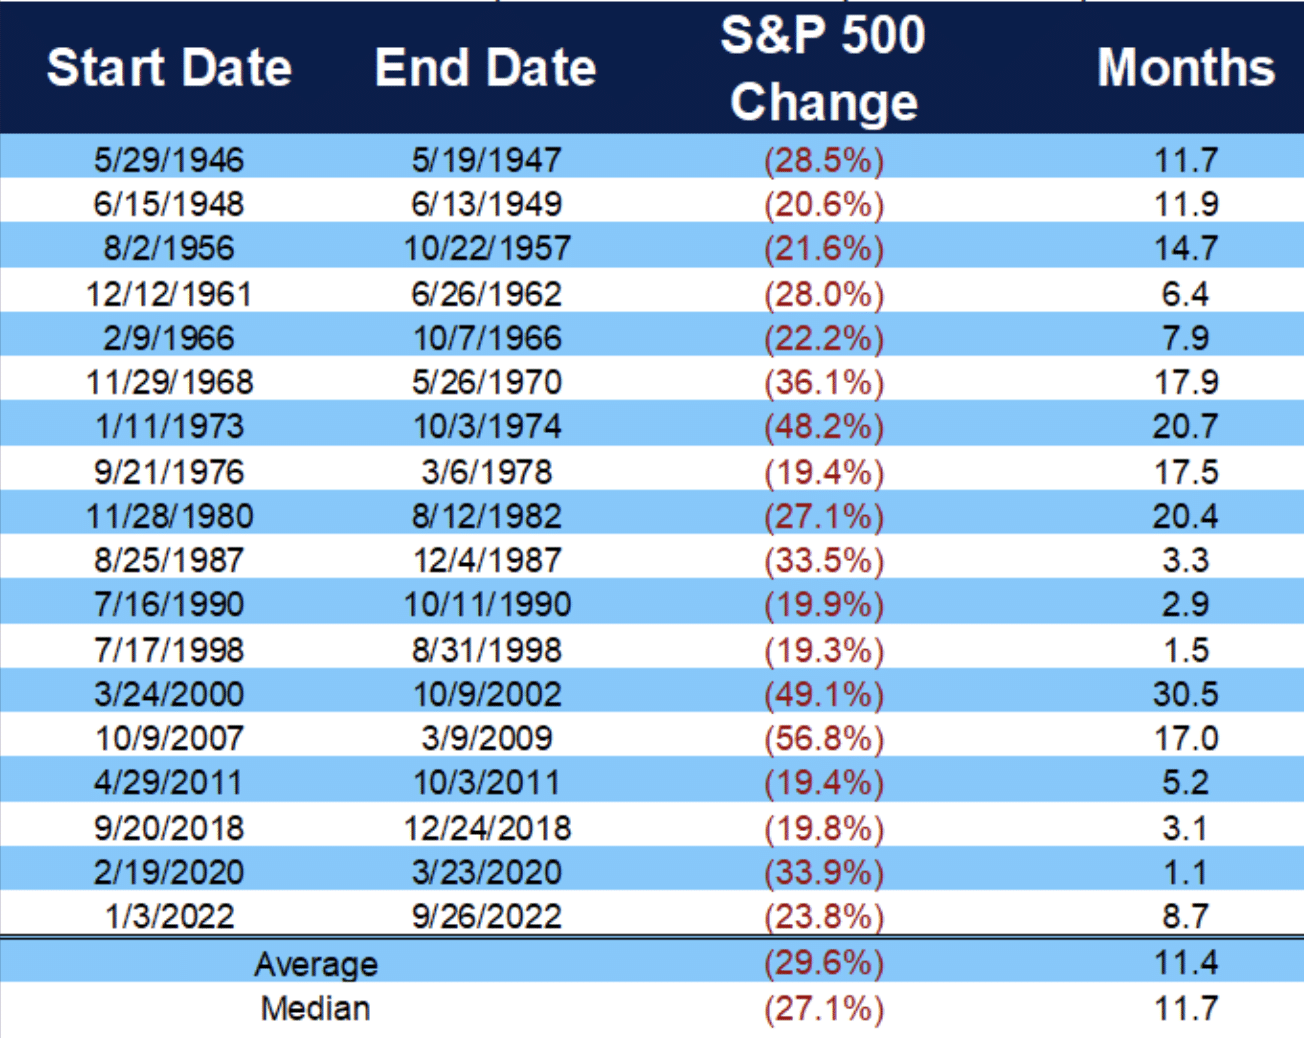
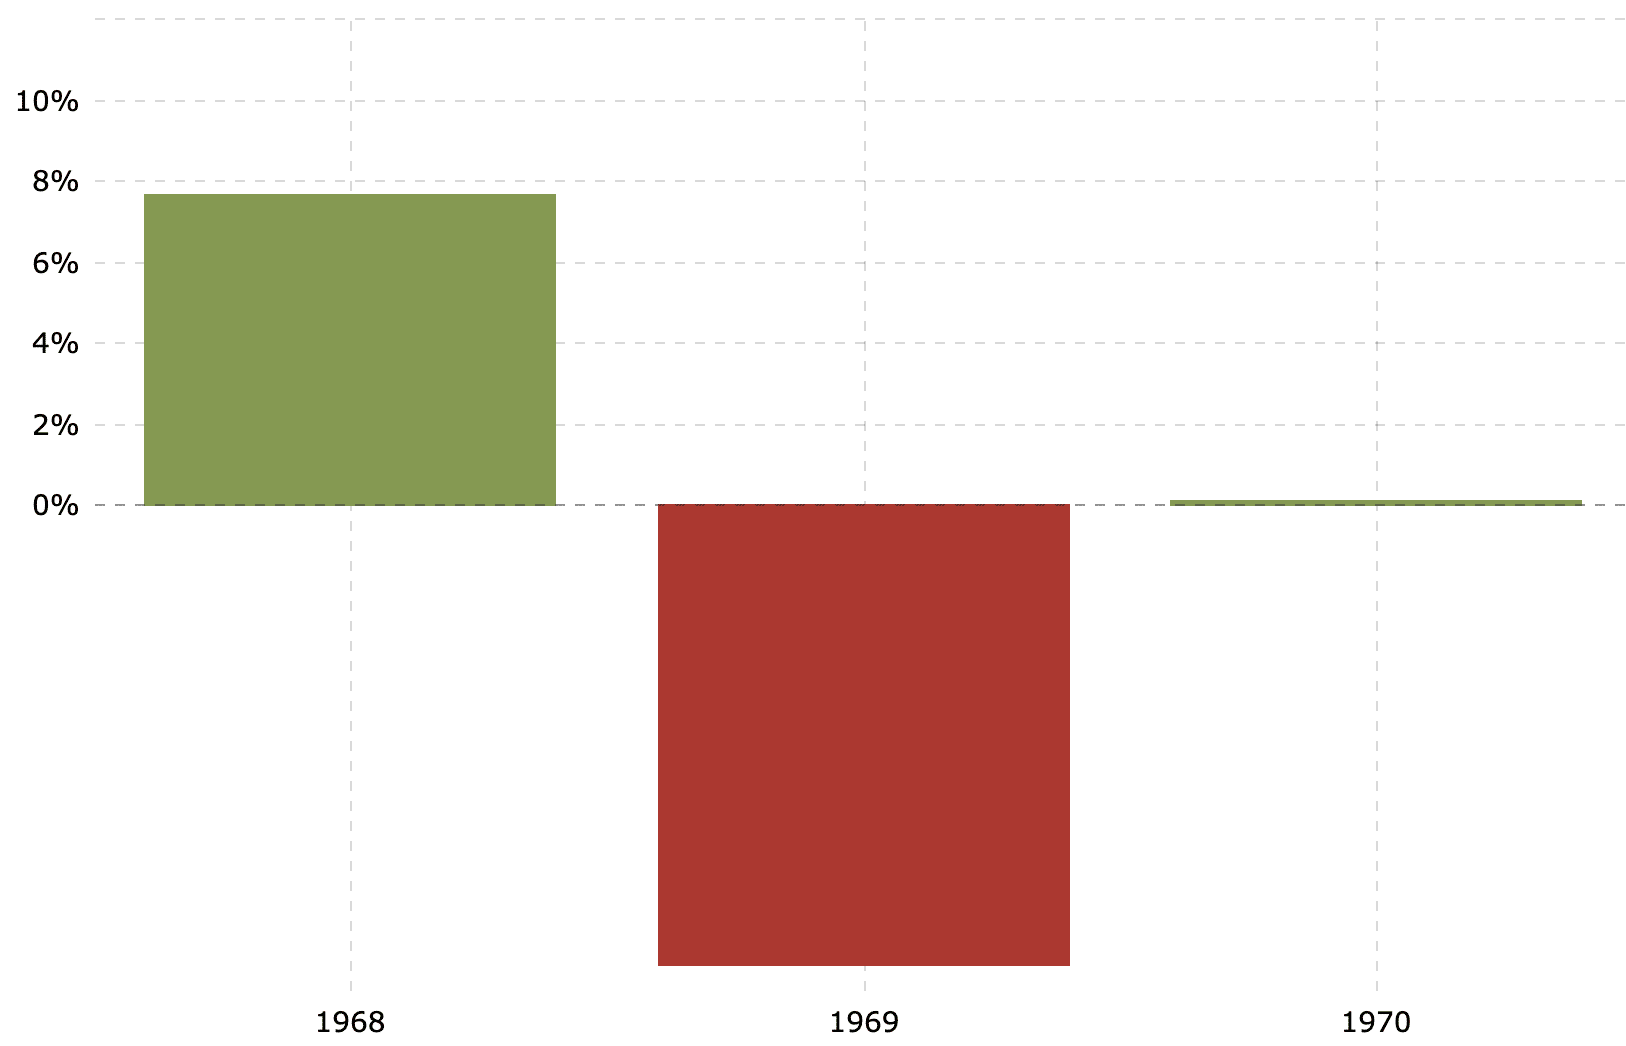
1970 was a recession year, with a POSITIVE S&P 500 return as well. This particular year did have a bear market that did trough in the recession year. The recession pricing, however, began in November of 1968. The table below identifies bear and near bear markets since WWII, as well as their Start Date and Duration.
It was not a robust market gain during the recession year of 1970, but at .68%+ on a total return basis (including dividend), it was a positive return nonetheless. This serves to further evidence that savvy investors should remain invested and net buyers of consolidation phases associated with the year-to-date uptrend. Not many market participants are anticipating positive full-year returns in 2023, especially as they look toward a possible recession and declining earnings per share. (S&P 500 annual return chart below)
Research Report Excerpt #9
Having said that, historically the market has a tendency to bottom BEFORE the EPS actually bottoms, as evidenced in the chart below:
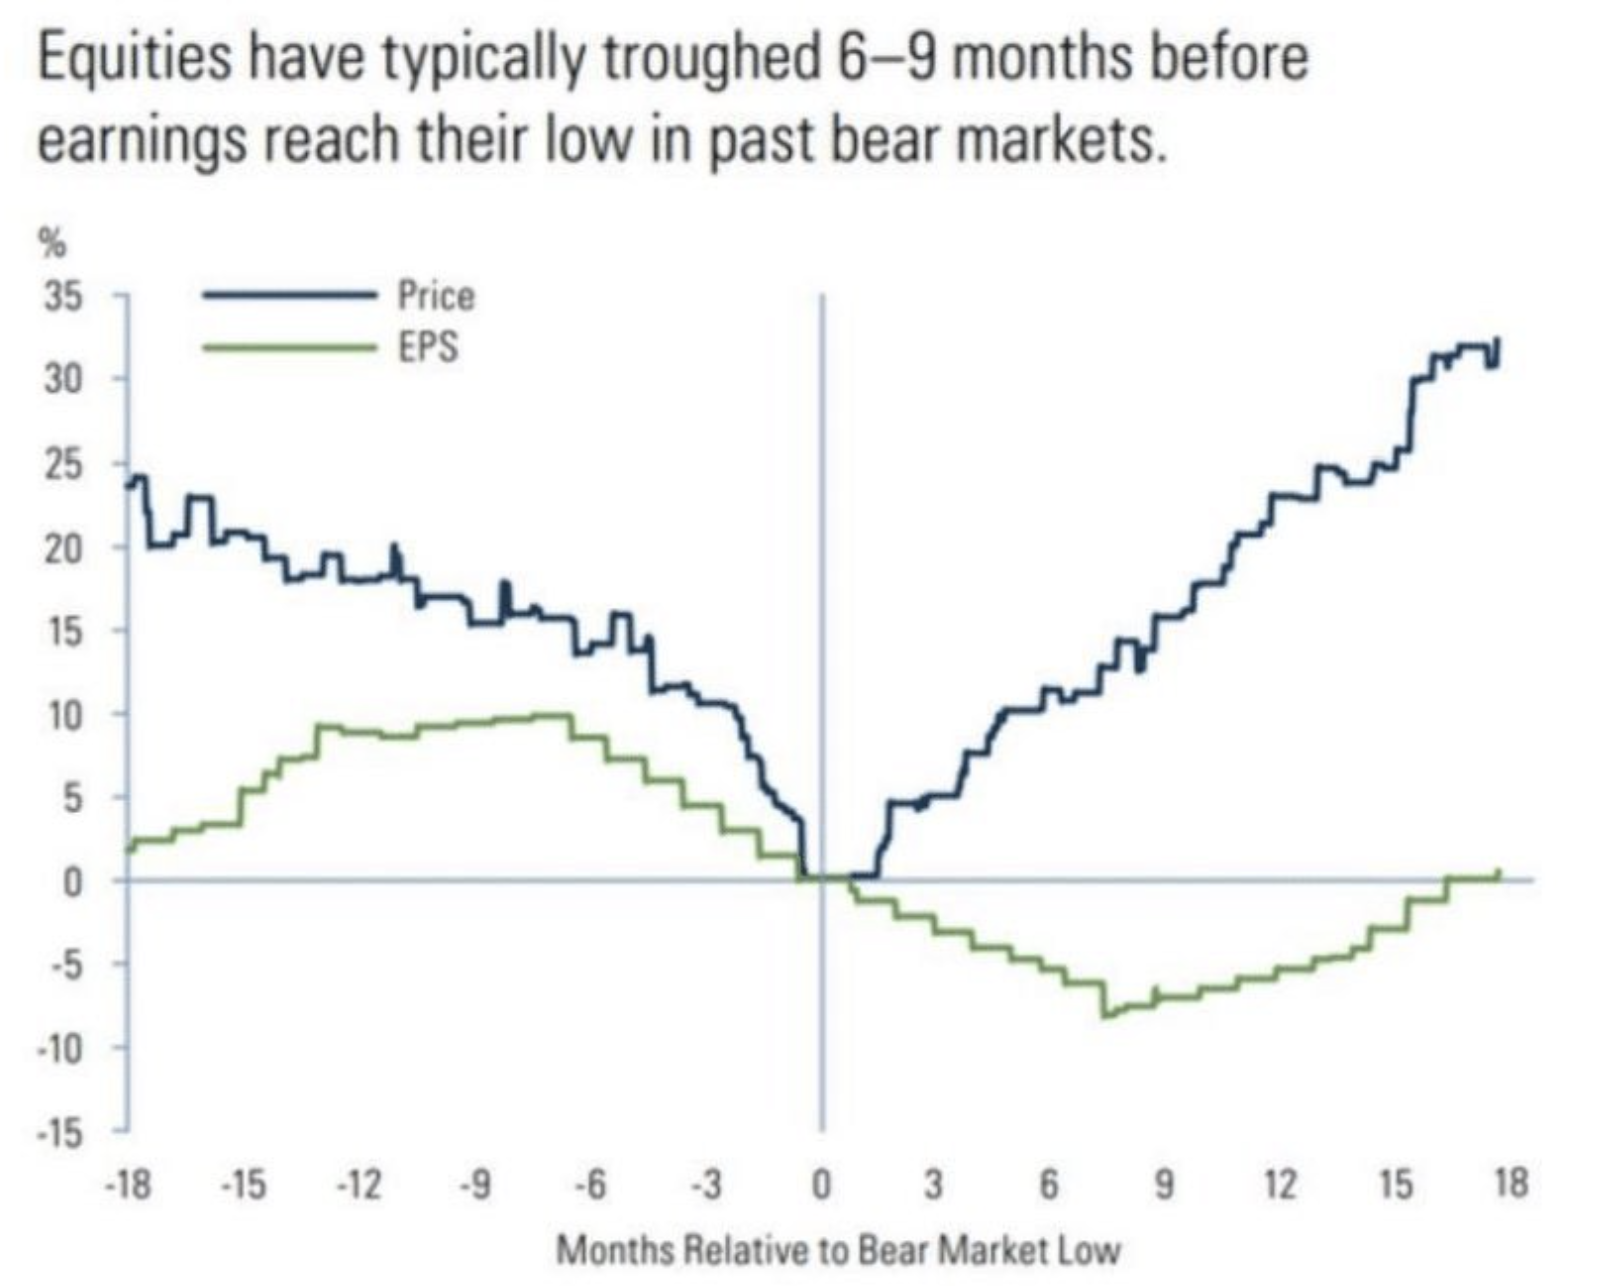
Historically, equities have bottomed before earnings, the economy, and well before most investors get back to a fully invested allocation. Market leads, fundamentals tend to follow.


