
Wall Street was in a rather somber move on Tuesday and coming off of a 3-day weekend. The major averages all fell greater than 1% on the day, led by a near 2% drudging by the tech-heavy Nasdaq (NDQ). What was a little scary from an intraday risk assessment basis was the realization of the S&P 500 (SPX) weekly expected move in a single day. As noted in Finom Group’s weekly research report, published Sunday morning, the S&P 500 weekly expected move for the current trading week is $41/points. At one point during Tuesday’s trading session, The S&P 500 fell greater than $41/points. Given Tuesday’s move we are forced to realize that headline risks are moving markets greater than earnings reporting presently. Much of the market headlines from Tuesday continued to come out of Davos or relate to slowing economies of scale and global trade.
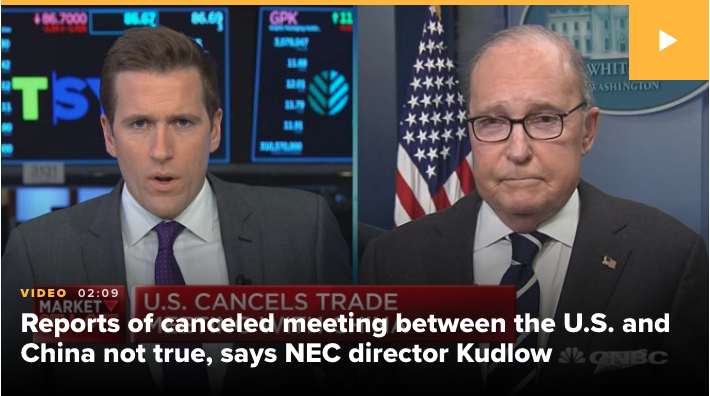
The biggest headline for U.S. markets came shortly after European markets closed for the day on Tuesday and was related to U.S./China trade relations. As the 90-day pause in additional tariffs moves closer to the deadline date in March, negotiations and headlines surrounding those negotiations have been frantic. On Tuesday, the White House rejected a trade planning meeting with Chinese counterparts this week due to outstanding disagreements between the two sides over the enforcement of intellectual property rules.
Officials from the U.S. trade representative’s office were set to meet with two Chinese vice ministers this week to try to resolve trade differences before the March 1 deadline, but the meeting was called off. Should Beijing and Washington fail to agree on a permanent solution, President Donald Trump has said he will reinforce punitive tariffs on roughly half of all Chinese exports to the U.S.
The White House told CNBC that “the teams remain in touch in preparation for high level talks with Vice Premier Liu He at the end of this month.” White House economic advisor Larry Kudlow denied that an official meeting had been canceled, telling CNBC on Tuesday that no intermediate meetings had been scheduled other than the visit by Liu next week.
“I would kind of characterize negotiations as generally moving in the right direction. Last week, China offered a fig leaf in lowering tariff rates and agreed to import a trillion dollars of U.S. goods by 2024,” said Joseph Lupton, global economist at J.P. Morgan.”
With good and bad trade headlines circulating on a weekly basis and concerns over economic policies taking center stage at Davos, investors have been keenly tuned into the meandering narratives. According to Goldman Sachs analysts led by David Kostin, this rally from oversold conditions is masking the effect that the shutdown and uncertainty over trade policy is having on stock prices, absent these headwinds, Kostin argued, valuations would be higher today.
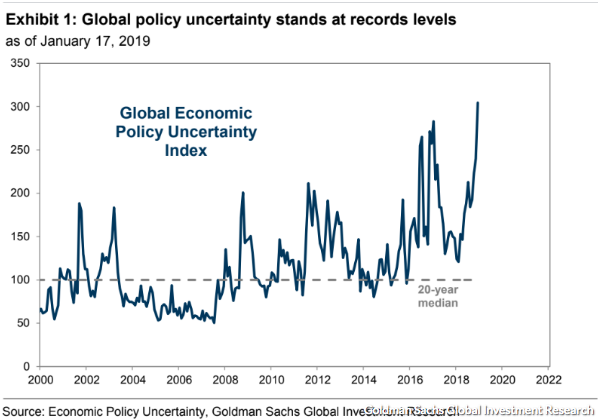
Kostin points out that the Global Economic Policy Uncertainty Index, which measures policy uncertainty by analyzing the text of newspaper articles, just reached an all-time high of 304, “more than 3 times the historical median reading of 101,” he wrote.
Kostin also points out that the “equity risk premium,” or the spread between the S&P 500 earnings yield and the yield investors can get on risk-free 10-year Treasurys sits at 3.6%, well above the average of 2.3 percent.
This means that investors are demanding higher returns than usual to risk owning equities, a demand that is at least partially a result of heightened policy uncertainty, Kostin argued, pointing to the fact that the equity-risk premium tends to rise when policy uncertainty is high. All else equal, a higher equity premium is associated with lower stock prices.
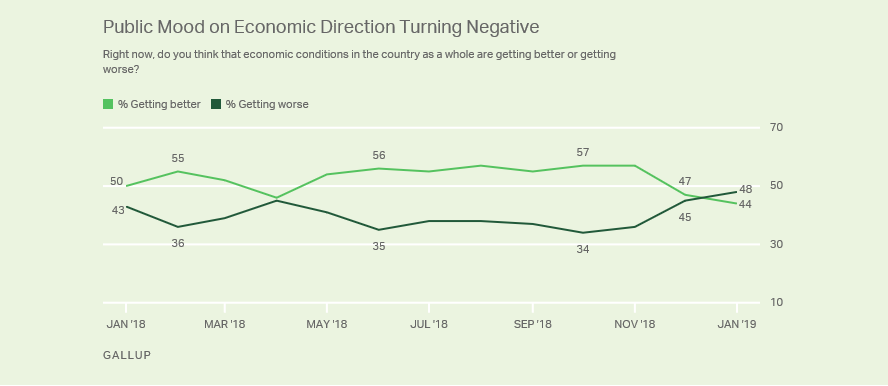
Investors and analysts aren’t the only ones feeling uncertain about the stock market or the economy; the average American has similar concerns and fears over the future of the American economy. Almost half (48%) of Americans say economic conditions are worsening, up from 45% in December and 36% in November, according to a recent poll by Gallup, a Washington, D.C.-based research and consulting firm.
The government shutdown, sparked by a debate between President Trump and Congress over funding for Trump’s proposed border wall, is the latest political action to affect the economy, according to Steven Blitz, chief U.S. economist at TS Lombard. Other “missteps” that could hurt the economy include the U.S.’s trade battle with China and the Federal Reserve’s pace in future rate increases, the economist said.
A White House report estimated the partial government shutdown will trim growth in first-quarter gross domestic product by 0.5 percentage points if it lasts through January, what with less government spending and more private contractors out of work.
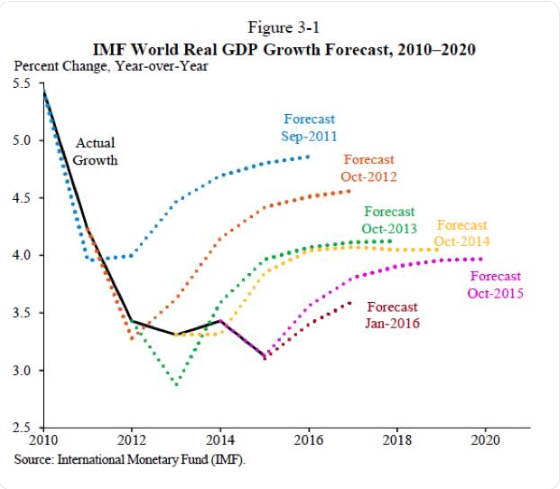
As we mentioned in our Daily Dispatch article on Tuesday, the IMF has downgraded its global economic growth forecast for 2019. In its second downgrade in three months, the lender blamed softening demand across Europe and recent palpitations in financial markets. It predicts global growth of 3.5% this year, beneath the 3.7% expected in October and the rate in 2018.

“The world economy is growing more slowly than expected, and risks are rising,” Managing Director Christine Lagarde told reporters in Davos, Switzerland.
While most of the slowing growth is attributed to the downgrades throughout European nation states, the U.S. and China growth outlook remain unchanged. The IMF, in truth, has a terrible track record of forecasting global economic growth. The lender almost always issues a pragmatic outlook for the world economies. As shown in the chart below, the IMF is almost always proven wrong with its forecast.
Nonetheless, the headline risks remain part of the marketplace that investors and traders must contend with. Headlines are creating an increasingly difficult market to assess, trade and breed confidence among investors. Yesterday was just one more example of just how extraordinary the current state of the market has become. From 1962-present, Tuesday became the first time in which the S&P 500 went up 11 days in a row (from daily OPEN to CLOSE), and then fell more than -1% the next day. From a technical perspective Jonathan Krinsky, chief market technician at Bay Crest Partners, is among those noting that the breadth and persistence of the 11-day rally ranks among some of the more consequential upturns on record. Among S&P 500 stocks, 71% are at a four-week high, the most since October 2011. When this reading has exceeded 60%, the S&P has always been higher a year later. (Krinsky correctly cautions that last year violated several “rules” that had previously worked 100% of the time, such as December never before having been the year’s worst month.) Yet in the nearer term after such signals, some give-back has been common. The average return one month later has been negative, in fact.
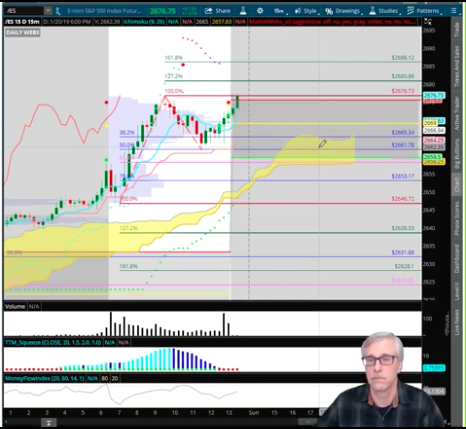
With regards to Tuesday’s technical market move, we encourage readers to review our latest Market Recap with Wayne Nelson. Please click the link to review the daily Market Recap and what Wayne found interesting and tradable during the day and after the closing bell.
In addition to the varied fundamental challenges facing the market, volatility rose sharply on the day with the VIX rising nearly 20% and back above 20. The bad news is that this increases the size of daily market moves, but there is good news. In recent articles and videos, Finom Group discussed the disparity in the VIX-VVIX ratio and how the market is pricing risk.
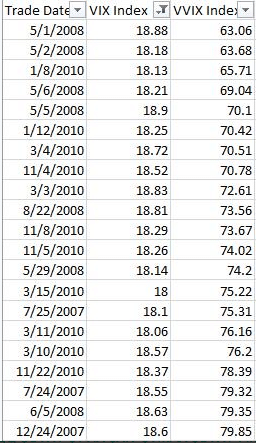
“Another way we review how the market is pricing risk is directly through the VIX and VIX options market. Back in late December and into the first trading days of January, the Volatility of Volatility (VVIX) index was basically showing risk or fear/hedging was absent market participation as VVIX dropped just below 80 and hovers just above 80 presently. A more normal VVIX reading that expresses the typical call buying/hedging activity is around 85-95. Additionally, we generally don’t see the VIX at 18-20- with a VVIX level of roughly 80-85. As it is or was with the SKEW Index, the market is simply attempting to normalize from a rather volatile and unique liquidity event that occurred in December of 2018 and as such we see the disconnect in risk pricing. Below is a table identifying how unique the VIX-VVIX pricing is or has been since December 2018. (Table provided by Matt Thompson, CFA)
As noted above, the VIX-VVIX ratio showed a mispricing of risk or risk displacement premium in the market, so to speak. With yesterday’s extreme VIX call option buying, VVIX rocketed higher and brought the VIX-VVIX ratio back to normal levels. Some might refer to the normalization as mean reverting.
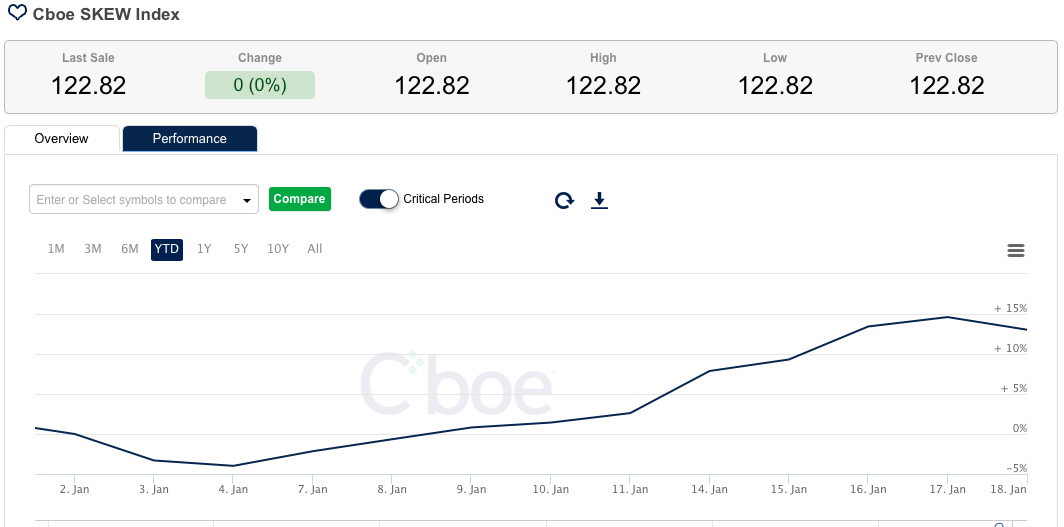
With Tuesday’s sizable uptick in volatility/VIX/VVIX, we feel more confident about how the market is pricing risk near term and given near term event risk such as Brexit, the U.S. government shutdown and U.S./China trade deadline. We can also suggest that beyond the VIX-VVIX ratio normalizing, the SKEW Index dropping from 130s to 122 on Tuesday finds market participants hedged more appropriately, but without indicating a black swan-type of event.
As we continue through earnings season, by and large the results are coming in better than expected, but that may not prove “good enough” if the macro-fundamentals aren’t found improving near term. Fear has driven markets since Q4 2018 and remains attached to the hip of the market. But that may prove a great contrarian indicator for equity market performance in 2019 says Ed Yardeni.
Edward Yardeni, who spent decades on Wall Street running investment strategy for firms such as Prudential and Deutsche Bank, predicts stocks will break out to all-time highs this year. He’s partly building his bull case based on a chart pointing to negative market sentiment.
“At the end of last year the bull-bear ratio, which is something we watch from Investors Intelligence, fell below one. It’s got an awfully good track record as a contrary indicator.”
Each time the index last year spiked to either record or near record highs, Yardeni found the S&P 500 Index entered correction territory. It appears an opposite trend is unfolding right now.

“Bearishness was just so widespread that the market had a technical bounce, and now the fundamentals are going the right way,” added Yardeni.”
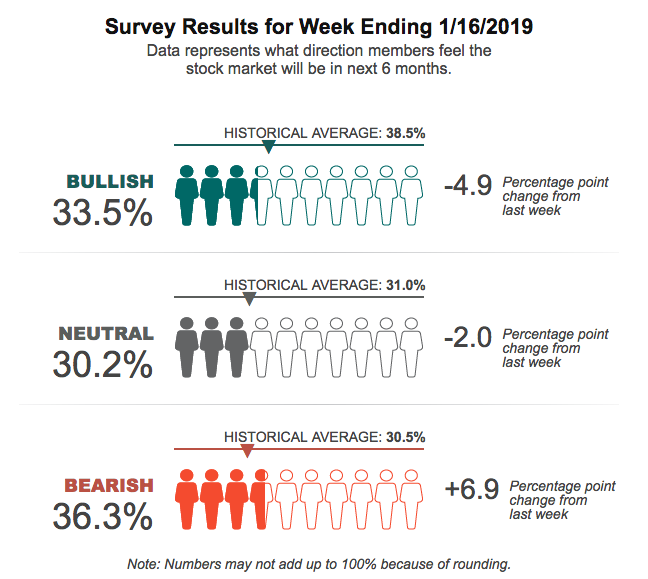
Finom Group has often suggested that market sentiment indicators can often be used as contrarian indicators and with strong efficacy. Throughout December, the American Association of Individual Investor survey was below it’s historic bullish sentiment average of 38 percent. Since the December low reading for the survey, the market has climbed nearly 12% and before Tuesday’s pullback. The current reading of the AAII survey suggests, as a contrarian indicator, that sentiment for the market remains unfavorable.
We’ll have to wait and see how long the survey bear’s out its contrarian nature along the lines of Yardeni’s sentiment for such indicators.


