
You’ve likely heard a great deal about the most crowded trade in the market, FAANG. With that you’ve probably also heard how as FAANG goes the market goes. These comments have turned into colloquialisms seeing how heavily weighted within many ETFs the FAANG stocks have become in recent years… and rightfully so! Rightfully so and because of the outstanding performance and growth from the individual FAANG stocks. Alphabet (GOOGL) reminded investors as to why so many ETFs are heavily weighted toward FAANG stocks. So let’s briefly take a look at Alphabet’s Q2 2018 results that were reported after the closing bell yesterday.
- Alphabet reported $3.2 billion in net income for the quarter, which works out to $4.54 a share, down from $5.01 a share a year ago, when the company also dealt with a big antitrust fine from the EU. Without the fine, Alphabet would have reported earnings of $11.75 a share and much higher than analysts’ average estimate of $9.64 a share, according to FactSet.
- Alphabet reported revenue of $26.24 billion after accounting for traffic-acquisition costs, up from $20.91 billion in the second quarter of 2017 and higher than the average analyst estimate of $25.58 billion.
- Reported revenue of $32.51 billion, but disclosed $6.4 billion in traffic-acquisition costs, or TAC, which is the portion of revenue that goes to other sites for sending eyeballs to Google ads. Combined, the Google division of Alphabet had $26.11 billion in revenue after accounting for TAC, against average analyst expectations of $25.48 billion, according to FactSet.
- Reported ad revenue of $22.39 billion minus TAC, up from $17.58 billion the year before; analysts on average expected ad revenue of $20.99 billion ex-TAC.
- Non-ad businesses within Google — which includes its cloud-computing platform, hardware such as Google Home speakers and Pixel smartphones, and mobile-app revenue from its Play Store — reported revenue of $4.43 billion, up from $3.09 billion a year ago. Analysts on average expected those businesses to provide $4.4 billion in sales, according to FactSet
- Alphabet’s “Other Bets,” the more experimental businesses that are apart from Google within the company’s corporate structure, reported $145 million in revenue, down from $248 million a year ago, and an operating loss of $732 million.
Below are just a few notes and statements from some sell-side analysts regarding Alphabet’s most recently reported results.
“GBH Insights analyst Daniel Ives wrote in a note to clients late Monday that TAC costs were lower than expected and is a “clear positive takeaway from the quarter.”
“First and foremost, Google Sites revenue has continued to grow, it’s the fourth quarter in a row of accelerating growth rates,” said JMP Securities analyst Ron Josey. “The company’s continued ability to reinvent or launch new ad products that have been adopted by advertisers, and that drives return on investment.”
“Overall, it was a great quarter for Alphabet with broad beats across many different lines,” said Cramer and the AAP team. “This is the type of performance we had hoped to see from the company for multiple quarters now, and management proved that just beating the quarter wasn’t enough; they wanted to blow it out in the face of their European fine.”
It was truly another phenomenal performance in Q2 by the Google parent company, Alphabet. Once again, despite the many FAANG pundits and naysers, a FAANG stock displays why not only the company itself is a great investor in its own business, but why so many ETFs provide a passive investment opportunity in the company. Now, take a look at Alphabet’s revenue growth dating as far back as 2009. The revenue growth is unprecedented, historic and nothing short of evidencing the share price appreciation since the company IPOd.
Putting Google’s total Q2 revenue in context, courtesy of @JonErlichman:
- Q2 2018: $32.7 billion
- Q2 2017: $26.0 billion
- Q2 2016: $21.5 billion
- Q2 2015: $17.7 billion
- Q2 2014: $15.9 billion
- Q2 2013: $13.1 billion
- Q2 2012: $11.8 billion
- Q2 2011: $9.0 billion
- Q2 2010: $6.8 billion
- Q2 2009: $5.5 billion
There are 174 S&P 500 index companies scheduled to report earnings this week, according to FactSet analyst John Butters. Eleven of the 30 Dow Jones Industrial Average components are on the docket as well. So far, this earnings season has been a rather strong one. Of the S&P 500 companies that reported before this week, 87% beat earnings expectations and 77% beat revenue expectations.
Earnings reports are scheduled Tuesday from Verizon Communications Inc. (VZ), United Technologies Corp. (UTX), AT&T Inc. (T), 3M Co. (MMM), Harley-Davidson Inc. (HOG), Biogen Inc. (BIIB), Eli Lilly & Co. (LLY), Lockheed Martin Corp. (LMT), Texas Instruments Inc. (TXN), Kimberly-Clark Corp. (KMB) and JetBlue Airways Corp. (JBLU).
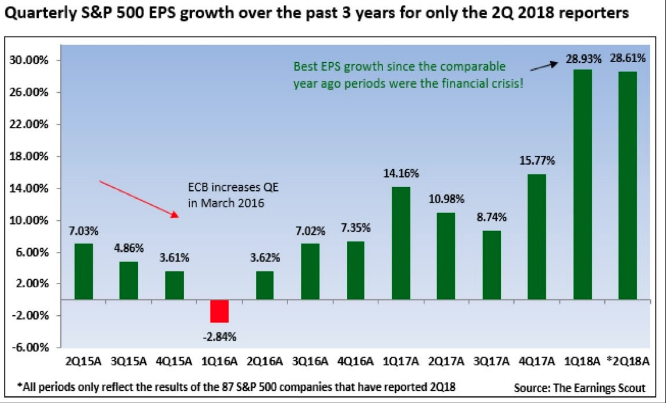
The first 87 earnings reports this quarter have an average EPS growth rate of 28.61 percent. That is only 0.32% below the growth rate of the first 87 earnings reports in Q1 2018 period as indicated in the table below.
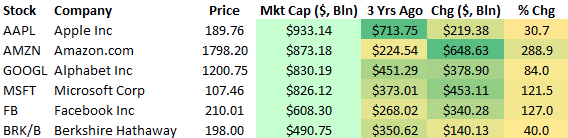
With a continuation of the expected growth from FAANG stocks kicking off the big-tech earning season, the race to a trillion dollar market cap is alive and well. Below is a look at some of the largest S&P 500 companies. It’s worth noting that recent gains have put four companies into the $800+ billion market cap club. Apple (AAPL) is still on top with a market cap of $933 billion, followed by Amazon (AMZN) at $873 billion, Alphabet (to be revised) at $830 billion, and Microsoft (MSFT) at $826 billion.
At present, the S&P 500 has broken out of a narrowing channel that has stubbornly persisted since the February 2018 correction.

One sector of the S&P 500 that has kept the index from accelerating to new all-time highs has been the financial sector. But since the sector has begun reporting better than expected results in the current reporting cycle, it has proven to lift the S&P 500 out of a long consolidation period. The financial sector’s performance has been a widely contested debate with bulls overweighting the sector since February and bears suggesting avoiding the underperforming sector under the premise of a flattening yield curve and lackluster loan growth. The bulls are seemingly winning the debate at present and according to reported results from the sector to date. The financial sector may get another boost in Tuesday’s trading session on the heels of TD Ameritrade’s outperforming quarterly results and a general positive lift in the overall market.
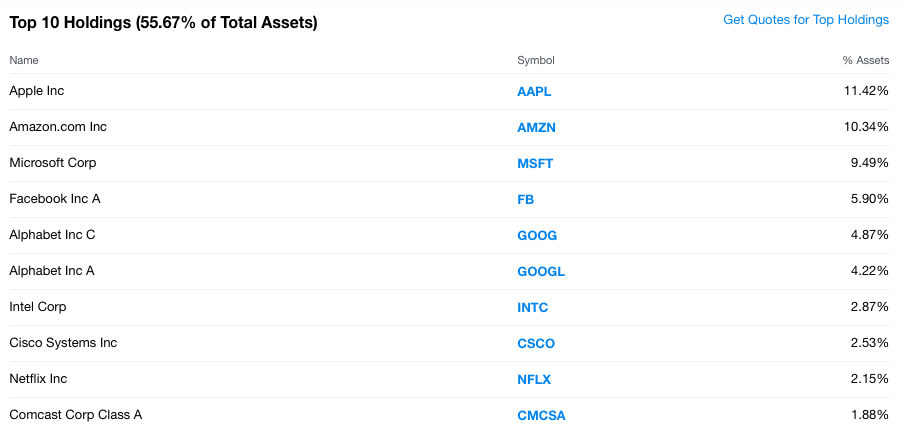
Equity markets overseas are keying off of strong earnings growth in the U.S. presently and with U.S. equity futures signaling a strong open on Wall Street. But here’s the thing; earnings season isn’t over and there’s more FAANG to come this week. Probably the most important stock to watch this week will not have been Alphabet, but rather Amazon. Take a look at the top 10 holdings within the Invesco QQQ Trust (QQQ) ETF.
Now take a look at the top 10 holdings in the Consumer Discretionary Select Sector SPDR ETF (XLY). And look at the weighting of Amazon within the ETF.
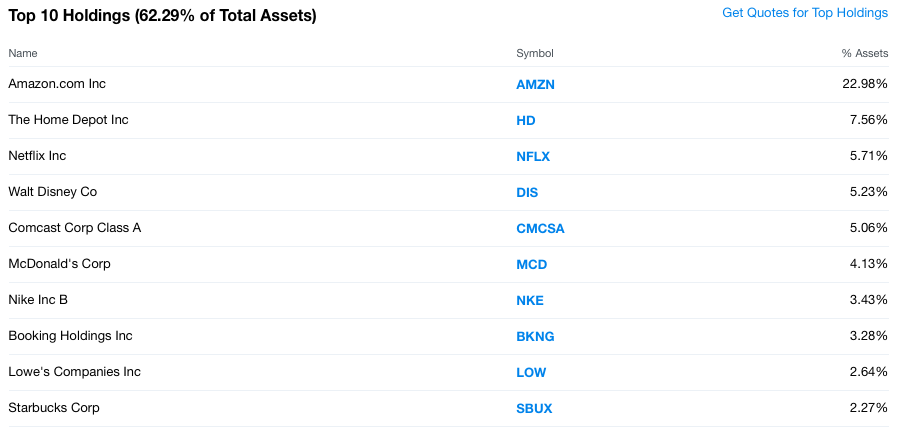
That’s a whole lot of dependency shouldered by Amazon is it not? While Alphabet’s Q2 2018 report may have suppressed some of the naysayers on the market, which consistently promote FAANG-reliant investing as foolhardy and dangerous, Amazon will go a long way toward silencing the naysayers. Of course, silence is only temporary.
Finom Group continues to trade what the market delivers regardless of the market’s overall direction. The recent market breakout, supported by strong earnings offers more trading confidence, but we still maintain a discerning eye focused on the geopolitical market headwinds. With that being said, our most recent trades proved profitable and in quick order as depicted below in our TGT and VXX trades.

At present, the market’s direction is favorable and allowing for investors to more confidently participate in the marketplace. But traders may not want to lose focus in such a volatile year that is littered with geopolitical and central bank driven concerns. In fact, 2018 may prove to be the most volatile year in the market since 2008. Take a look at the recent graph offered by Morgan Stanley.
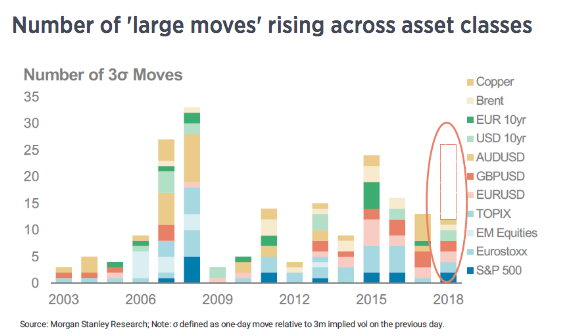
The firm charted multiple markets around the world, ranging from currencies such as the Australian dollar and the euro to commodities such as Brent crude oil and copper. And of course, the firm looked at U.S. stocks.
The large moves Morgan Stanley is tracking are so-called “3-sigma” events, which is a statistical way of calculating data that is within three standard deviations of a mean. 2018 is on track to have more than 25 such moves in financial markets, the most since 2008 when there were nearly 35, according to the firm.
Morgan Stanley believes tightening monetary policy and geopolitical risks” may be helping boost this year’s uptick in volatility.
And the remainder of the year is set to be even wilder because of the U.S. midterm elections, CFRA analysts said in a note Monday.
“Since [World War II] the S&P 500’s average daily price volatility was highest during midterm election years, in general, and third-quarters of [those years], in particular,” the note said.
Year-to-date volatility has averaged 15.7% according to the CBOE’s VIX. Finom Group assumes the average will remain within .50bps of this reading through year’s end. With respect to the current calm or complacency that has persisted in the market for several months, investors/traders need to remain vigilant as both midterm elections and tariff talks remain headwinds and maintain a higher volatility regime for the markets in 2018.


