
Welcome to another trading week!! In appreciation of all of our Basic Membership level participants and daily readers of finomgroup.com content, we offer the following excerpts from our Weekly Research Report. Our weekly Report is extremely detailed and has proven to help guide investors and traders during all types of market conditions with thoughtful insights and analysis, graphs, studies, and historical data/analogues. We encourage our readers to upgrade to our Contributor Membership level to receive our Weekly Research Report and State of the Market Videos and take advantage of this ongoing promotional event today! Have a great trading week, be in touch, and take a look at some of the materials in this weekend’s published Research Report!
Research Report Excerpts #1
Nonetheless, that 3,235 level remains a key resistance level going forward. We’ll see if the S&P 500 can muster enough strength to rise above it as we travel through earnings season. This may prove a tall task. The S&P 500 has clearly defined its ranges and may simply reconsider further consolidation.
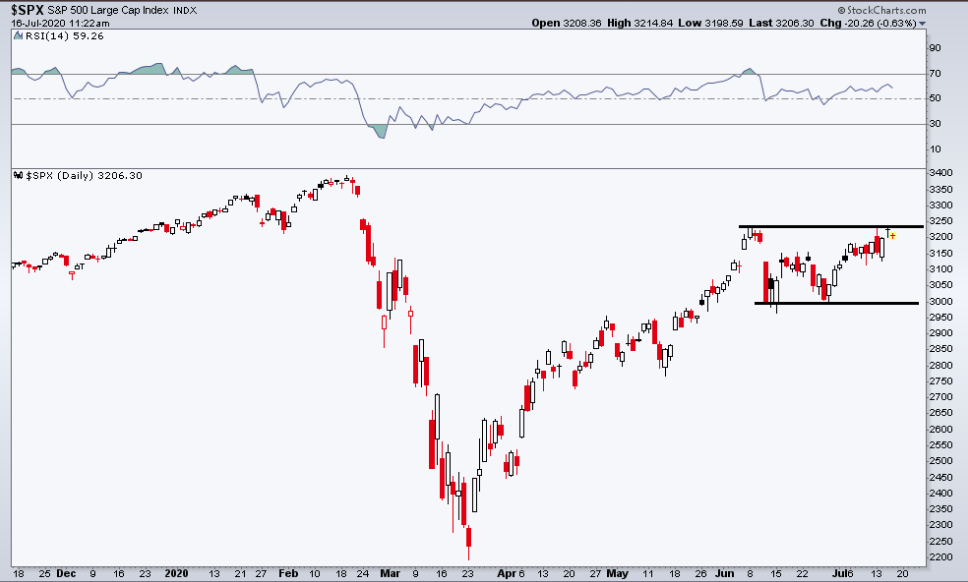
Above the most recent, new bull market high lay 3,250. From a round number perspective we think that breaking and closing above this level, and as the S&P 500 continues to consolidate above the 61.8 retracement level, would prove “uber bullish” and provide trend following flows to fill the upside gap to 3,328. (Gap zone can be seen in chart above, off to left side) While this may seem to be jumping ahead a bit, we’re simply looking at the technical probabilities, which are in no way a guarantee.
Research Report Excerpts #2
Moreover, when comparing the relative strength of the Nasdaq to the S&P 500, here is what noted technician Frank Capalleri offered on the subject matter and in referencing the following chart ratio performance:
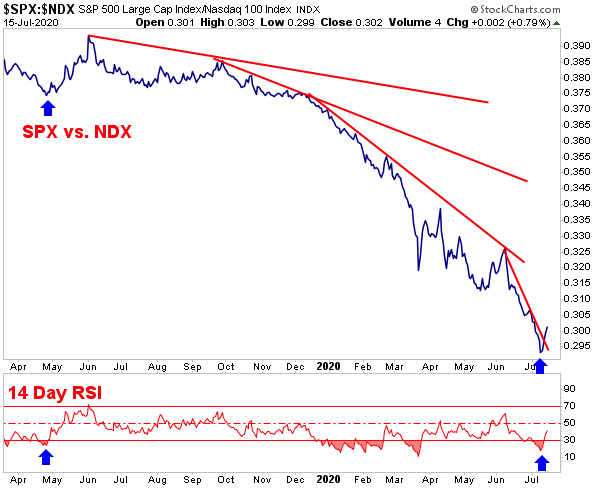
“It’s a ratio chart of the S&P 500 vs. the Nasdaq 100 over the past 15 months. There’s been a shift in index leadership recently, with the S&P 500 outperforming the Nasdaq for five consecutive days now. The S&P has gained 2.12% in that time, while the Nasdaq has slipped 0.94%. In the note, Frank explains, “The recent NDX underperformance vs. the SPX has become noticeable on the relative chart. While we’ve seen pockets of SPX strength vs. the NDX before, no effort has been strong enough to push momentum back to overbought levels in over a year. Will this time prove to be any different?” A more pronounced change in leadership wouldn’t necessarily be bearish for the broader market. If anything, this type of rotation could be viewed as healthy and bullish for stocks in the long-run. In the words of “The Godfather of Technical Analysis,” Ralph Acampora – “Rotation is the lifeblood of Bull Markets.”
Research Report Excerpts #3
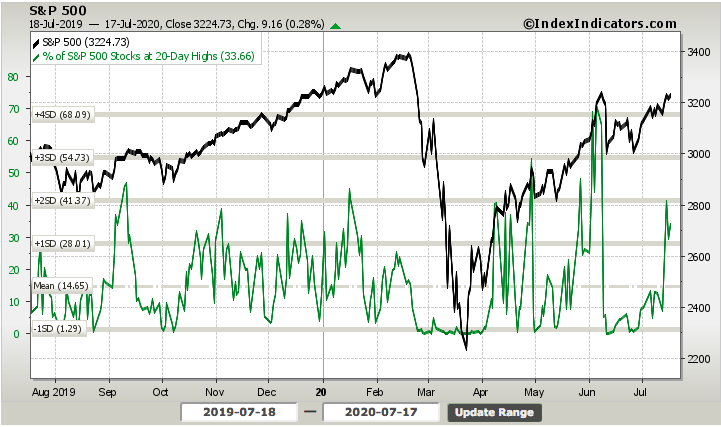
Another breadth indicator we desired to see improvement from this past week, and since it had remained relatively low over the last few weeks, was the percent of stocks trading at their 20-Day highs. This breadth indicator took a substantial leap this past trading week.
Research Report Excerpts #4
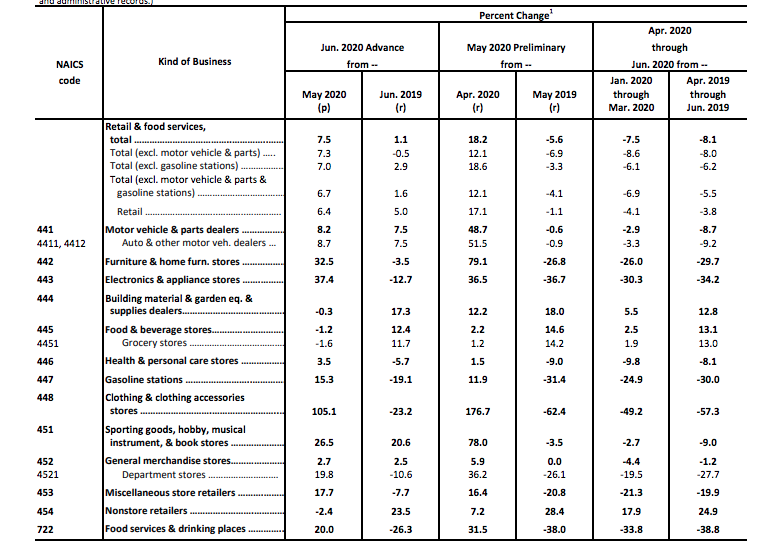
Sales at Internet retailers dipped 2.4% in June, though they are up nearly 24% from a year earlier. There’s been a surge in online shopping with so many people staying at home out of fear of catching the virus. By and large, stores with a strong online presence or technological advantage have outperformed less tech-savvy companies or those that rely heavily on store traffic.
Probably the most eye-popping line item in the June retail sales report came by way of the total YoY increase. As shown in the table below, YoY retail sales actually grew 1.1 percent.
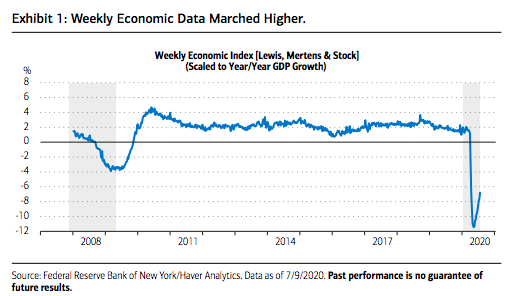
2020 will go down in history, and hopefully, as the only self-induced recession. In an environment where recessions last for months instead of quarters, economists are increasingly relying on higher-frequency indicators of activity to stay informed. The New York Fed’s Weekly Economic Index (WEI) was “initiated in early March 2020 in response to the need for tools to monitor the rapid evolution of economic conditions at the onset of the coronavirus pandemic.” Alongside a plethora of other U.S. economic data, the WEI improved for 10 straight weeks, covering the months of May and June, but progress in some of the underlying data has slowed more recently.
Research Report Excerpts #5
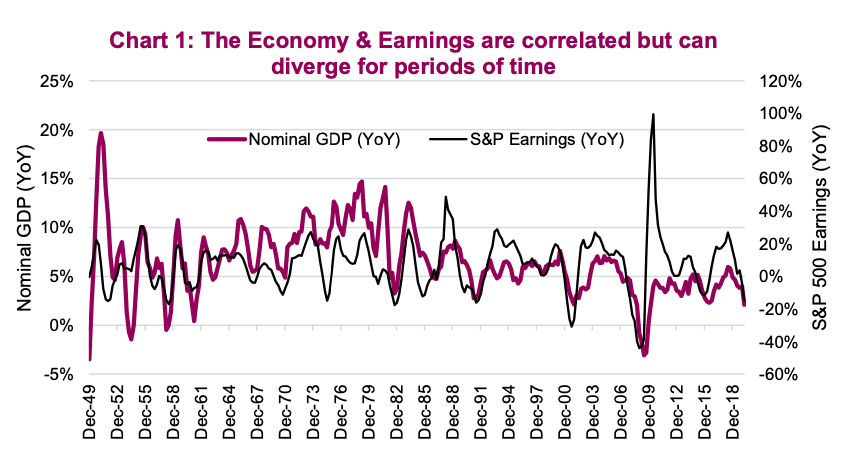
Over time, the economy and the stock market’s earnings have a strong positive relationship. Although it’s worth noting that S&P 500 corporate earnings swing with a greater magnitude than the economy as companies often use leverage in their capital structure and have greater reliance on corporate spending than the consumer. The price of the S&P 500 is further distorted by changes in what investors are willing to pay for earnings, i.e. the market multiple. Add all this up and there are periods when the economy and stock market diverge from their longer-term correlation (see chart below). This can persist for months, quarters and even years, but it doesn’t last forever. They catch up to each other over time.
Research Report Excerpts #6
Looking beyond the economic data is BofA’s Chief Investment Strategist Michael Hartnett who also identified the disconnect between macro and markets has never been greater. He went on to say, “But that is to be expected for the following three reasons:
- Markets rationally being “irrational”: government and corporate bonds have been fixed (“nationalized”) by central banks, so why would anyone expect markets to connect with macro, why should credit & stocks price rationally.
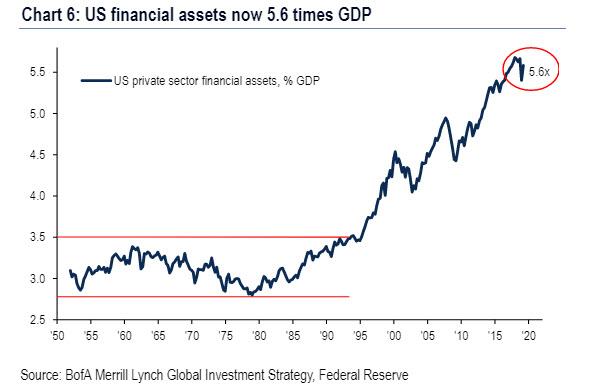
- Markets leading macro: policy makers (see China this week) know higher asset prices necessary condition for macro recovery (Wall St assets are 5.6x size of US GDP).
- Markets rationally pricing-in Max Liquidity, Minimal Growth backdrop, as they have done for 10 years.
Hartnett says he is still bullish risk assets over the next 2-3 months, targeting 2% on the 30Y Tsy, IG CDX sliding below 60 bps, and the S&P rising back over 3,250 while anticipating “choppy/higher summer price action.”
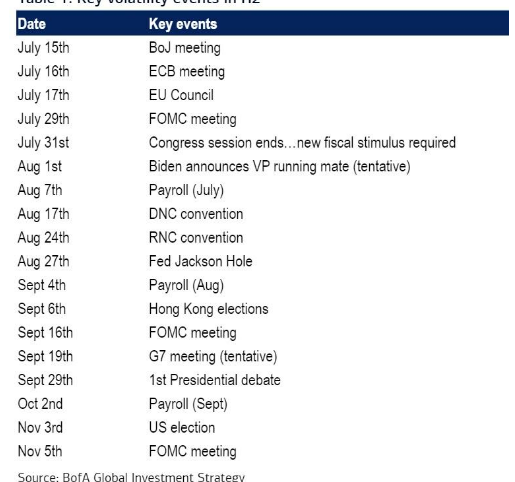
However, as when we near the end of the 3rd quarter, the BofA strategist warns that in September the “range breaks” and cautions that “the time period from August 27th (this year’s Jackson Hole symposium has been physically canceled but it will still take place by zoom one imagines) to Sept 29th (1st Presidential Debate) is packed with “volatility opportunities.” Among the key events as the summer ends are:
- Fed decision on Yield Curve Control (they do it…means “peak stimulus”, or they don’t…which still means “peak stimulus”);
- US-China tension to ratchet higher with HK elections, G7 meeting, US election;
- US election gets priced-in just as society gears up for clash between virus-lockdown and back-to-office, back-to-school momentum.
Research Report Excerpts #7
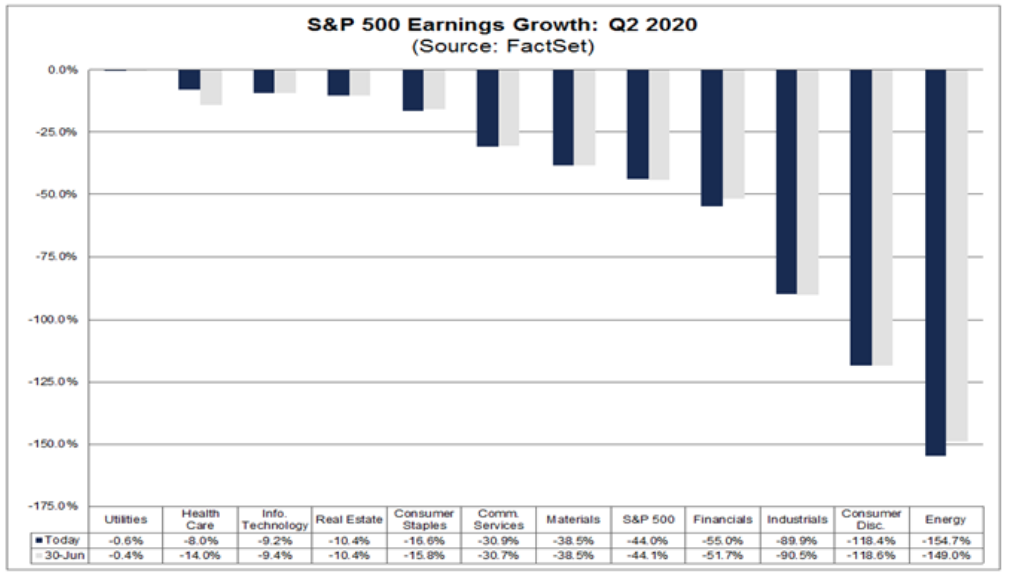
According to FactSet, 9% of the companies in the S&P 500 have reported actual results for Q2 2020. In terms of earnings, the percentage of companies reporting actual EPS above estimates (73%) is above the five-year average. In aggregate, companies are reporting earnings that are 6.3% above the estimates, which is also above the five-year average. In terms of sales, the percentage of companies (78%) reporting actual sales above estimates is above the five-year average. In aggregate, companies are reporting sales that are 3.5% above estimates, which is also above the five-year average. What we can gather from the early, earnings season reporting is that estimates were too pessimistic.
Research Report Excerpts #8
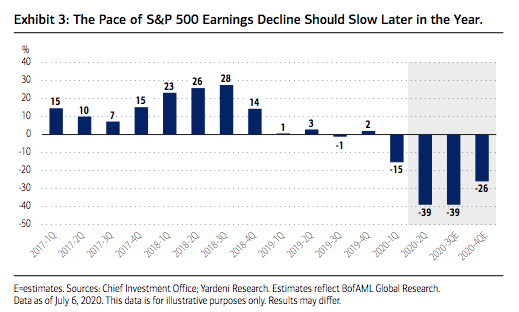
“Analysts also expect a 12% decline in sales. BofA Global Research is a bit more upbeat with better economic surprise data, a pickup in oil prices, a weaker USD, and encouraging results from early reporters guiding projections 8% higher than consensus. Earnings upside may help to support equities, which appear to be looking past earnings season for the most part, but investors will also be keen to watch forward guidance and other trends. Buybacks and dividends may also be of focus, as will corporate cash levels and capital expenditures. Margins in Technology will be watched to gauge the enduring primacy of the S&P’s sectorial workhorse. Finally, company commentary will be important but perhaps scarce, with almost 40% of companies having suspended guidance. We project earnings to improve as we move into the back half of the year and into 2021, but the path forward for earnings may still remain hazy.“
Research Report Excerpts #9
There is one glaring issue that one could focus on with regards to the difference between 2009 and the S&P 500 in 2020, as we refer to the analogous precision between the two time periods to-date: Risk vs. Reward. You see, back in 2009, the rally that would persist into 2010 didn’t consider new highs for the S&P 500. If the analogue is to play out like it did in 2009, however, today’s market would achieve new highs. We think that is where the risk/reward consideration comes into play and how one manages their capital in the back half of 2020. Here’s a table to help picture the risk/reward better:
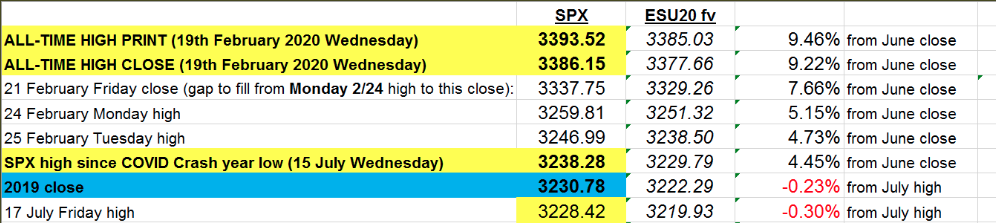
The S&P 500 is ~4% away from an all-time high, which is certainly within keeping for all the historical data we’ve seen surrounding 15%+ quarterly returns, breadth thrusts and more. How you allocate and manage your market exposure may be defined by history or the risk/reward potential near-term. Will you focus on the table of risk/reward above… or the table below of S&P 500 15%+ quarterly drops below, as we had in the Q1 period?
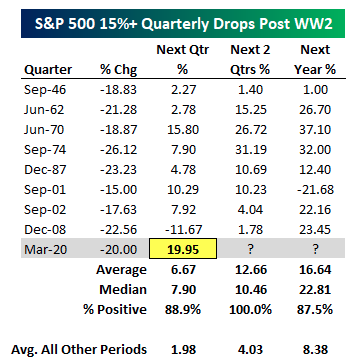
Based on the table above, we know Q1 was down 20% exactly.
- History suggests that after such a drop, the average gain the next quarter is 6.67%; this year the S&P 500 gained 19.95% in the following quarter after the 20% drop.
- Over the next 2 quarters after a 20% drop the S&P 500 has typically averaged a 12.66% gain. In 2020, it appears the market has already gained in one quarter what it averages over 2 quarters and after a 20% drop.
- In 2020, the S&P 500 is vastly out-performing history!
Thank you for joining us for another trading week and reviewing our weekly “Must Knows”! To receive and review our weekly, full-scale Research Report each Sunday and our State of the Markets weekly video analysis every Thursday, subscribe to our Contributor Membership level at just $7.99 monthly (Cancel any time)! With these two weekly deliveries, you’ll have all the unbiased and fact-driven market and economic data analysis at your fingertips. Don’t make capital allocation decisions based on headlines that brush the surface of what is and isn’t affecting markets. Let our deep-dive analytics supply you with bottom-up and top-down analytics. You won’t be disappointed. Upgrade today!!


