
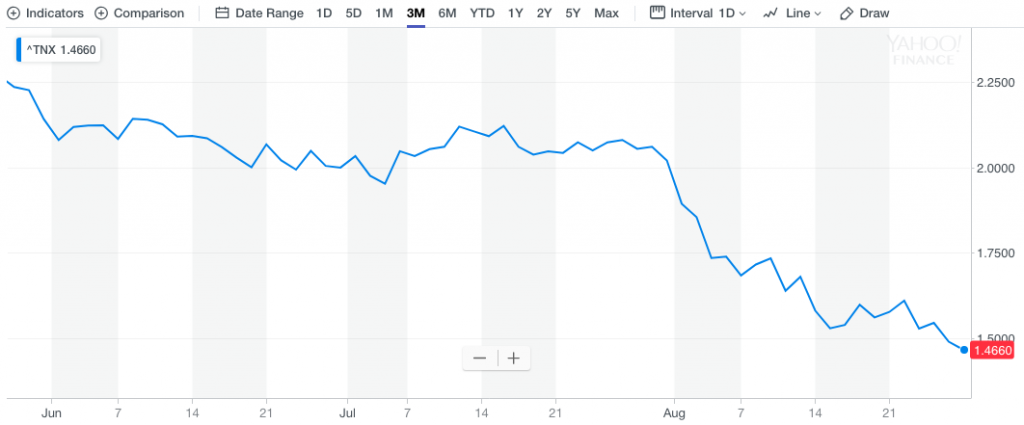
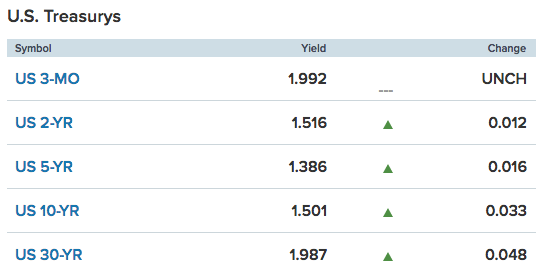
After a sharp drop for stocks at the opening of trade Wednesday, U.S. equities rally more sharply through the remainder of the trading day and took back all that it had lost from Tuesday and more. The S&P 500 (SPX) rose roughly 19 points or .65% on Wednesday as the onset of end-of-month rebalancing proved to offset fears concerning constant declining yields that have persisted throughout August. As we can see in the chart below, the 10-year yield has maintained a consistent and persistent decline since over the last 3 months, but that decline exacerbated at the onset of August.
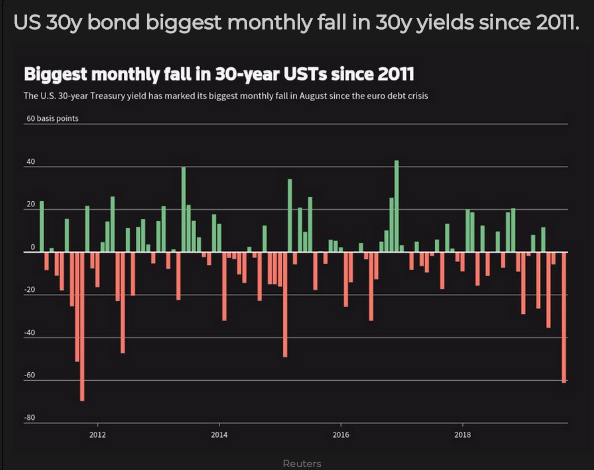
And if you think the drop in the 10-year yield is steep, check out the drop in the 30-year yield, which lends itself favorably to mortgage rates.
The decline in the 10-year yield has lent itself to the latest yield curve inversion, 2s and 10s, which is more unique to circumstance as usually the 2-year Treasury yield is found inverting with the 10-year Treasury yield after rising to create the inversion. For whatever reason, and there have been many proposed reasons for the yield curve inversion this go round, Ron Insana suggests, no, this time is not different.
“I am growing increasingly concerned about the consistent, and persistent, lack of concern about the inversion of the yield curve among professional economists, some decision-makers at the Federal Reserve and financial pundits. They claim that this inversion is different than those of prior vintage.”
“The last time the curve inverted, prior to the 2008 financial crisis, even the Fed explained it away by claiming that a “global savings glut” was pushing excess cash into U.S. Treasury bonds, driving down yields and offering an unreliable indicator of impending recession.“
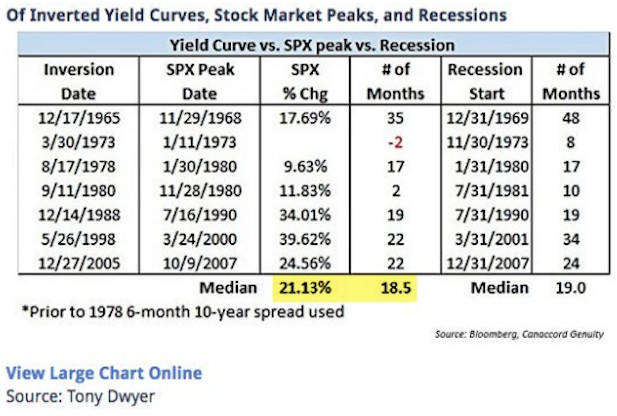
The last time the yield curve actually inverted was December of 2005; it took nearly 2 years for the S&P 500 to peak and before the recession officially began according to the NBER. In terms of an excused Personal Savings glut offered by the FOMC back then… I’m not so sure what Ron Insana was referring to as the Personal Savings rate was sideways to down in 2005?? (See chart below)
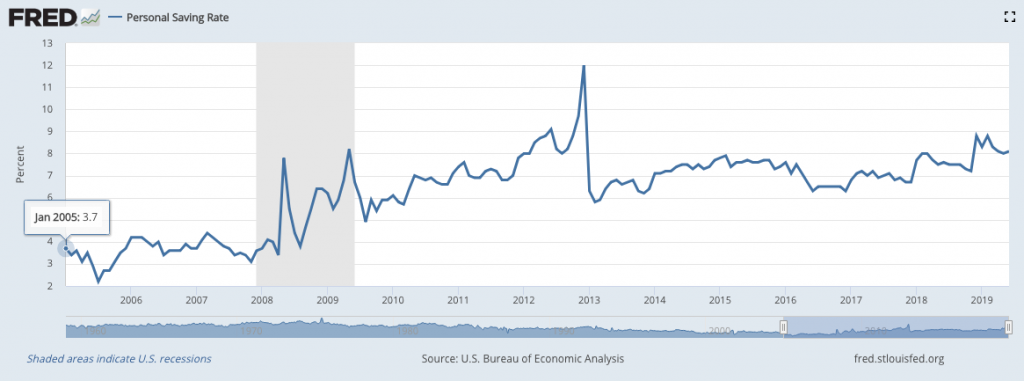
Moreover, since Insana’s tone of his OpEd is dismissive of the differences between the current inversion and economic cycle and the last cycle whereby the yield curve inverted… let’s continue to look at the difference between the Personal Savings Rate.
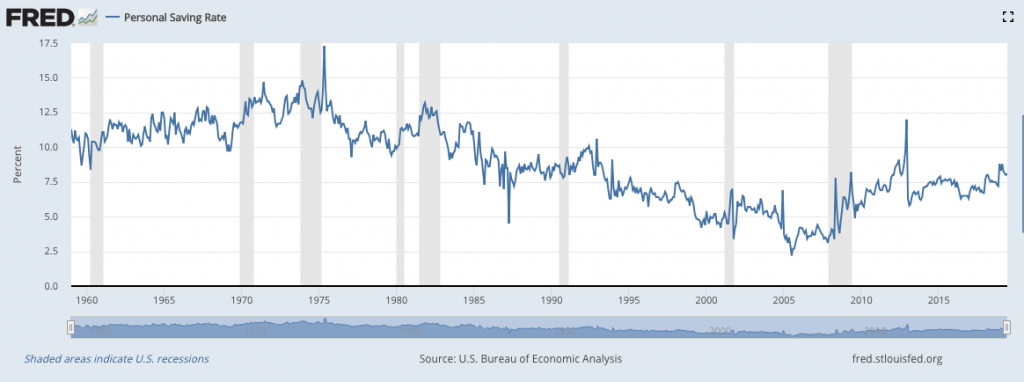
The current expansion cycle shows that the Personal Savings Rate has been on a steady uptrend since the Great Financial Crisis, peaking above 8% in 2019. In fact, it is the first time the Savings Rate has been up trending for an economic expansion since the 1960s. By the way, the Personal Savings Rate was less than 4% through 2005 and even lower going into the Great Financial Crisis.
Based on the statistical relevance of just the Personal Savings Rate, this time is indeed different, even if we consider the yield curve inversion doesn’t cause recessions, rather it is symptomatic of underlying economic issues. Speaking of bond yields, comments out of China overnight are serving to boost greater confidence amongst equity investors, finding a slight flight to risk and away from safe haven bonds going into Thursday’s trading session.
A spokesman for China’s commerce ministry was quoted as saying the country would not immediately respond to the latest tariffs imposed on them, which boosted U.S. stock futures and European stocks.
Ministry of Commerce spokesman Gao Feng was quoted by Bloomberg News as saying at a press conference that “the question that should be discussed now is about removing the new tariffs to prevent escalation.”
He also said that both sides were discussing the planned September meeting of U.S.-Chinese trade negotiators.
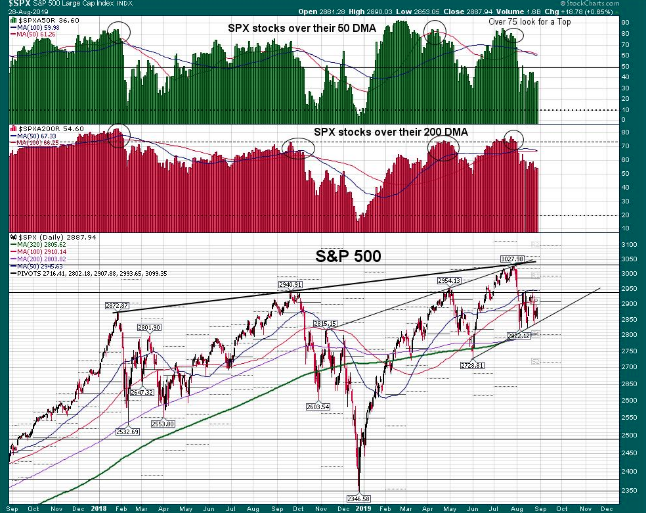
Coming into Thursday’s trading session and off of a decent Wednesday market rally, the reality is that the S&P 500 remains stuck in a trading range between 2,820 and 2,940. As shown in the charts below, stocks over their 50 and 200-DMA equate to 37% and 54% respectively, which is an improvement. Having said that, fewer and fewer stocks participating with the move up?
It’s important to understand that what is likely moving markets is end-of-month rebalancing that is forcing Pension funds into relatively inexpensive equities that carry a favorable risk/reward premium. As of last Friday’s close, the Goldman Sachs trading desk now estimates that rebalancing should result in a +$25bn of U.S. equities to buy (vs. +$15bn as of Thursday’s close). This is now a meaningful number ($20b is typically the “having market impact bogey”). For context in 1Q19 the avg. daily market $s spent on buybacks (biggest notional buyer in the marketplace) came out to ~$3.8bn. For 2Q19, the firm estimates it was ~$3.1bn average per day….and depending on up or down days the spend could vary by about +/- 5-10 percent.
The Morgan Stanley QDS Pension Rebalancing Model estimates that there will be $30 to $40bn inflows to Equities from pensions through the first week of September, and an estimated $40bn has likely hit the market already this month, for a total of $75bn inflows from the first week of August through the first week of September.
What’s more, JPMORGAN sticks by its call to buy stocks in September! “Our view is that Trump might not execute in the end on the latest tariff threat, given the increased concerns of a negative spillover onto the U.S. consumer .. and stocks are likely to have a better footing into year end.”
With the various firms recognizing this favorable end-of-month rebalancing taking shape, it’s also important to recognize trends. The end-of-month and 401K Distribution is generally a positive event for the markets and good time to follow the money and then get out. The 100-DMA is often used as a signal. In the S&P 500 chart below we can see that the 100-DMA is now at 2,910, which holds a probability to be breached on Thursday, but many investors will be looking for a close above this level to confirm the weekly uptrend and begin weighing the probabilities of breaking out above the 50-DMA near-term.
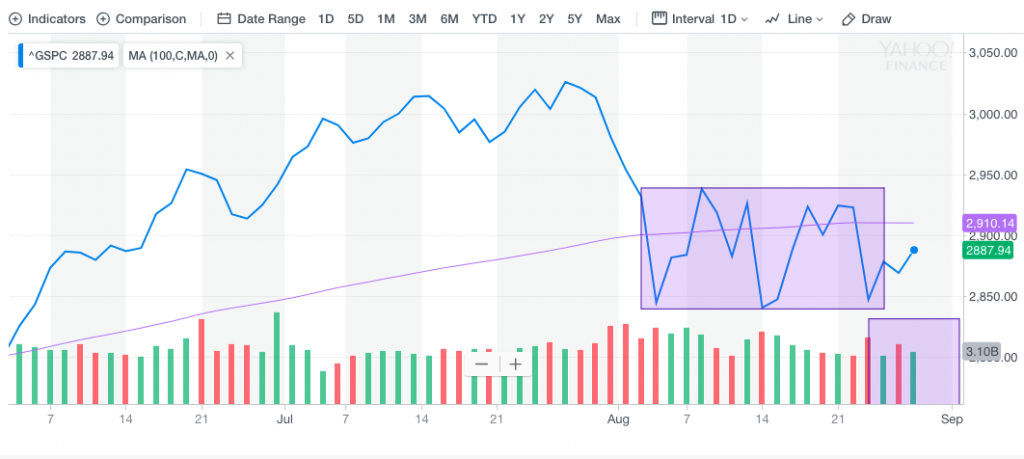
As an active trader, one should also be considering the weekly expected move as potential resistance for the S&P 500. The benchmark index is up roughly $40/points heading into Thursday while the weekly expected move is roughly $71/points. If the S&P 500 moves another $31/points to the upside, it will achieve the weekly expected move whereby we would anticipate some sellers stepping into the market, at least temporarily. This is not to say a breach of the weekly expected move can’t take place, as it often does and has in 4 of the last 5 trading weeks.
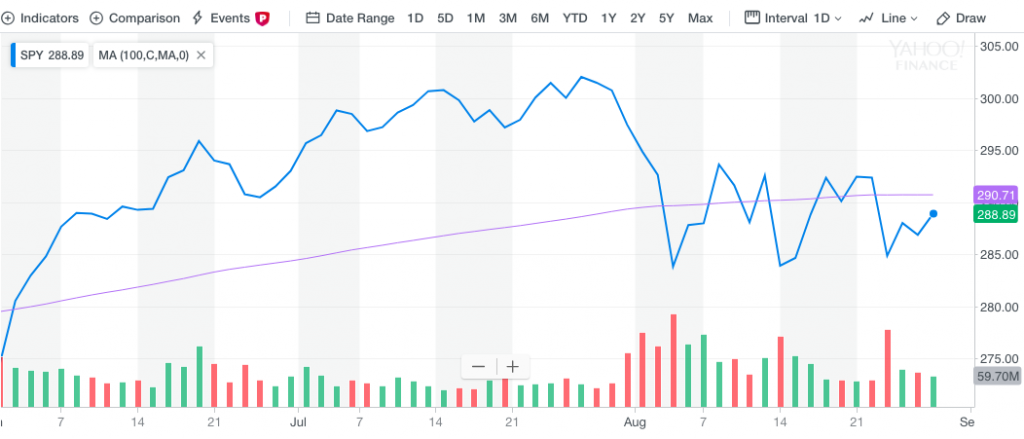
In speaking of the 100-DMA, the S&P 500 Spyders ETF is set to open well above its moving average based on the pre-market bid/ask spread. The current 100-DMA is at $290.71 while the bid is $291.60 and ask is $291.65. This is all subject to change, but being eyed by many a trader.
In keeping with the positive tone in the markets this week, even with yields lower week-to-date, investors are seemingly appreciating the fact that stocks are now yielding more than the 30-year Treasury. We’ve discussed the equity risk premium in the Finom Group weekly Research Reports more recently, which is very high of late.
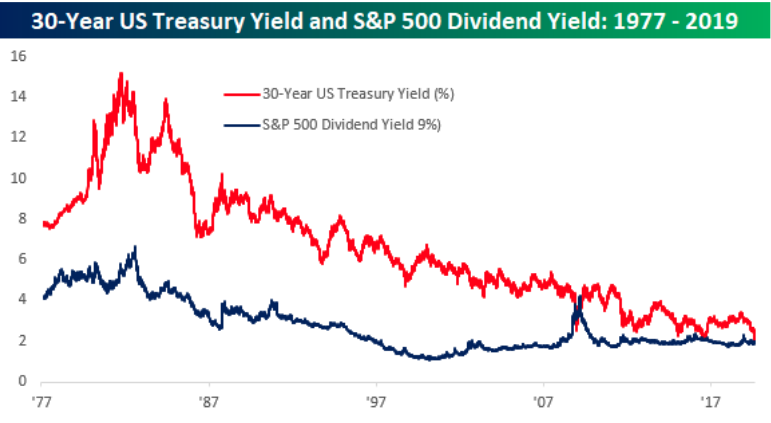
For the first time since the financial crisis, stocks are earning more for investors than key long-term Treasury bonds. The U.S. 30-year yield dropped below the S&P 500′s dividend yield on Tuesday. It’s the first time since March of 2009 that has happened, according to data from Bespoke Investment Group.
“The outlook is much better for stocks than it is for long-term Treasurys right now,” Bespoke co-founder Paul Hickey told CNBC in a phone interview Tuesday.“For an investor looking to hold something for the long term, it makes equities relatively attractive.
The takeaway is, if you can get an annual yield from a company that’s going to pay you more than the 30-year Treasury and the company has a history of raising its dividend, for the long term, it’s a better alternative than a Treasury.”
Individual stocks now yield more than 5-, 10-, and 30-year US Treasury bonds, according to Bespoke’s research. As of Tuesday morning, two-thirds of the stocks in the S&P 500 yield more than the 5-year. More than 60% yield more than the 10-year, and roughly half are yielding more than the 30-year note.
JJ Kinahan, chief market strategist at TD Ameritrade, said this might help support stocks — at least in the near-term.
“Those hungry for yield will continue to buy more ‘safe’ stocks,” Kinahan said. “By this, I particularly mean those stocks in the S&P 500 that offer an attractive dividend but perhaps have less perceived downside risk in a sell off.”
While the major averages are looking to break out of a 4-week downtrend this week, volatility is also looking to settle lower than the previous week. Seasonality favors a lower level of implied volatility (VIX) in September than what we had seen in August.
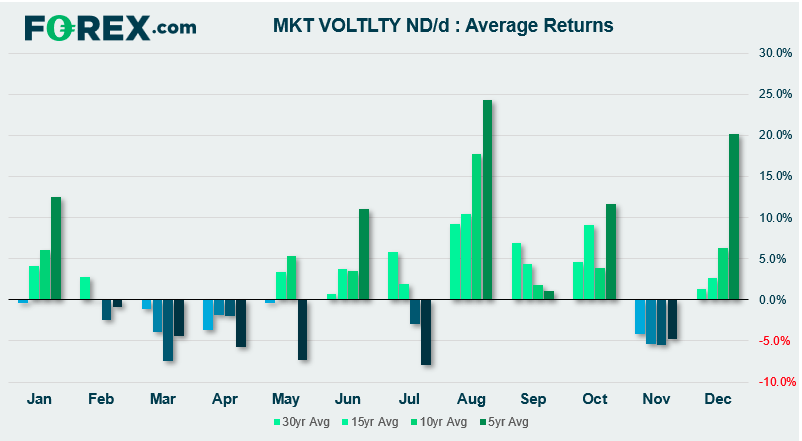
Taking the past 30 years of data, we can see that the VIX is typically higher during the month of August. Moreover, the average has increased if we measure over the past 5, 10 and 15 years. Whilst each August will have its own tale to tell, it can be partly rationalized to a lower liquidity environment that can leave markets (such as the S&P500) more vulnerable to large moves from perhaps smaller headlines. Looking forward, we can see that the level of VIX is typically lower during September, as traders return from vacations.
Despite many of the positives the markets are displaying and producing going into Thursday’s trading session, fear of equities still looms large. The latest AAII survey found bullish sentiment nearly unchanged on a WoW basis, but still well below the historical average.
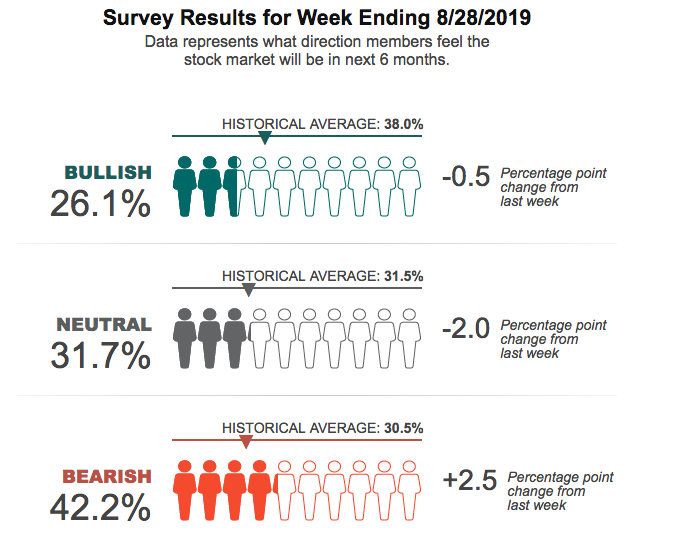
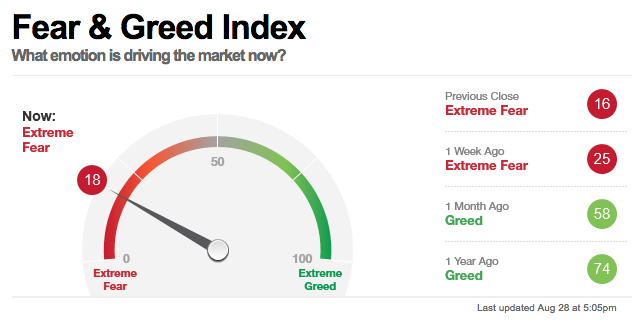
Bearish market sentiment also rose last week and remains well above the historical average. And despite the bullish moves in the market this week that has found stronger than expected economic data, the CNN Fear & Greed index remains at extremely fearful levels. And yes, these typically are used as contrarian indicators by traders.
In speaking of economic data, the calendar was empty for Wednesday but picks up once again on Thursday with several economic data reports. The most widely watched reports are likely to be the Pending Home sales, Initial Jobless Claims and Q2 GDP revision data sets. After printing 2.1% GDP growth upon first look, GDP is expected to be revised lower for the Q2 2019 period when it is released today.
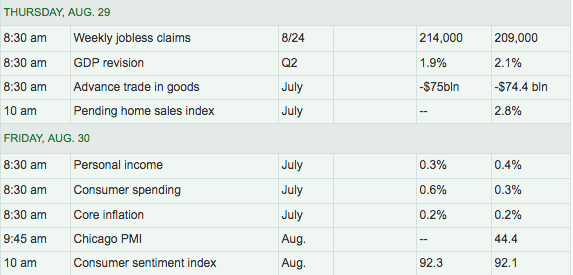
Weekly jobless claims are expected to tick higher after a sharp drop in the previous weekly report while investors and economists alike are eyeing an upside surprise in Pending home sales after strong Existing and New home sales data last week. Mortgage application data has remained robust in 2019 as lower rates have produced a refinancing boom of sorts. If you want an example of just how pervasive negative sentiment is on Wall Street and amongst the financial news networks, take a look at the following headline concerning the latest, weekly Mortgage application data released Wednesday.
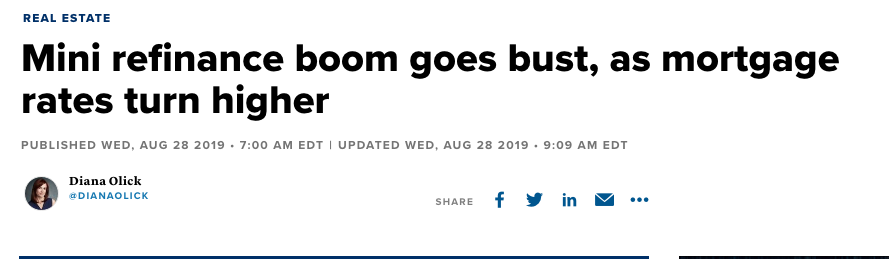
Now take a look at what was actually reported by the Mortgage Bankers Association:
- Total mortgage application volume down 6.2% last week, compared with the previous week.
- Volume was 66% higher annually, as rates were still higher last year.
- Refinance volume was 167% higher than a year ago, proving how volatile the weekly moves are despite rates being lower.
- Consumer confidence in the housing market is still high, according to a monthly Fannie Mae survey, but there is a shortage of homes for sale on the low end of the market, where demand is strongest.
- Mortgage applications to purchase a home, which are less sensitive to rate changes, fell 4% last week and were just 2% higher than a year ago.
That’s some bust huh? But positive headlines rarely get clicks and viewers and that’s largely why the media, when able, paints a more negative headline than what the data actually offers and/or outlines factually. It’s always a good idea to read, beneath the headlines. They could prove to be very, very misleading.
Our final thought on the markets remains one of optimism, but with a healthy dose of caution, as nobody knows for sure how the market will react to some of the event risks ahead. Remember, the markets will be closed on Monday for the Labor Day weekend. There are 3 event risk identified over the extended weekend.
- China’s Aug NBS PMIs (Sat night 8/31)
- The 9/1 tariff tranche (Sun 9/1)
- The German state elections in Bradenburg and Saxony (Sun 9/1).
Regardless of the weekend event risks, CNBC’s Jim Cramer says traders should be prepared for a September boon in the market.
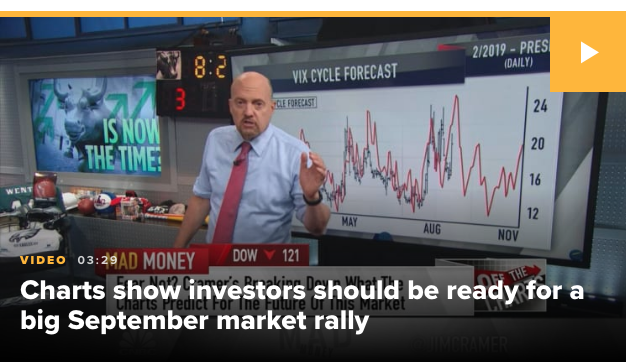
Based on analysis from Larry Williams, the renowned stock trader credited for creating a number of market barometers including the aptly named Williams %R momentum indicator, investors should expect the stock market to cycle through a hot streak in September, a steep fall in October and another upswing at the end of that month.
“The charts, as interpreted by the legendary Larry Williams, suggest that it’s time to stop panicking, stop complaining and start buying,” the “Mad Money” host said. “He thinks the cycle of fear and negativity has run its course. So if the averages haven’t bottomed already, they’re going to bottom very soon.”


