
The trading day was going swimmingly and seemingly without any headlines of significance until around 1:00 p.m. EST on Wall Street. It was around this time that Tesla’s CEO, Elon Musk, tweeted out the possibility of taking the company private at $420 per share or at a $72bn market cap. The tweet also outlined that Musk had secured this financing for the operation.
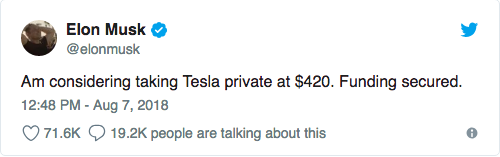
Tesla stock went shot up as much as 8% before Nasdaq eventually halted trading in Tesla shares for almost an hour and a half until the company finally posted his email to employees on the Tesla blog. When the shares resumed trading, they eventually rose even higher, closing with an 11% gain.
The major averages finished higher across the board yesterday with the Dow leading and closing the day higher by .50 percent. The S&P 500 logged a .28% gain, edging closer to its record all-time high level set earlier this year.
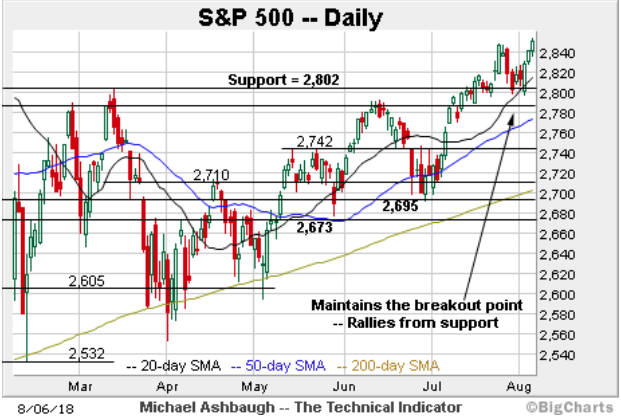
As illustrated, the S&P has extended its rally from the breakout point (2,802) reaching six-month highs. The July peak (2,848) pivots to near-term support. Counting from the Feb. 8 correction low, the stock market’s recovery time was five and one-half months. According to CFRA strategist Sam Stovall, this is only slightly longer than the five-month average recovery time of all corrections since World War II.
At this point and with the strong rally in the market over the last 2 months, how much further can the rally run before it hits resistance? We don’t think anybody can foretell the future, but CFRA strategist Sam Stovall says that the market often, though not always, continues higher after overcoming a correction.
“Encouragingly history says, but does not guarantee, that the S&P 500 could advance another 10% beyond the prior high before slipping into another decline of 5% or more.”
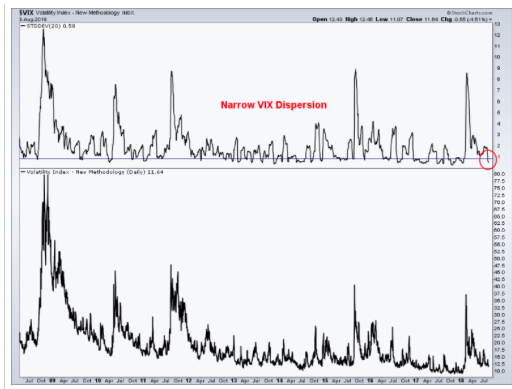
The longstanding rally in the S&P 500 since the February correction will likely find the index achieving record highs near term and barring any significant geopolitical developments of consequence. Alongside the S&P 500 rally we’ve seen volatility reined in significantly since the VIX topped 50 back in February. In technical terms and analysis, the VIX has been crushed lately and is now below its 2 standard deviation Bollinger Band as shown in the chart below.
With other sentiment indicators, when this occurs it usually can signal a short-term bottom in the VIX and a near term top for the S&P 500. Given the shift in volatility from 2017 to 2018, trading strategies may need to adjust accordingly and in order to extrapolate greater profits from the market as outlined recently by Rainer Michael Preiss, executive director at Taurus Wealth Advisors. Preiss pointed to how the environment is changing: volatility is picking up, and interest rates are rising and central banks are tightening. He goes on to suggest that market volatility has been stoked by U.S.-China trade tensions, and the two major stock indexes in China have already lost one-quarter of their value from highs earlier this year.
“At the same time, a period of abnormally low market volatility appears to be coming to an end.”

Preiss’ bottom line to investors is to have a more hands-on approach with active portfolio management. This affords investors the opportunity to take advantage of volatile price swings in the market that are likely to persist going forward.
Finom Group has long since agreed with Preiss’ notions on active portfolio management. Additionally the period of low volatility has transitioned YOY to a period of elevated volatility based on the median VIX reading. With the VIX breaking below 11 yesterday, signaling low-level volatility presently residing in the market, the short-VOL trade has been vindicated from the February “Volpocalypse” and with certain of the VIX-Exchange Traded Products like TVIX and UVXY finding new all-time low trading prices. But from this point, active management in the volatility trade may very well be the difference between profitable volatility trading and market beating returns.
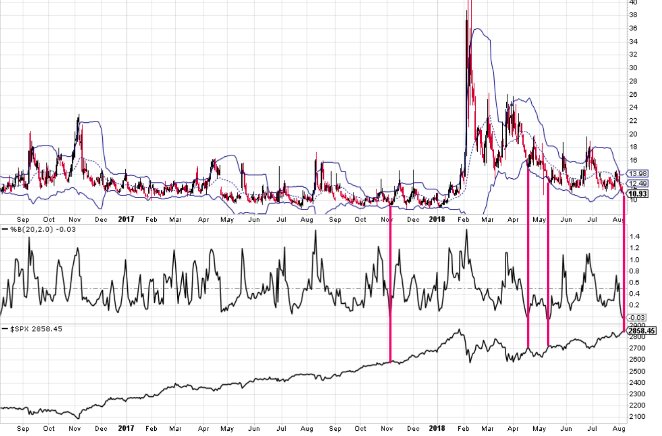
There are a lot of signals out there in the market that may indicate a near-term bottom for the VIX. Technicals are just one of those signals indicating a near-term bottom. Dispersion is also an indicator of a potential bottoming in the VIX as recently outlined by A.J. Thrasher in his report titled The Volatility Clouds Have Begun To Darken.
“Below is a daily chart of the VIX and the 20-day standard deviation with a blue line at 0.86 (the level I discuss and explain within my paper.) As you can see, std dev often declines substantially before nearly every major spike in volatility. This acts as a much better forecast of volatility spikes than other more popular techniques (again, something I cover in my paper).
It’s important to note, that volatility spikes do not follow many declines in dispersion. This is why many signals in the market are required to surmise volatility outcomes. Finom Group believes too many signals are currently pointing to a near-term VIX bottom and potential spike. To what degree a spike occurs is anybody’s guess, but ahead of a potential spike we think it advantageous to raise cash. By raising cash at low-level VIX readings, one can avoid drawdowns from the short-VOL trade and redeploy capital when volatility spikes… again. For this reason, we alerted finomgroup.com subscribers of our recent curtailed short-VOL positioning.
To be clear, Finom Group is not calling a bottom in the VIX, but rather prudently planning for the inevitability of a near-term spike in the VIX. Again, to what extent the VIX spikes from current levels is anybody’s guess. Additionally, the rationale or reasons behind a future spike will guide how and/or when we redeploy cash back into the short-VOL trade. For now, we’ll sit back and let both the market and VIX do what it’s going to do. As stated previously in this market dispatch, it’s highly probable that the S&P 500 will achieve a new all-time high before any significant retracement. The VIX should maintain its current trajectory and find a near-term bottom before portfolio managers initiate protection in volume, using S&P 500 (.SPX) put options. We’ll see what today’s trade brings forth for investors, as all eyes remain focused on the S&P 500.


