
Welcome to another trading week. In appreciation for all of our Basic Membership level participants and daily readers of finomgroup.com content, we offer the following excerpts from within our weekly Research Report. Our weekly Research Report is extremely detailed and has proven to help guide investors and traders during all types of market conditions with thoughtful insights and analysis, graphs, studies, and historical data. We encourage our readers to upgrade to our Contributor Membership level ($14.99/monthly, cancel anytime) to receive our weekly Research Report and State of the Market videos. Have a great trading week and take a look at some of the materials from within this week’s Research Report…
Research Report Excerpt #1
While many have given in and given up on the markets over the last several quarters, the S&P 500 has bounced from its 200-weekly moving average in October 2022 and has remain above its 200-WMA for 29 straight weeks.
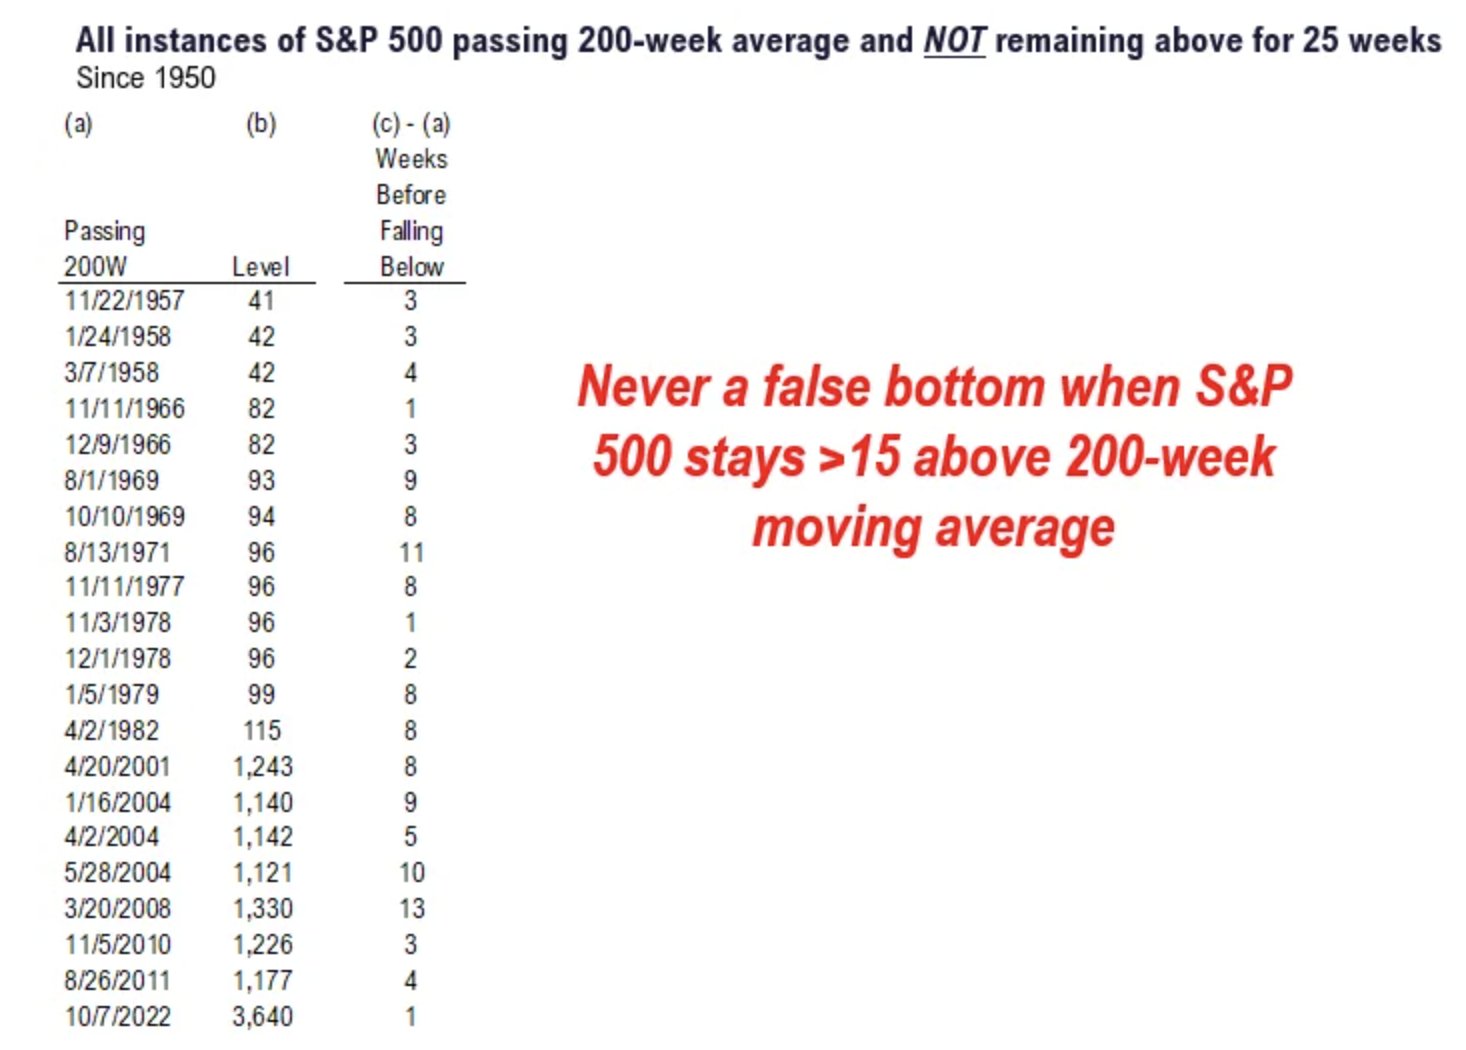
Such bullish feats of technical strength have ALWAYS been a signal of a New or ongoing bull market. Anything less than 13-straight weeks and the S&P 500 has eventually fallen back below its 200-WMA, also signaled during ongoing bear markets/bear market rallies; this is not the current state of market affairs!
Research Report Excerpt #2
The Skew Index is suggesting there are negative consequences ahead for the market, likely associated with the debt ceiling debate. The good news is that Skew is not suggesting it will produce similar outcomes to 2022.
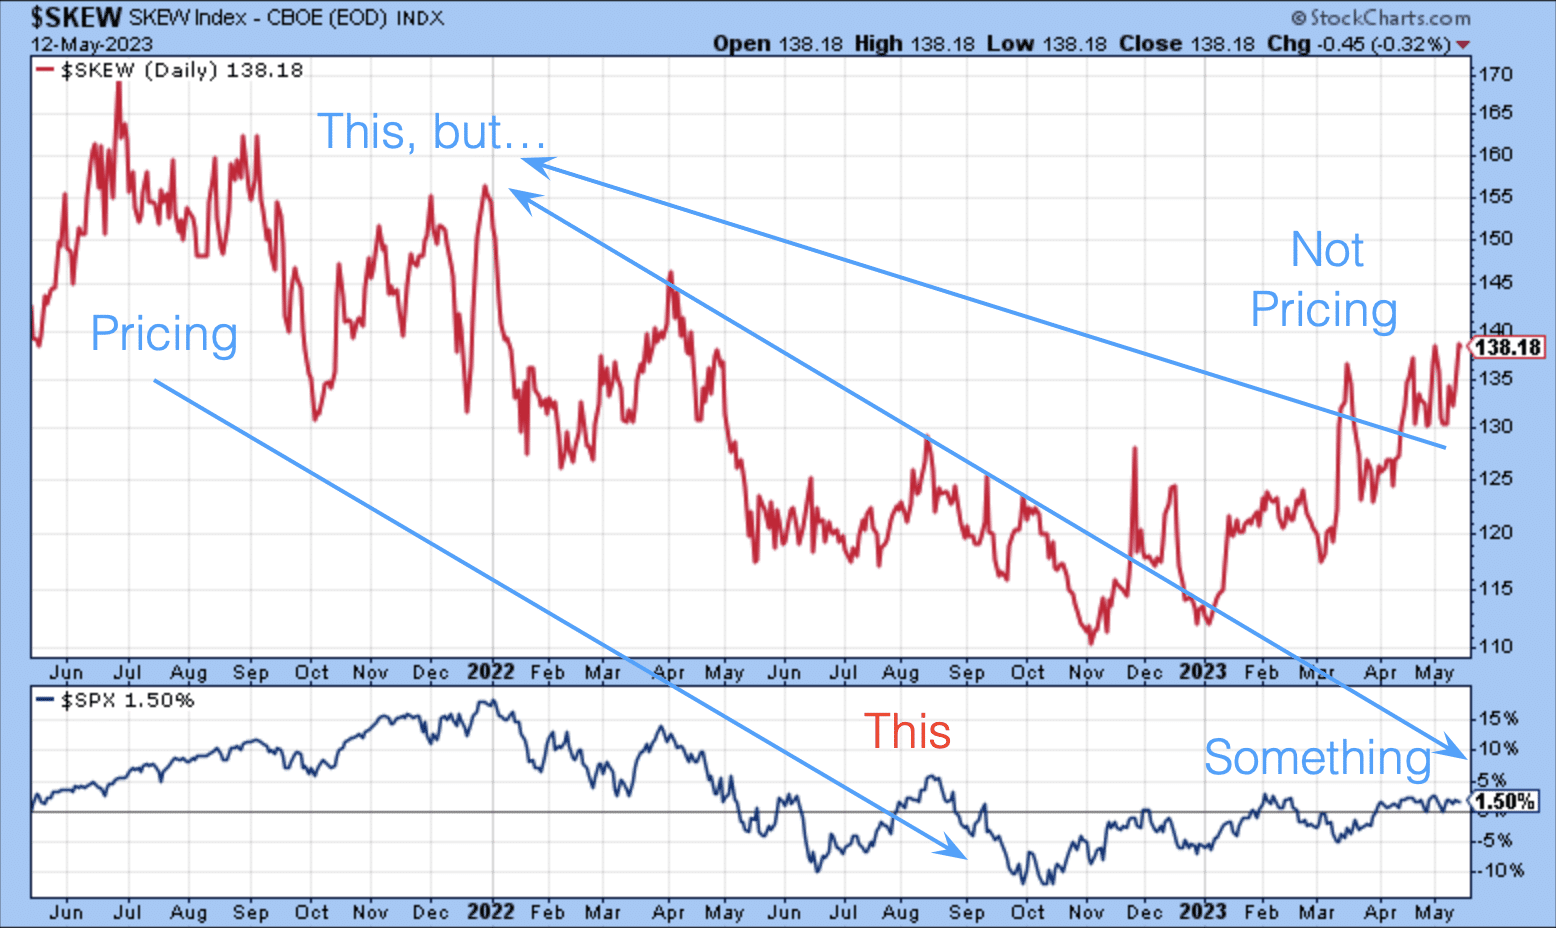
If we look at the left side of the Skew Index, 2+ year chart above, we can see that it accurately forecasted bad outcomes for stocks in 2022. If we look at the rising trend since the onset of 2023, we can see that Skew is pricing a negative near-term risk event, but not something as bad as 2022’s bear market.
Research Report Excerpt #3
This past week, jobless claims spiked even higher, and the media was back to its usual formatting and outlining recession fears. What we learned, however, through carefully researching the abnormality of the weekly spike in initial jobless claims vs. estimates was that there was an outsized number of fraudulent claims in the state of Massachusetts.
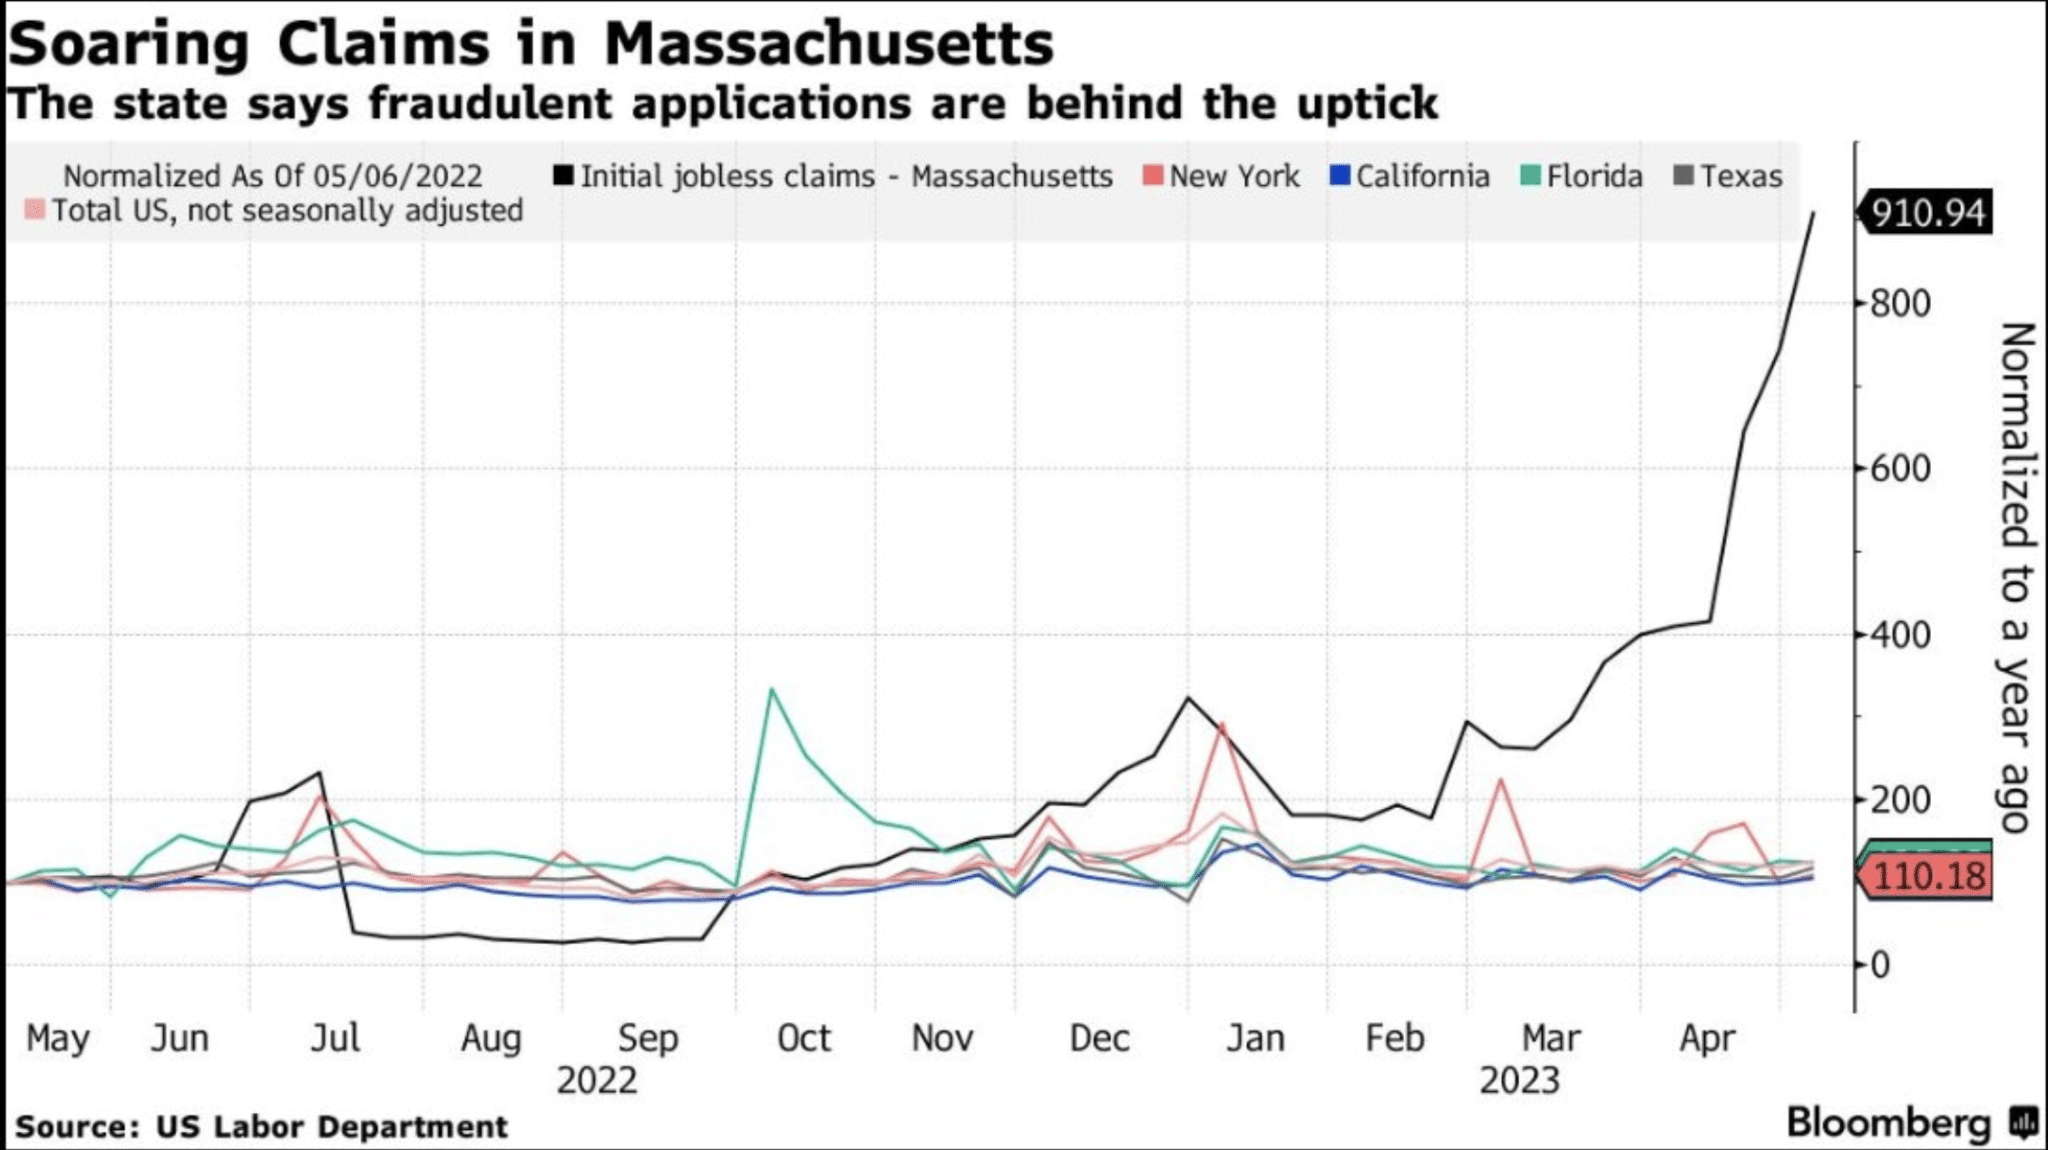
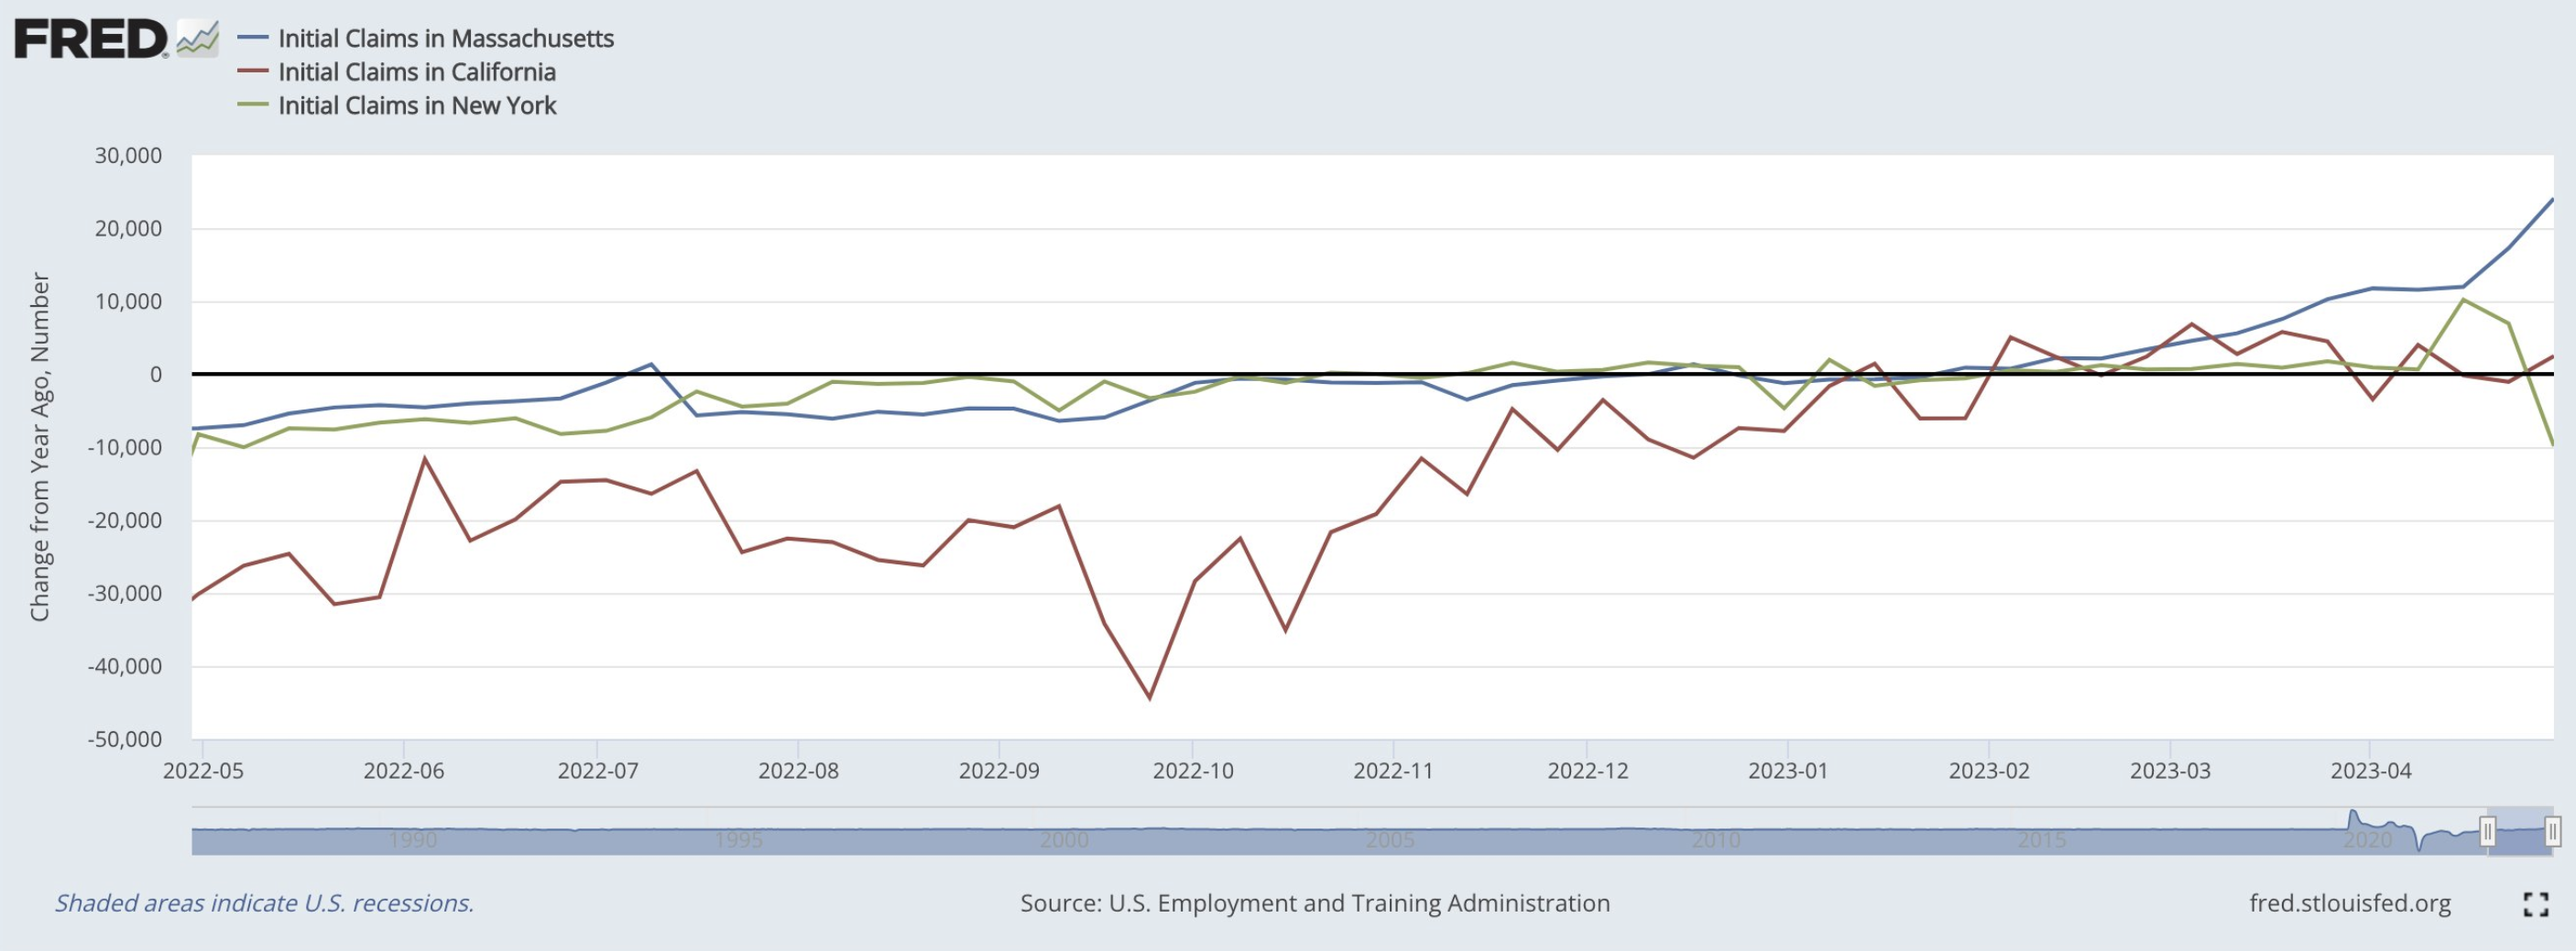
Over the 8 weeks ending in April 29, initial jobless claims have increased 34,000. Claims in Massachusetts have surged 24,846 over this period.
Research Report Excerpt #4
Ailments don’t always result in the death of an economic cycle.
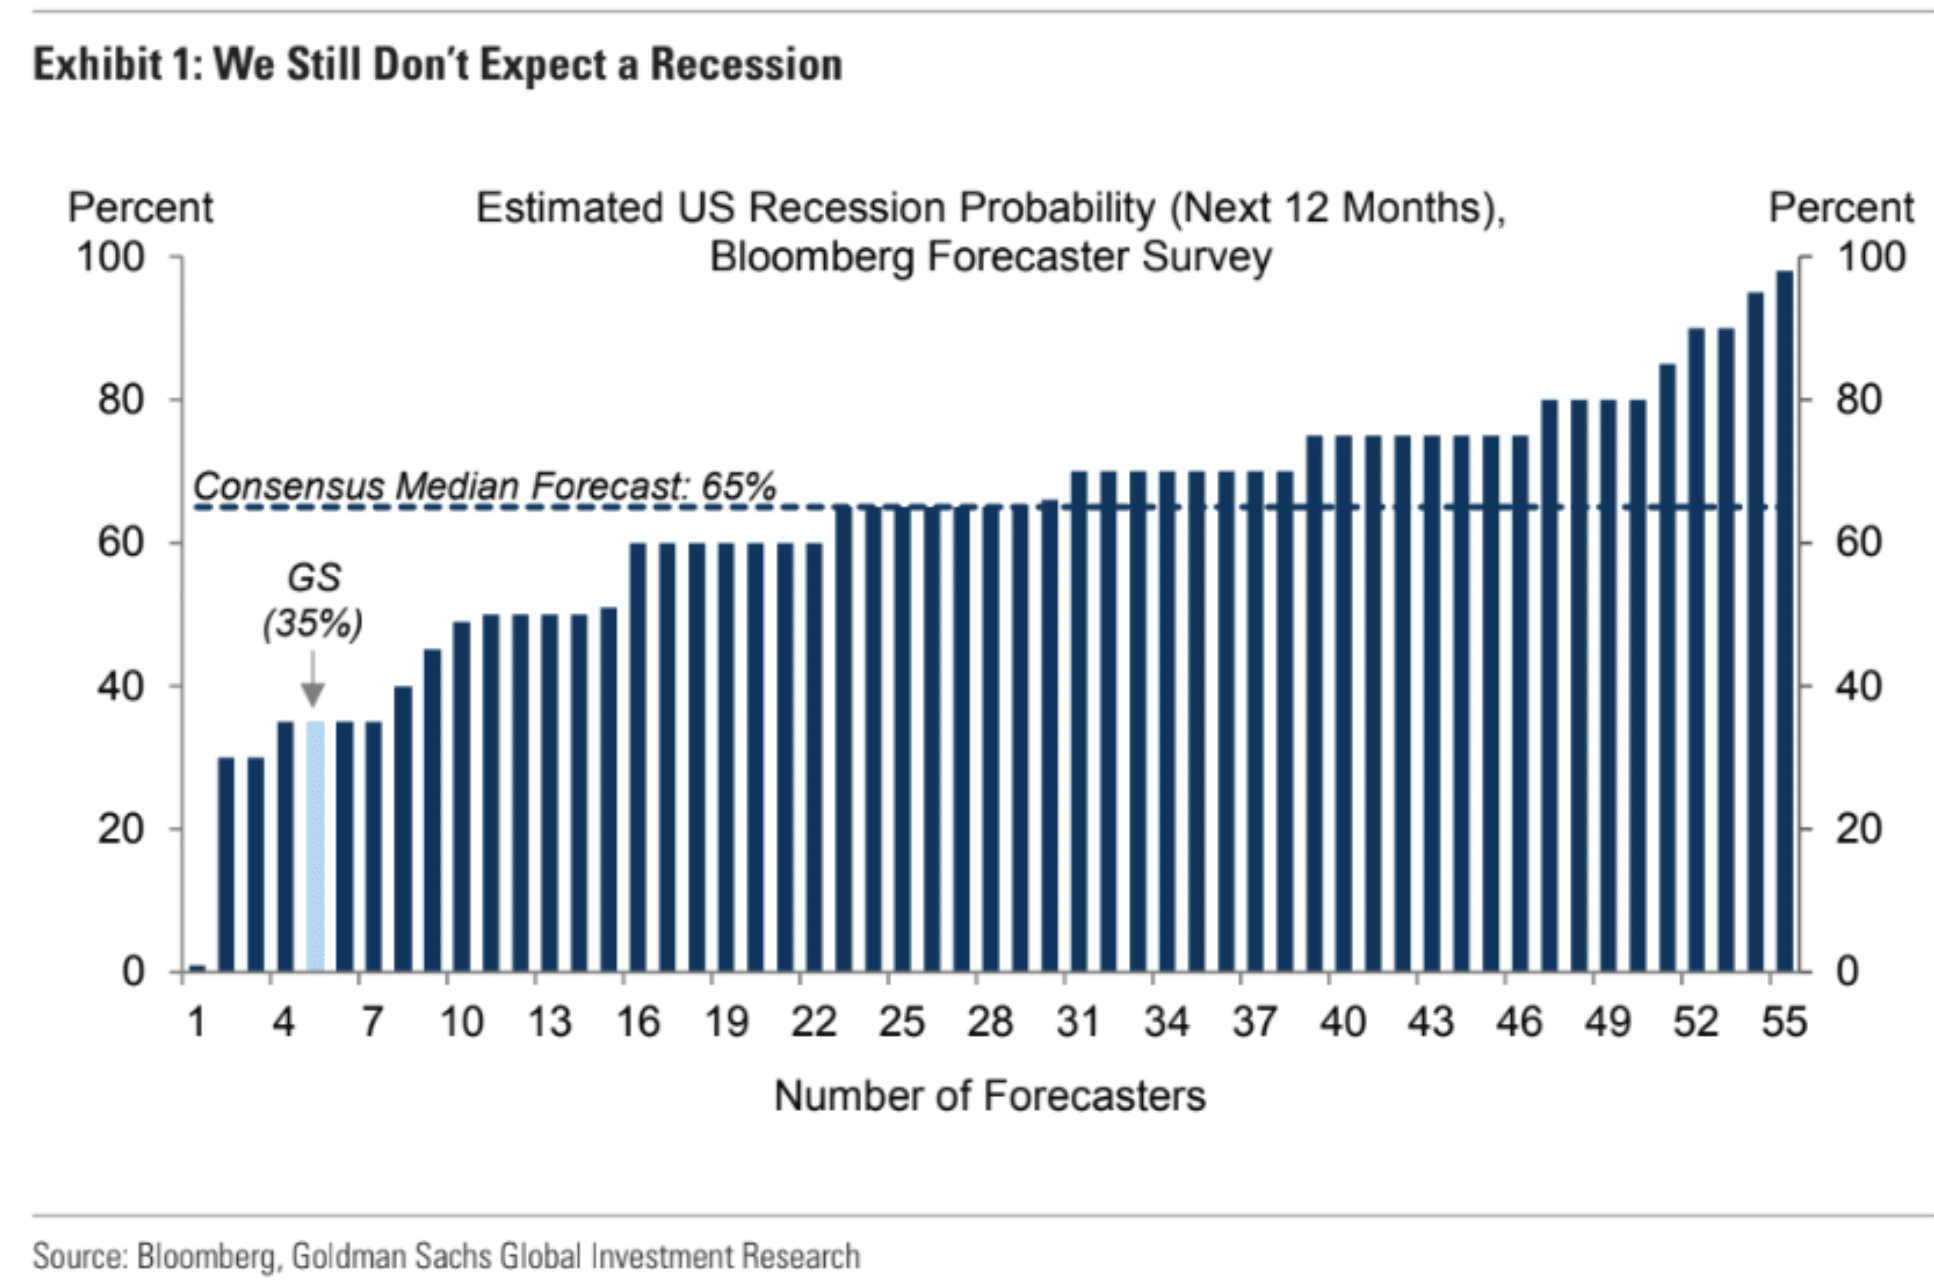
As one of the few Wall Street firms maintaining an outlook for a soft landing or no recession in 2023, Goldman Sachs offers the chart above, which still outlines the consensus median forecast of 65% probability of a recession. This is not to suggest Goldman Sachs or Finom Group, who shares a similar 2023 economic outlook, will be proven accurate in their outlooks for a resilient economy through 2023, but rather outlines where the crowd has found consensus.
Research Report Excerpt #5
Last, but certainly not least, we recognize that even though the S&P 500 finished slightly lower for the week, the Net New Highs continued to outpace Net New Lows.
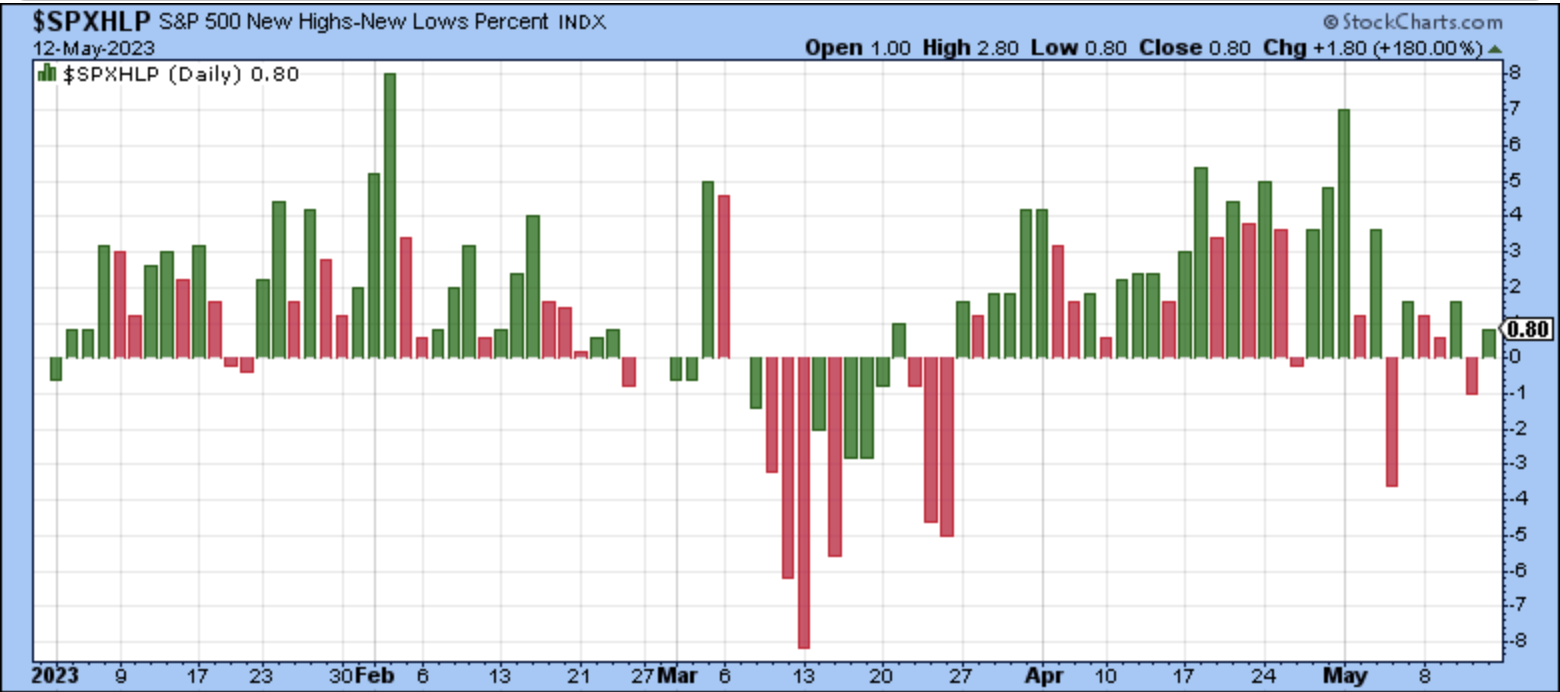
It’s clear from the Nasdaq, Nasdaq 100, and S&P 500’s year-to-date leadership that Growth, Large and MegaCap names are driving the indices performances.
Research Report Excerpt #6
What matters most to markets is the trend of inflation, whether or not it is rising or falling, not whether rates are rising or falling.
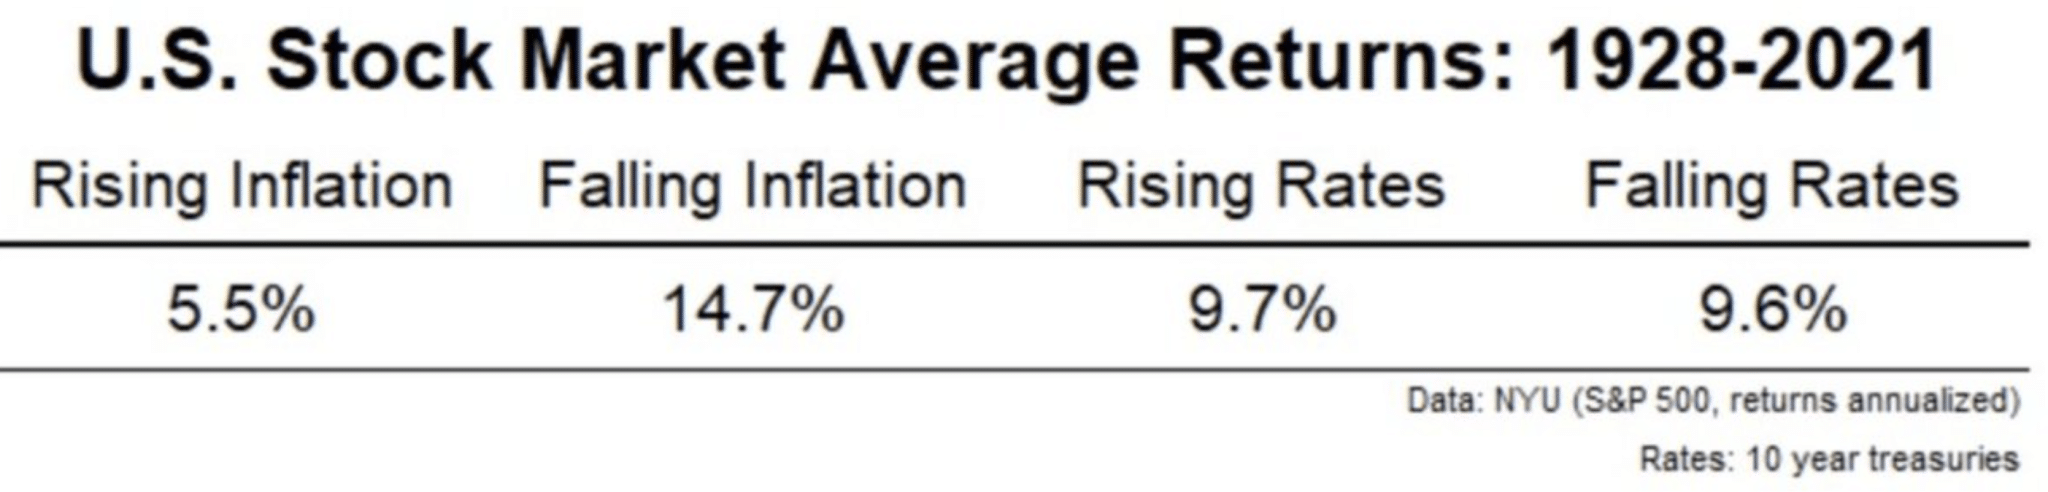
Looking at history, more closely, what we can see is that the disinflationary process proves a boon for investors.
Research Report Excerpt #7
The updated chart of the Technology sector ETF doesn’t look much different than last week, as the breakout failed to achieve follow through, and XLK finished slightly down on the week.
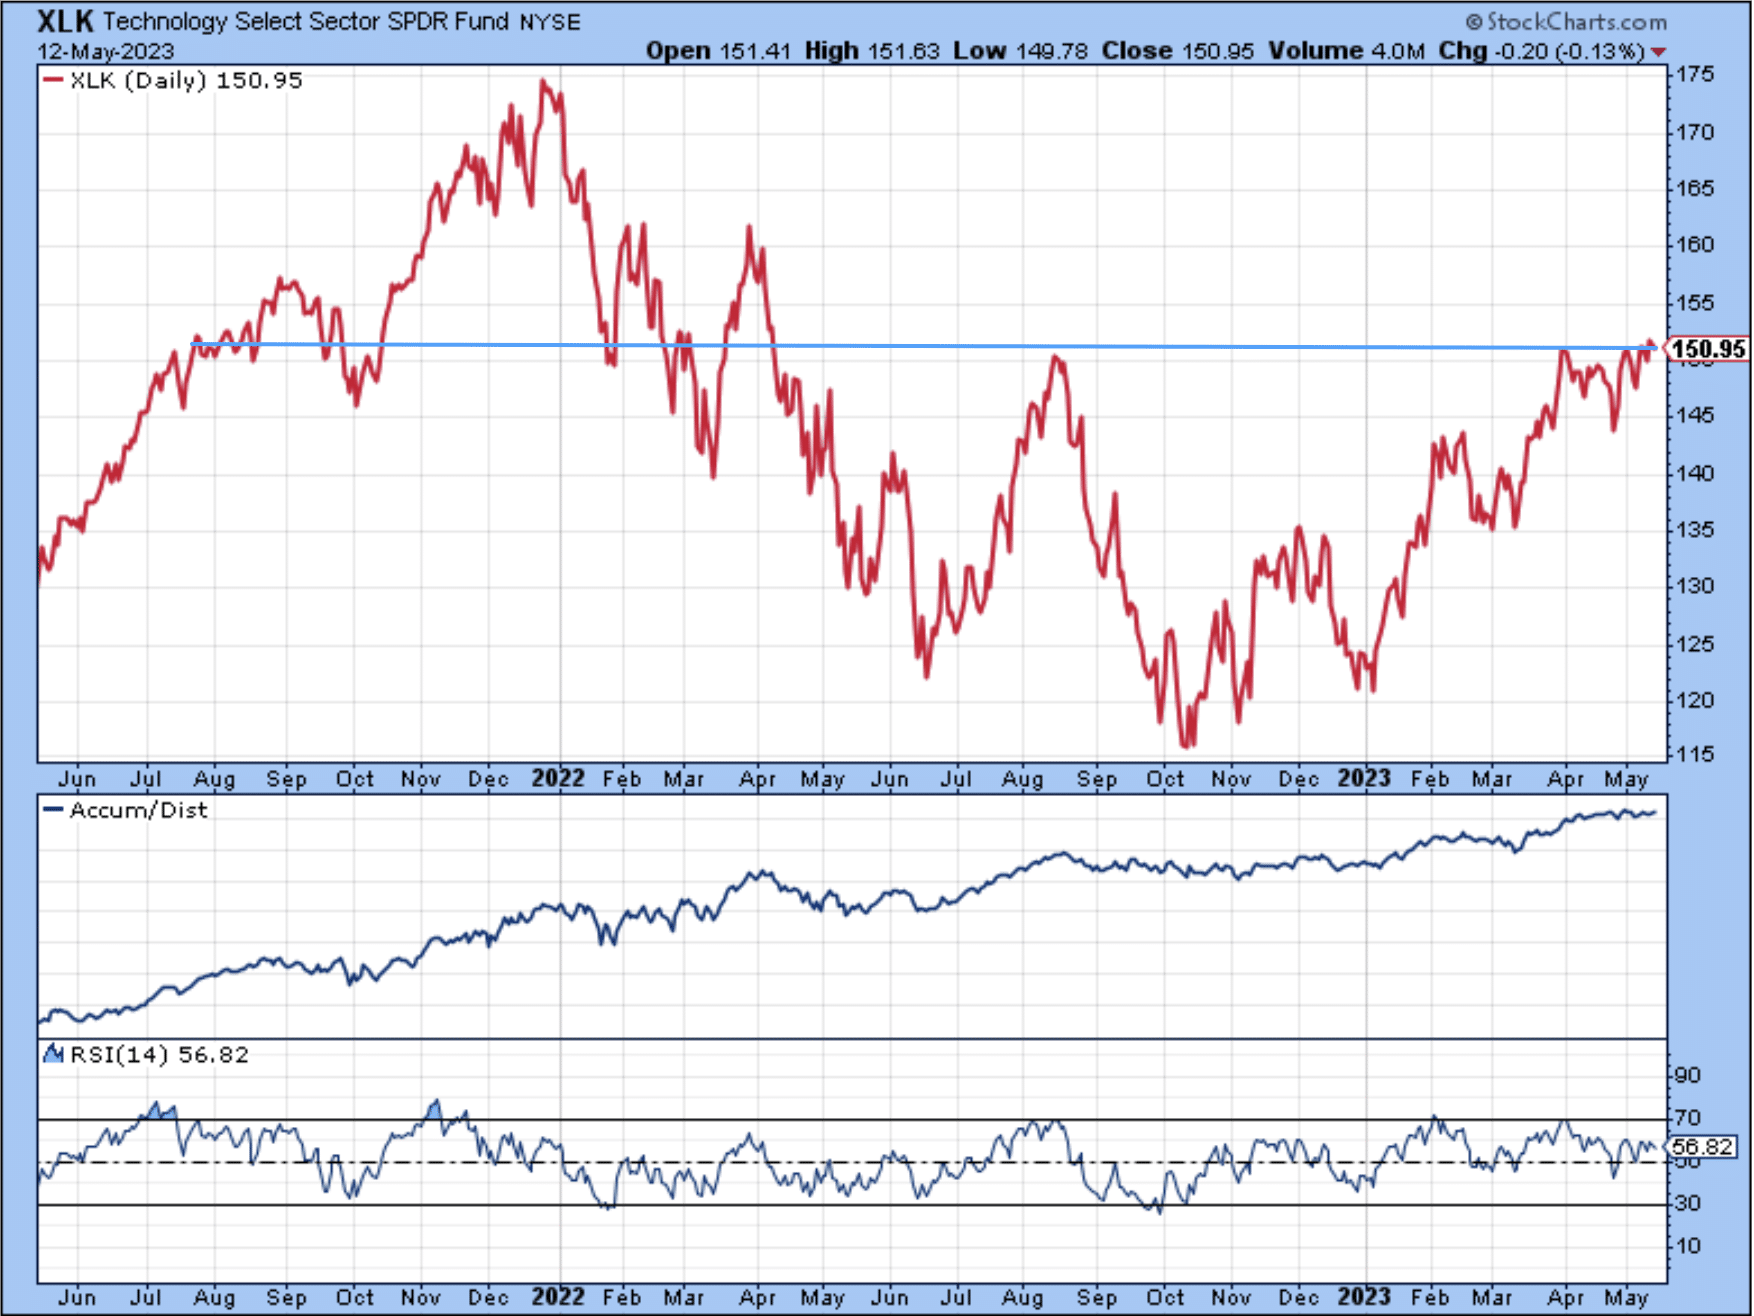
Here is the key takeaway from the recent breakout and consolidation of XLK: The breakout and relative strength to the S&P 500 as well as Nasdaq suggest that consolidation would be bought going forward, and therefore any weakness in the ETF hence forth is an opportunity for savvy investors.
Research Report Excerpt #8
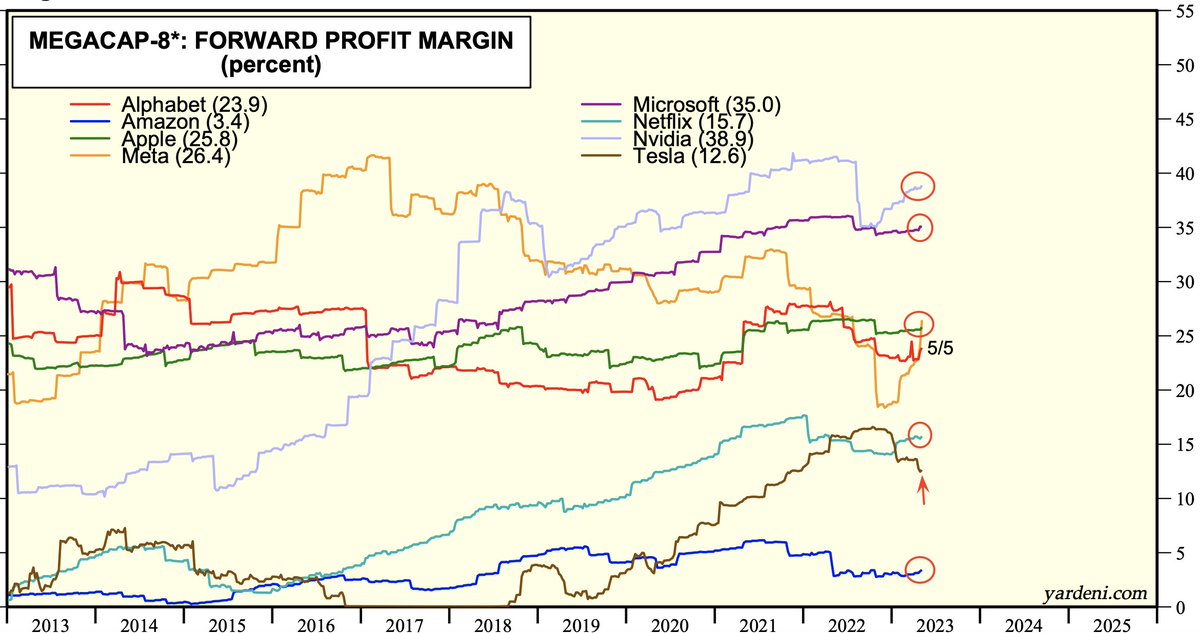
During the reporting season, every Megacap-8 company (except TSLA) reported higher forward profit margins. And you wonder why the market is being led by the Megacaps, Nasdaq, and Growth?
Research Report Excerpt #9
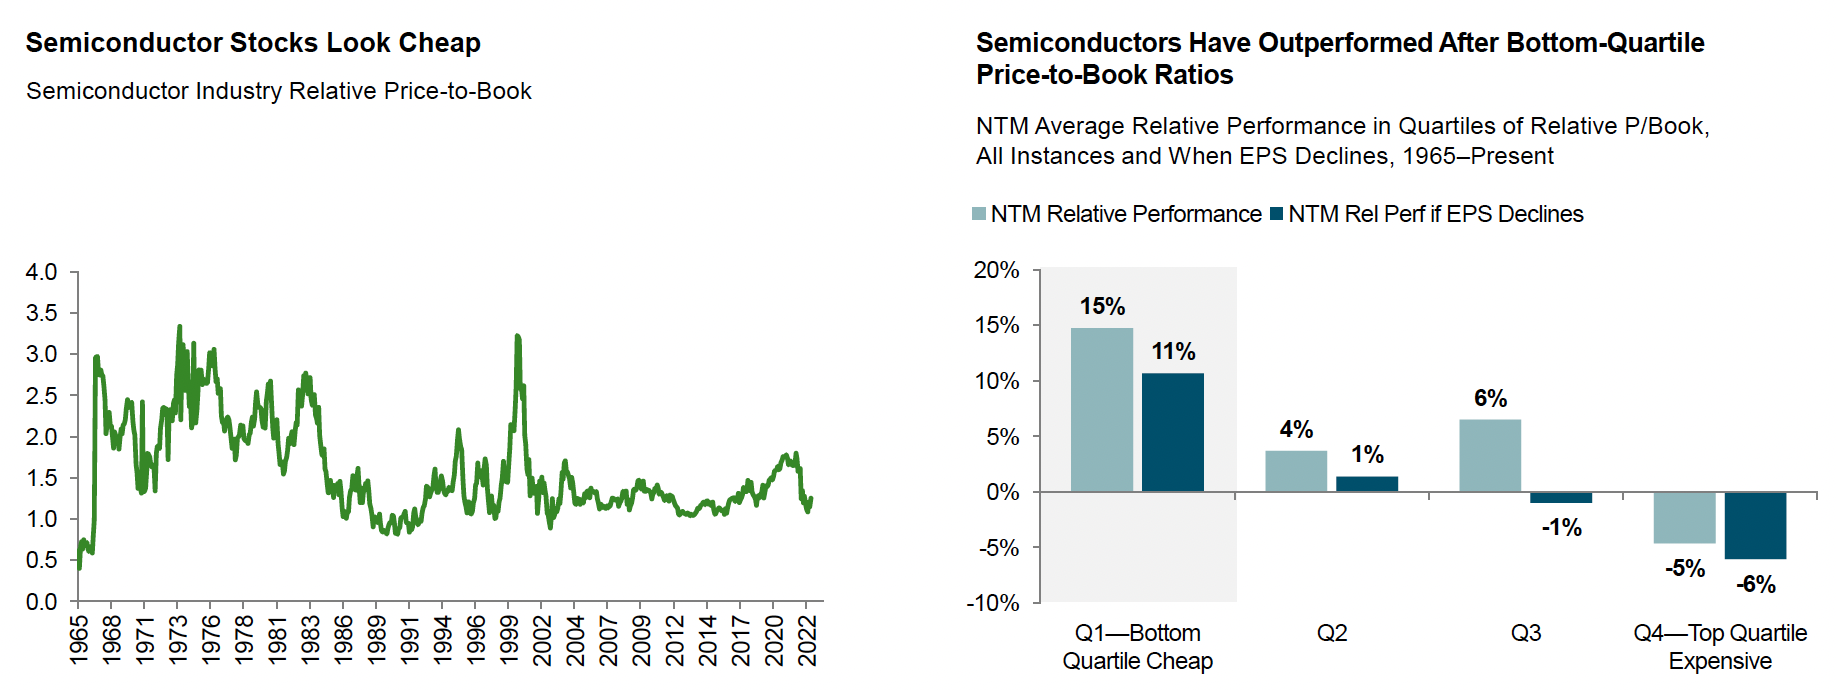
Although technology looked expensive on both trailing and forward earnings in the first quarter, certain sub-sectors looked historically cheap on book value. The standout was semiconductors, which reached bottom-quartile price-to-book ratios (left). From comparable levels in the past, semiconductor stocks have outperformed the market over the next 12 months, on average, even when earnings declined (right).


