

Research Report Excerpt #1
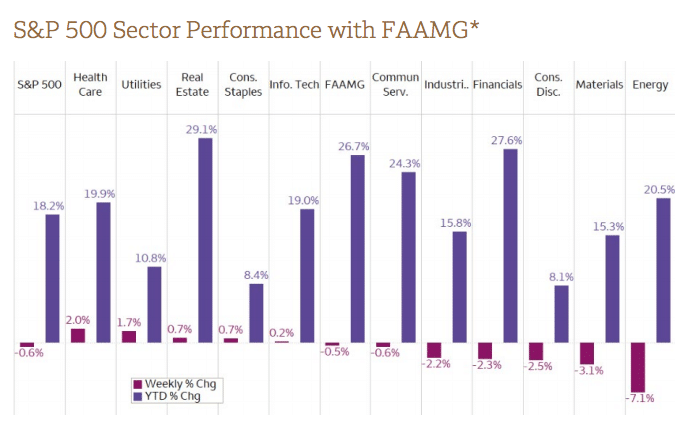
In a down week for all major indices, it’s clear that what worked was defensive in nature and what didn’t work for investors was cyclical in nature. This weekly performance comes on the heels of the latest University of Michigan consumer sentiment report (released Friday August 13), which was rather abysmal, falling below pre-pandemic levels.
Research Report Excerpt #2
This is something we highlighted in Finom Group’s July 18, 2021 Research Reportand with the chart below:
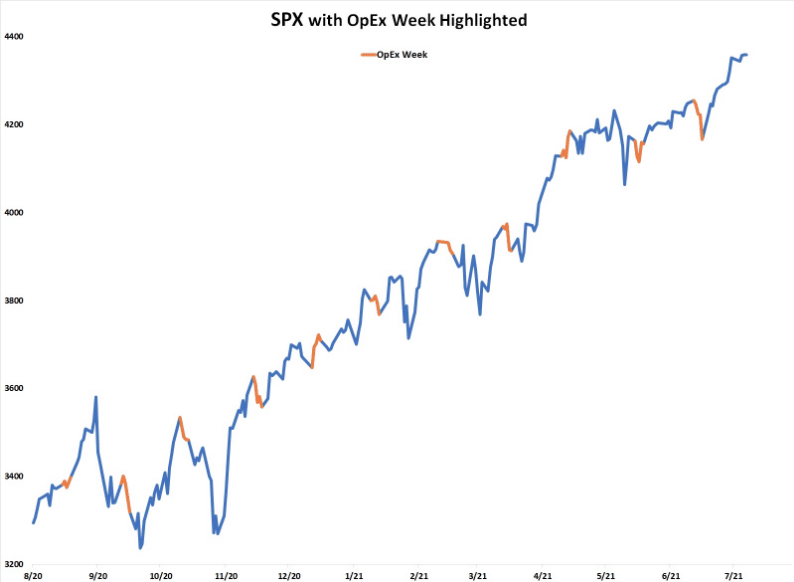
“If we look at the last 11 monthly Op/Ex weeks, 8 of the last 11 have been down weeks for the S&P 500. Unfortunately, or fortunately depending on your market exposure and/or market outlook, this past week’s decline during monthly OpEx now makes the down trend 9 of last 12 Op/Ex cycles for the S&P 500. What having this data in mind and accompanied with the UUP chart previously suggests that the current pullback in the market was to-be-expected, normal, and even healthy. Sometimes, knowing what you DON’T know is more important than knowing what you do!”
So here we are again, another down week for the S&P 500 for monthly Op/Ex. That would make 10 of the last 13 Op/Ex weeks with a negative S&P 500 return. Back in July, the Delta variant was headlined in the U.S., but highlighting the infections spreading throughout the United Kingdom and India. Issues related to jobless claims and rising inflation continued to litter the financial media landscape in July akin to the headlines this past week surrounding inflation, Delta infections and Fed tapering. The wall of worry produced by the financial and social media is endless. Where price action is found unfavorable, the narratives are amplified and the average investor’s EQ is tested.
Research Report Excerpt #3
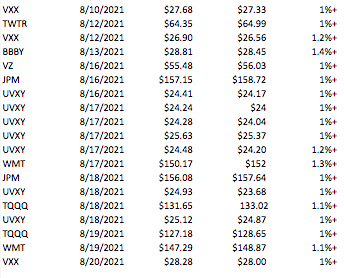
In the previous trading week, Finom Group trade alerts for Premium and MasterMind Options members slowed to just 4 completed trades. With stocks on sale this past week, and the analysis provided above however, our trading regiment and game plan found increased trading activity. (see trade alerts completed below over past 2-week period) In total, we initiated 15 trade alerts and completed 12 during the week.
I think, once again, the points raised in this segment of our weekly Research Report highlight the importance or role that quantitative data plays in level-setting, even stabilizing an individuals EQ. No, it’s not always easy to lean into the probabilities that are outlined in the data, but more often than not it will prove rewarding to do so.
Research Report Excerpt #4
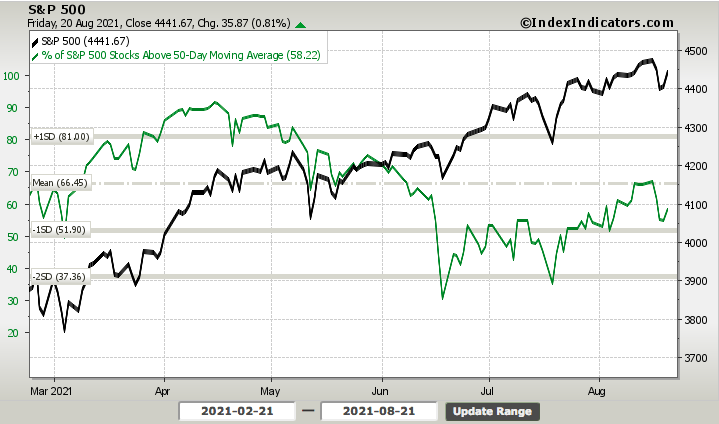
In the recognition of breadth neutrality levels, at the end of the week, is the all important need for more “price information”. It’s a matter of having an edge and adhering to the laws of market probabilities. Sometimes, this will evoke the need for investors/traders to exercise greater patience, allow price action to reveal opportunities aligned with one’s game plan. Indeed, the need to express greater discipline on the part of the active portfolio manager when an edge isn’t clear and present is optimal. The good news, for those active portfolio managers, however, was articulated and characterized above; this is a fast moving market. I wouldn’t be surprised if price action delivered a more clear message, resulting in breadth moving above or below the neutral level on Monday.
Research Report Excerpt #5
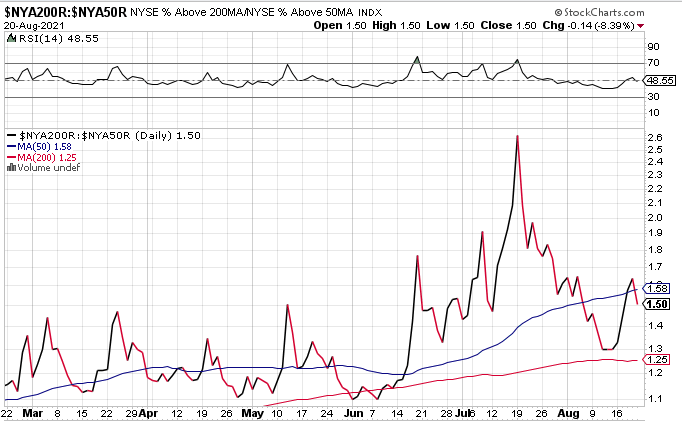
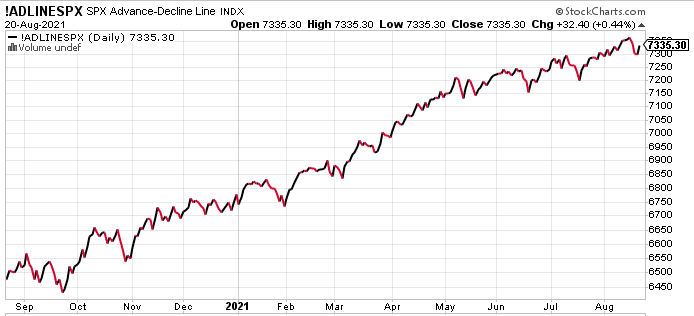
As it relates to NYSE breadth, our trusted breadth indicator above also highlights breadth neutrality. The relative breadth performance of % of NYSE above their 200-DMA to 50-DMA is right at the level that separates bullish from bearish conditions, 1.50.
Research Report Excerpt #6
July retail sales fell 1.1% and dipped 0.4% excluding autos, weaker than expected. But June numbers were revised a bit higher to respective gains of 0.7% and 1.6%, so offsetting some of July’s disappointment. Rather than sounding alarms or sounding to “Pollyanna” about retail sales that disappointed, I think we should recognize there are far too many factors surrounding the MoM weakness or strength in retail sales, which haven’t existed before. If you haven’t had the opportunity to watch our weekly State of the Market video, here are some details that we outlined concerning the July monthly retail sales report, given that the mainstream media has decided that the Delta variant is to cause for the Mom disappointment:
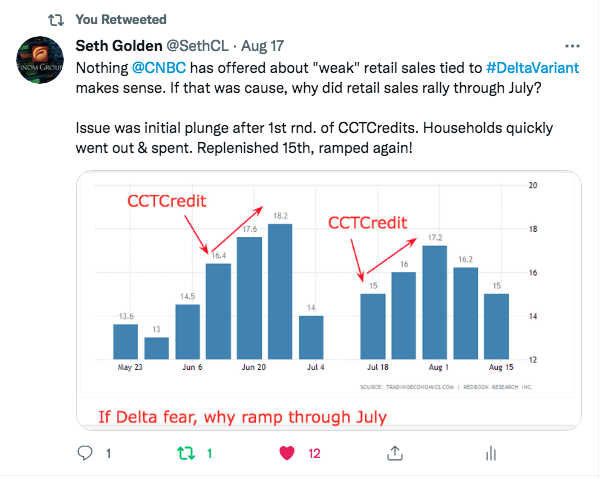
- June retail sales grew faster than economists estimates.
- The Redbook weekly retail sales release (YoY) shows the surge from mid-month into month-end of June. This tells us that indeed, consumers took the Child Care Tax Credit checks and spent it, boosting retail sales.
- But between month end and the next check there was a lull in retail sales as shown in the chart above.
- When did retail sales ratchet higher once again, you guessed it, mid-July when the Child Care Tax Credit checks were once again received.
- The Child Care Tax Credit checks provided tough comps in June, but it’s clear that regardless of Delta, when the consumer has the money to spend they are indeed spending it.
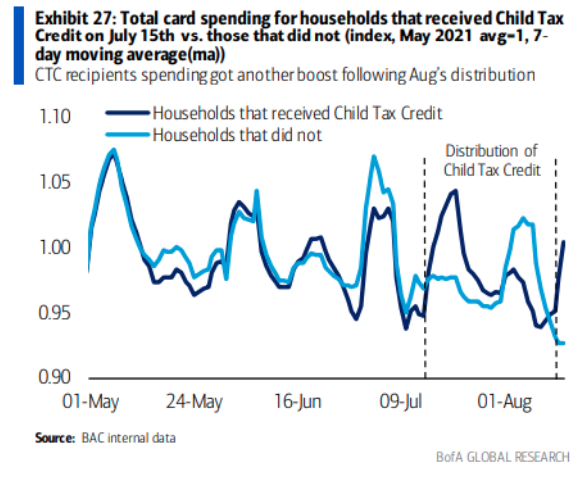
- The Bank of America Card spending data further validates our thesis that Delta be darned. Those who got checks spent them, those who didn’t weren’t spending as much.
- The 2 contributing factors to the MoM retail slowdown was supply shortages related to auto sales, Child Care Tax Credit timing.
- There simply isn’t anything that points to Delta concerns other than travel and leisure spending.
- But even on the leisure side of retail sales, Food and Restaurant spending was one of the bright spots, growing almost 2% MoM. Just doesn’t make sense to suggest Delta is weighing on retail sales.
I’m not completely dismissing some degree of Delta impacting retail sales anymore than I’m dismissing the fact that previous monthly comparisons simply established a very high bar for which to comp. Which carries more weight in the analysis than the other? Nobody knows and everyone will speculate, then profess to have known if a new trend in retail sales growth ensues. That’s right, retail sales growth! Keep in mind that retail sales declined MoM by 1.1%, but were higher YoY by nearly 16 percent, hence the high comparison comment.
Research Report Excerpt #7
There’s really nothing in the trending economic data that signals a reversal of the newly formed expansion cycle; especially with Industrial Production this strong. Industrial production increased 0.9% in July after rising 0.2% in June and 0.7% in May. That is an increase of 6.6% year over year. The headline was stronger than expected and is the largest gain since March.
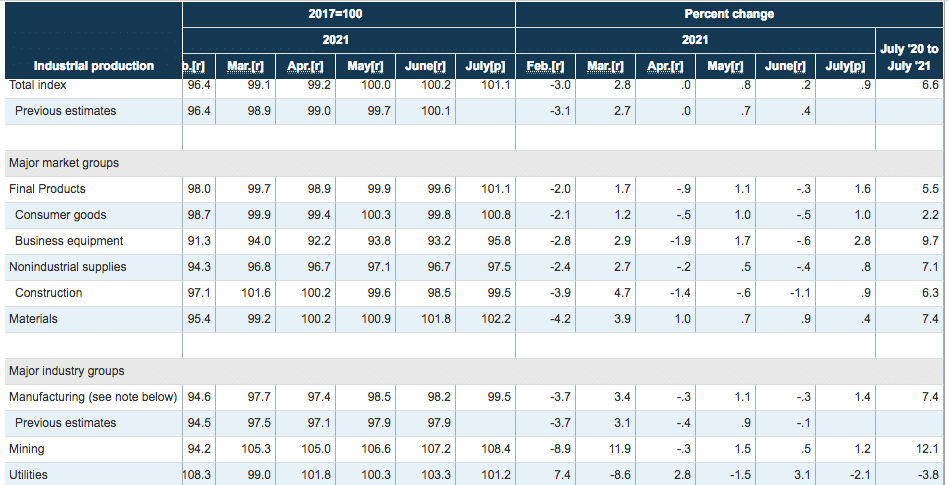
July manufacturing production jumped 1.4% from -0.3% previously. Utilities slumped 2.1% following June’s 3.1% gain and remain on a bumpy path. Mining was up 1.2% after edging up 0.5%. Capacity utilization climbed to 76.1% from 75.4%. It is the best since February 2020.
Research Report Excerpt #8
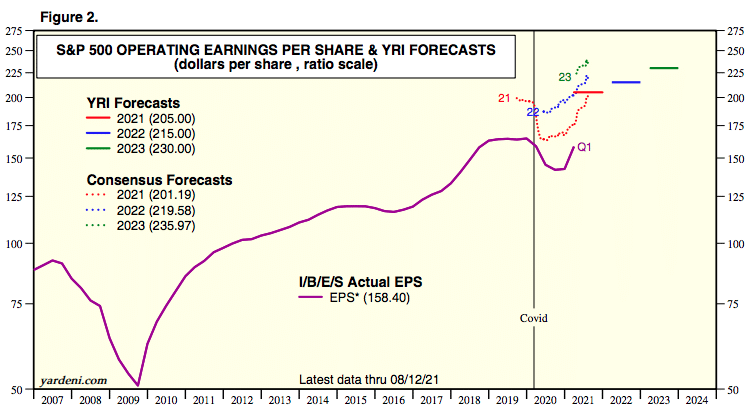
With Q2 earnings season at an end, we are now prepared to issue our revised FY2021 EPS forecast, which had been previously revised at the onset of the earnings season and highlighted in our July 18, 2021 Research Report as well:
“Today Finom Group is announcing its positively revised FY2021 EPS outlook from $193 per share to $208 per share. As a reference point, our original outlook coming into FY2021 was the highest on the “street”. The street caught up to our outlook by the end of Q1 earnings season. We are now, at the top-end of analysts projections once again, based on nothing less than the supportive economic outlook for EPS growth.”
Based on current trends in the economy, deleveraging of the corporate balance sheet, still yet cash strapped consumer with a healthy balance sheet etc. we are raising our FY2021 EPS forecast from $208 to $214 per share. The rate of change in profit/operating margin performance has somewhat laid to rest concerns over increased input costs/expenses, in part, due to supply line bottle necks and the trend in reflation. (see results and commentary from retailers below)
Research Report Excerpt #9
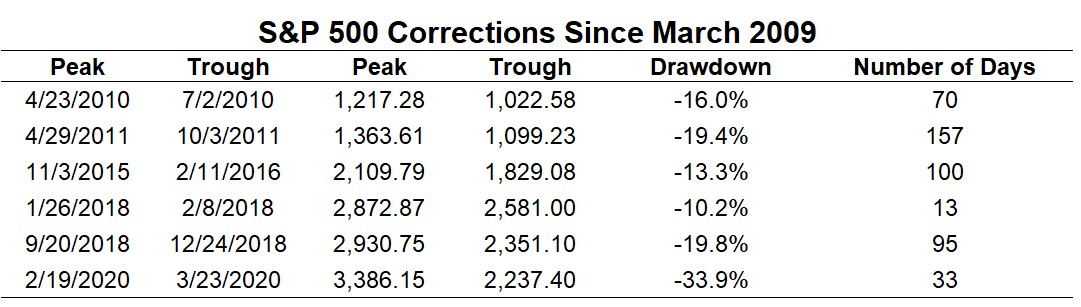
There have been at least 6 double-digit corrections with an average decline of nearly 19% since 2010. There was actually another double-digit correction in 2018 from February through March which led to new all-time highs and the Christmas Eve Massacre correction of 2018. The main difference between this cycle’s double-digit corrections and those from previous cyclical bull markets is these corrections didn’t last very long, while the crashes in the early-2000s were measured in years instead of months. Why the shorter corrections in 2010s? Liquidity!


