
We’re going to start with some of the more favorable market headlines before getting into why the Nasdaq is set to pullback significantly as indicated by the equity market futures. The more favorable headlines come from that which has created a major investor sentiment roadblock for several months now, trade tariffs and spats around the globe. In the final hour of trading yesterday, headlines from the President Trump and European Commission President jean-Claude Junker meeting in Washington.
Trump-Junker Meeting
President Donald Trump said he and European Commission President Jean-Claude Juncker agreed to work toward “zero tariffs” and “zero subsidies on non-auto industrial goods.” At an unscheduled news conference following a joint meeting, Trump also said the EU would buy more U.S. soybeans almost immediately and that he and Juncker would work to resolve tariffs on European steel and aluminum.
Europe will start examining the purchase of U.S. liquefied natural gas, and it also is proposing to consider dropping to zero the tariff rate on non-automotive industrials. In return for agreeing to talk more regularly, the two sides will dismantle steel and aluminum tariffs as well as not impose any new ones.
With all the noise, fear and concerns surrounding the potential implementation of more tariffs going forward, yesterday’s headline proved positive for the major averages, which finished near their highs of the day. Wednesday’s outcome from the joint talks in Washington also showed that the White House does have limits and is willing to consider not letting things spiral out of control as midterm elections approach.
Facebook Q2 Report
While the markets mostly favored the news surrounding global trade, the tech sector may express a sharp devaluation during Thursday’s trading session on the heels of Facebook Inc.’s quarterly report. When the firm reported results after the closing bell on Wednesday, Facebook missed projections on revenue and global daily active users. Below are just some of the metric results and estimates reported for the Q2 2018 period by Facebook:
- Earnings per share: $1.74 vs. $1.72 per a Thomson Reuters consensus estimate
- Revenue: $13.23 billion vs. $13.36 billion per a Thomson Reuters consensus estimate
- Global daily active users (DAUs): 1.47 billion vs. 1.49 billion, according to a StreetAccount and FactSet estimate
- North American DAUs: 185 million vs. 185.4 million, according to a FactSet estimate
- European DAUs: 279 million vs. 279.4 million, according to a FactSet estimate
- Average revenue per user (ARPU): $5.97 vs. $5.95, according to a StreetAccount and FactSet estimate
North American DAUs remained flat despite the Cambridge Analytica data leak scandal and fake news issues. However, average revenue per user in the region rose despite the lack of growth. It reached $25.91 per user, up from $23.59 during the first quarter. Facebook also surprisingly missed on advertising revenue projections, reached $13.04 billion compared with the StreetAccount and FactSet estimate of $13.16 billion.
During the Q2 2018 conference call, Facebook guided its revenue growth rates to be lower than the year prior, especially in the second half of this year. Sequentially in the third quarter and fourth quarter, it expected the decline to be as much as high single digit percentages. Some reasons included Facebook investing in Stories, which has lower levels of monetization, as well as improving privacy features as a result of GDPR and other user demands. It also is bracing for currency fluctuations, as the dollar gets weaker.
Shares of FB were down nearly 20% after reporting results and are down some 16% in the premarket trade on Thursday. While all the negative headlines surrounding the company’s slight revenue miss and lowered sales guidance comes in droves, long-term investors will likely be rewarded with a share price rebound in the not too distant future. Keep in mind this is a digital marketing and mobile platform with over a billion users. Total sales for the company, which is roughly 11 years old, grew by 42% YOY. This is sales growth from a mature company that the vast majority of existing companies from any industry would love to have as a “problem”. Simply put, the share price got ahead of itself, having run some 40%+ since the lows from the Cambridge Analytica scandal. The stock was priced for a perfect earnings performance and anything shy of perfection would find share price retracement. And with that, the tech-heavy Nasdaq is looking set to decline by roughly 1.4% at the open on Wall Street.
S&P 500
The S&P 500 (SPX) has had a significant rally over the last couple of months and more recent weeks. The index successfully broke out and above 2800 recently. The SPX’s 14-day relative strength index, a gauge of the magnitude and persistence of price fluctuations, rose to levels unseen since January on Wednesday. This might be perceived as concerning given what occurred back in late January and early February, but many of the issues that resulted in the February market correction have been technically resolved since then.
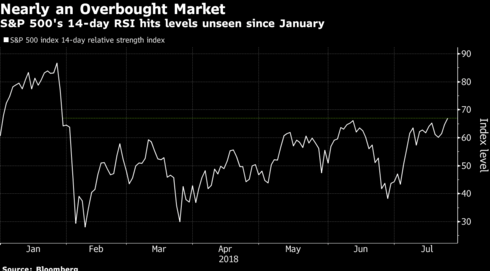
The chart is pretty clear that while the 14-day RSI has been steadily rising since mid-June, it is nowhere near the January levels. This current rise in the RSI is a far cry from January’s euphoria and when the S&P 500’s RSI reached levels unseen since 1961. Nonetheless, the technical metric is something to take note of and revisit daily.
Amazon Set to Report
While the S&P 500 has continued to perform well in the current trading week and with most corporate earnings coming in better than expected, it has been a big week for the FAANG stocks. Alphabet helped bolster the bullish case for investors while the latest report from Facebook proved disappointing. Netflix’s report in the prior week also found its respective share price under pressure. But it’s not over for the FAANG reporting cycle as Amazon takes center stage on Thursday. The company is set to report earnings results after the closing bell on Thursday.
With respect to Amazon’s earnings, here is what to expect according to analysts and data tracking firms. FactSet is guiding for earnings of $2.48 including Whole Foods Market, up from 40 cents per share last year.
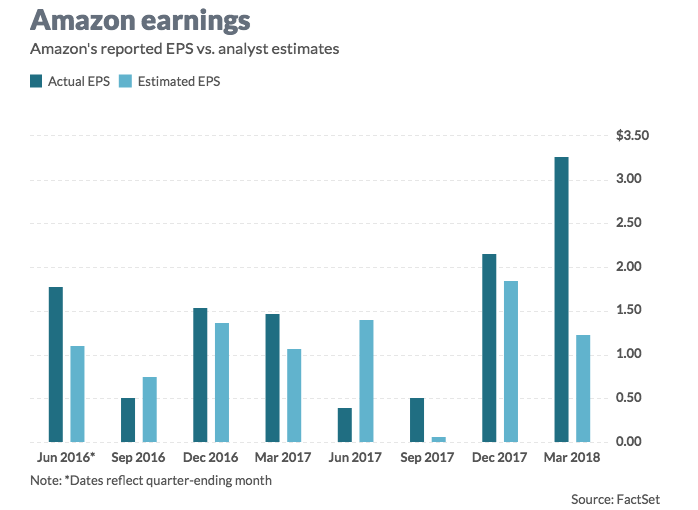
As shown in the bar chart above, Amazon has beat earnings expectations in each of the last 3 quarters. FactSet expects revenue of $53.37 billion, up from $37.96 billion last year. Estimize expects revenue of $54.17 billion. Now let’s take a look at some notes from the analyst community.
- Stifel analysts think Amazon is well positioned in three industries: e-commerce, cloud computing and digital advertising.
“A healthy consumer spending backdrop in the U.S., which should support strong results in the retail business, and continued strength in both AWS and advertising are likely to be highlights in the quarter,” analysts led Scott Devitt said. “Growth in AWS accelerated in the most recent two quarters as clients move more workflows to the cloud and client usage continues to grow.”
- Stifel is expecting cloud revenue to grow 46% year-over-year to $6 billion. Analysts expect the call to focus on Prime Day, grocery, the company’s health care strategy and investment for the remainder of the year.
- Cowen analysts estimate second-quarter revenue for the cloud business at $5.95 billion, up 45% from last year. U.S. Prime membership is estimated at 60 million households during the second quarter.
-
“Given the strong cloud backdrop and our early ’18 CIO survey indicating an intent to accelerate spend, along with ongoing advertising growth, we believe AWS and ‘other’ segment revenue upside is likely,” wrote Piper Jaffray analysts led by Michael Olson. “Between these two non-retail segments (AWS & Other), we see potential for slight Q2 upside for Amazon overall revenue and operating income, despite an online retail segment revenue that is likely to be uneventful.”
- AWS is still underappreciated by many investors, said Daniel Ives, head of technology research at GBH Insights, in a recent note. Ives expects “35% of application workloads will migrate to the public and hybrid cloud by the end of 2018 and 55% by 2022 on the cloud which should be a major benefit and tailwind for AWS going forward.”
It remains to be seen whether or not Amazon can live up to its record-level valuation when it reports on Thursday afternoon…and revive the FAANG acronym from current infamy. Moreover, let us not forget that Apple Inc. (AAPL) will deliver its quarterly results in the coming week.
Weekly Economic Data: Q2 GDP
Switching gears from FAANG and earnings season here, the Commerce Department releases second-quarter GDP data on Friday at 8:30 a.m. Eastern time. There is a great deal of build up into the number with forecasts as high as 5% plus. The MarketWatch-compiled economist consensus calls for 4.3% growth, which would represent the fastest growth rate since the 5.2% gain put on the scoreboard for the third quarter of 2014.
The latest GDPNow Forecast rose to 4.5% following the most recent economic reports surrounding consumption and retail sales.
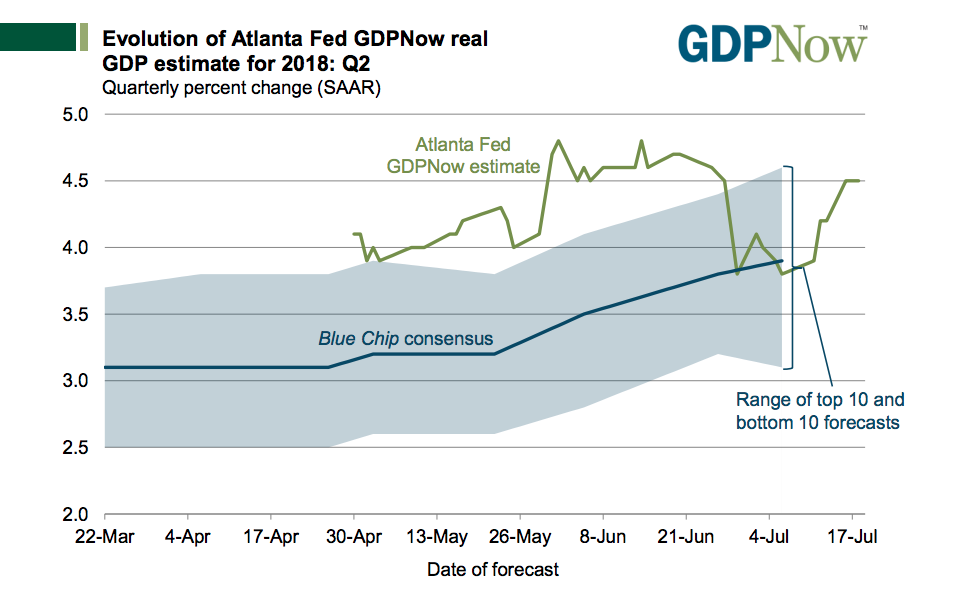
Exports, a drag on first-quarter growth, will provide what may be the biggest quarterly contribution in nine years. Morgan Stanley points out that soybean exports are up almost 9,400% on an annualized basis over the past three months. That’s not going to last. Additionally, Morgan Stanley says net trade and inventories will boost GDP by 2.2 percentage points to the 4.7% growth level that the investment bank expects.
Consumption should have improved from the first quarter of 2018 according to the Atlanta Fed’s nowcast model for second quarter GDP. The Atlanta Fed’s nowcast model calls for the American consumer to account for about half the economic growth, a welcome boost from the anemic 0.9% growth in the first quarter. Over the preceding 10 quarters, U.S. consumption has averaged 2.6% growth, and economists expect the second-quarter figure to be possibly above 3 percent.
“A healthy labor market, rising disposable-income growth as a result of the tax cuts, and elevated consumer confidence collectively support a solid pace of consumption,” said Sam Bullard, a senior economist at Wells Fargo.”
If second-quarter GDP meets forecasts, the U.S. would have expanded at a 3% rate or higher in the first half of 2018. And it would put the economy on track to achieve 3% GDP for the full year. Well, the last time the U.S. grew 3% in a calendar year was 2005. The past 12 years mark the longest stretch in the nation’s history in which GDP has failed to break the 3% mark.
Facts & figures: 10-yr and S&P 500
The bears, try as they might and without any ending of effort in sight, still find themselves reaching for any favorable metric of substance that points to a near term end of the bull market cycle. Earnings expectations continue to ratchet higher, having started the season with expectations for S&P 500 earnings around 20.5% growth and now elevating to roughly 22% expected growth. As such, if the market is going to enter a bear market cycle it will have to come from something beyond the earnings picture.
Rising rates and yields are always found within the bear-perspective and bull market pundit narrative. We can understand why this might be the case given the record levels of consumer, corporate and federal debt. Having said that, when we put things into their most appropriate perspective we come to realize that it’s all about where rates are expected to rise to and from whence the rise from. Rates are undeniably rising, in kind with the Fed rate hike cycle. Rising rates tend to place a burden on debt repayment, be it from the corporate or consumer sector. But rates are rising from all-time record low levels. When we review the Fed’s neutral rate stance of roughly 2.5% near-term and 3% longer-term, such levels are still below levels seen at the turn of the century and prior to the financial crisis of 2008. And this coming at a time when the labor market is seeing record low levels of unemployment and moderate wage increase. More importantly let’s look at the history of a rising 10-year yield and compare it with the S&P 500. After all, that’s what we more greatly consider as investors, the benchmark rate vs. the benchmark equity index.
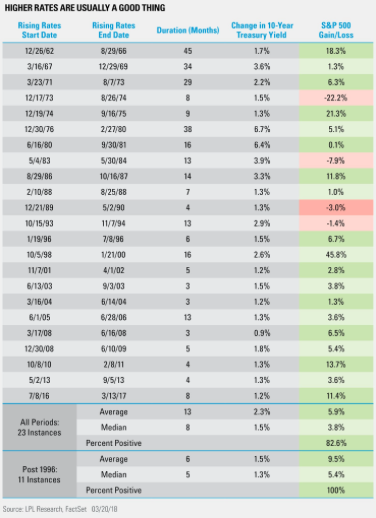
Our review comes via the advanced study from LPL Financial’s Ryan Detrick. In his notes he offers the following:
- Two years ago this month, the 10-yr yield bottomed at 1.36%.
- It is near 3% now.
- Stocks tend to follow the 10-yr higher.
- In fact, since 1996, there have been 11 periods of a higher 10-yr yield.
- The S&P 500 gained all 11 times.
And there you have it folks. As the markets look to open for the trading day on Wall Street, European equity indexes are showing favor to the recent U.S./E.U. trade negotiations. While the tech-heavy Nasdaq is under great pressure, the Dow is set to open modestly higher with the S&P 500 modestly lower. While there is a great deal of news to unpack in the current market environment, with earnings season fast developing, volatility has remained relatively low. The VIX has largely brushed off the news cycle and currently rests just above 12 percent. As we discussed in a previous daily article, the VIX of VIX or volatility of volatility index (VVIX) was elevated in recent trading days (A reading above 100 is deemed elevated historically). During yesterday’s trading session, VVIX dove 4.5% on the trading day to finish around 94 and relieving some anxiety surrounding the potential for the index to signal troubled waters for the markets. Having said that, we’ll see what Amazon has in store for the market after the closing bell.


