

Research Report Excerpt #1
A huge challenge to achieving long-term gains in the market, if not the #1 reason, is the ability to overcome “fears”. The fear emotion is the greatest variable an investor/trader will likely ever contend with in the market. It’s a seemingly endless battle. Over the last 15 years as an active trader and investor, I’ve learned that the best way to overcome fears are with the following:
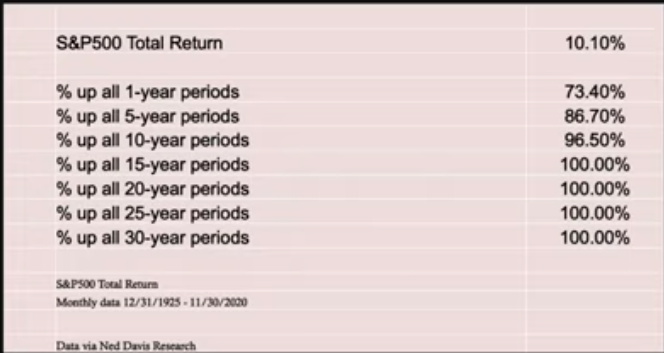
- Time/duration: As we’ve outlined many a time in the past, TIME is the investors greatest asset.
- Never invest capital that is NOT INVESTMENT CAPITAL.
- Maintain an open-minded, flexible approach to the trend, knowing that all trends breakdown but resume the path of least resistance.
- Build your resources, create a team of resources.
- Stay invested, no matter what, stay invested… because…
Research Report Excerpt #2
With respect to the more immediate potential market trend, the path of least resistance remains higher. For the upcoming week, however, we have some conflicting seasonal data. Recall the Memorial Day weekly S&P 500 performance data that was outlined in this past week’s State of the Market video below:

- Memorial Day officially became the last Monday of May in 1971. Since then, it has been a bullish week for stocks with the S&P 500 (SPX) averaging a gain of 0.52%, which beats the typical weekly return since then of 0.17%. Recently, however, the upcoming week has been dreadfully bearish. Since 2010, the index has lost an average of 0.60% during the week of Memorial Day. Only five of the 11 returns have been positive. Last year we saw a solid Memorial Day week as the S&P 500 gained just over 3%. While the market has done outstanding since 2010, this coming week of Memorial Day has been an exception.
Research Report Excerpt #3
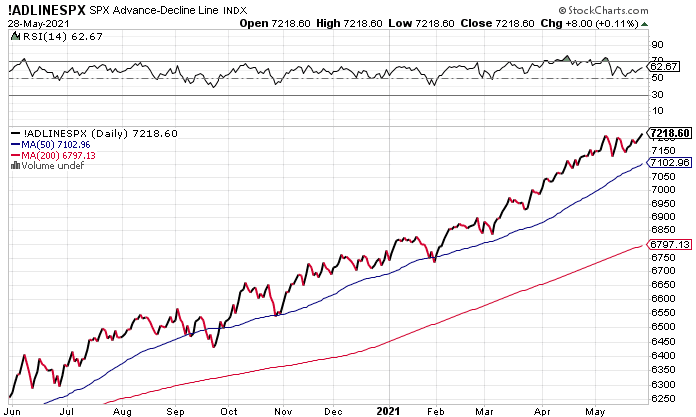
For a clearer view of the S&P 500 A/D line achievement this past week, I’ve extrapolated the chart as shown below. The truism of markets that we have come to know is that breadth leads price. Ultimately, the A/D line highs suggest that new highs at the index level are still to come. It may take days, weeks or even months, but this is a net positive development even as the S&P 500 did not achieve a new all-time high this past week. The benchmark index finished the week less than 1% from its all-time high.
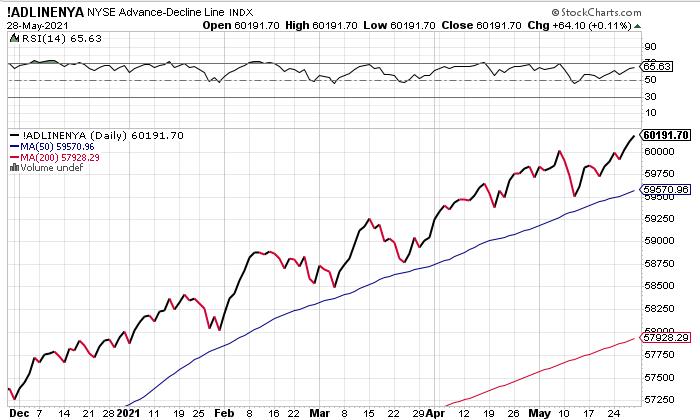
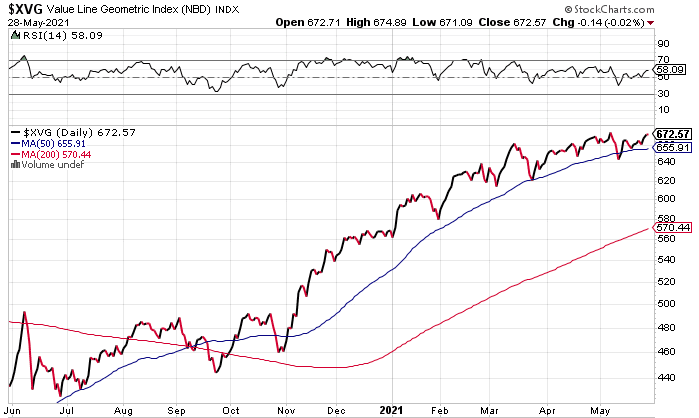
Possibly a more convincing new all-time A/D line came by way of the NYSE this past week. The following 2 charts show the strength in NYSE breadth, coupled with the Value Line Geometric Index (XVG), which is also at its record level. These 2 charts, when coupled with the S&P 500 A/D line record high, help to dismiss with the permabear rants that largely focus on narrow data sets and correlations that can’t scale or cause market declines of great consequence. A/D lines are, by definition, SCALE! If it’s problems with the market you seek, go to the A/D lines for any confirmation.
Research Report Excerpt #4
The GOOD NEWS is that this past week the % of stocks trading above their 50-DMA within the Nasdaq continued to climb.
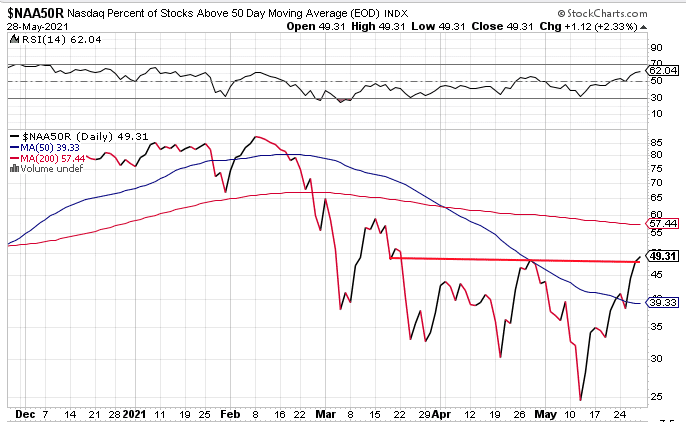
The better news is that the percentage level is better than it was in late April when the Nasdaq made its record high. The even better news is that the RSI for this breadth indicator is also better than the April period, suggesting the move in Nasdaq stocks participating in the uptrend is stronger today than the April period as well. The breadth indicator still did not finish the week at 50% (just shy of it), so we remain with a cautiously optimistic outlook and open-minded.

The Nasdaq A/D line is not even close to it’s former high, but it has steadily improved since mid-May and post its 8% dive from all-time highs. As the chart above shows, the A/D line has broken slightly above the descending trend line. Could it check back for support? Certainly! Again, we have signs of improvement, but still the index has work to do.
Research Report Excerpt #5
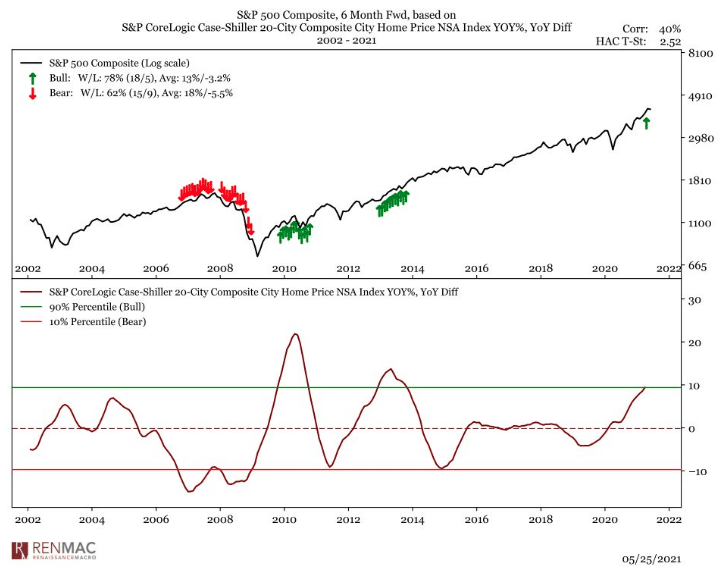
Home prices are rising rapidly due to a variety of factors that include, at least, population demographics and a lack of inventory. For all the attention that home price appreciation receives, investors need mostly to know that this real rise in home prices and household wealth, tends to lend itself well the stock market. House price data has a good relationship to forward S&P 500 returns. It’s not a deep enough history for us, but it rolls over before the end of the market cycle. That implies there is still more gas in the market’s tank. (see study below)
Research Report Excerpt #6
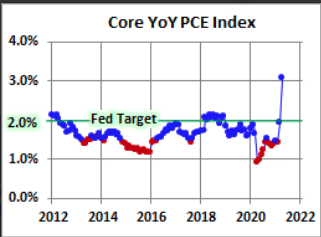
On Friday, a key U.S. inflation gauge rose year over year, higher than expected. Federal Reserve officials consider the core PCE to be the best gauge of inflation. The core personal consumption expenditures price index increased 3.1% in April from a year earlier. The Fed considers 2% to be healthy, though it is committed to letting the level average higher than usual in the interest of promoting full employment.
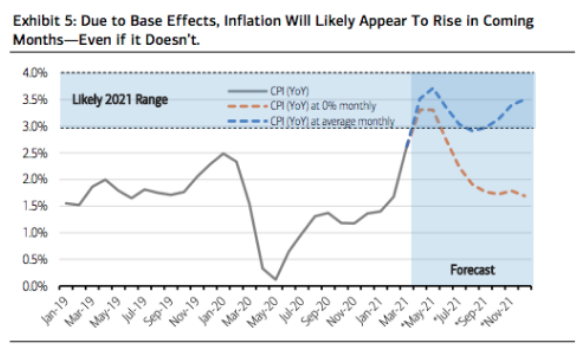
Inflation pressures are building, both at the producer level and at the consumer level. At the producer level, the producer price index for final demand, which measures the average change over time in prices received by producers for domestically produced goods, services and construction, rose 6.1% in April from a year earlier. This was the largest 12-month increase in the series’ history (since November 2009). At the consumer level, the 12-month percent change in the consumer price index (CPI) accelerated from 2.6% in March to 4.2% in April, its largest percent change since September 2008.
Several factors explain the recent resurgence in inflation. These include rising energy prices and higher prices of some goods and materials that have been in short supply because of supply chain disruptions or adverse weather in February that hampered petrochemical production in Texas and Louisiana. Another key determinant is the “base effect”, or the magnification of price increases in March and April 2021 because of the decline in prices in March and April 2020, during the depths of the pandemic.
Research Report Excerpt #7
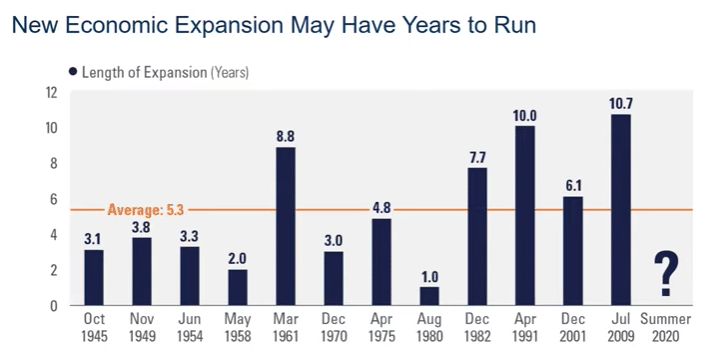
The state of the U.S. economy is one that is strengthening, gathering momentum. This has been accompanied by momentum in Asia and the genesis of an economic recovery in Europe. Nobody knows how long this fledgling expansion cycle will last, although history suggests that economic expansion cycles have lengthened over time, with the previous expansion cycle proving the longest in modern history (kind of a paradoxical phrasing).
Finom Group recognizes that inflation is running hot, largely due to base effects and some unintended consequences associated with an uneven global economic recovery, based on the vaccination process. The Fed has adopted a policy framework that accepts a higher average rate of inflation over the coming months, possibly into year-end. The abundance of stimulus takes many months, if not quarters, to filter through the economy. We believe the already record level savings rates will remain ebullient into 2022, as the next tranche of stimulus works its way onto the household balance sheets this summer.
- The American Rescue Plan temporarily expands the child tax credit for 2021. First, it allows 17-year-old children to qualify for the credit. Second, it increases the credit to $3,000 per child ($3,600 per child under age 6) for many families. Third, it makes the credit fully refundable and removes the $2,500 earnings floor. Fourth, it requires half of the credit to be paid in advance by having the IRS send periodic payments to families from July 2021 to December 2021.
In the scope of economic forecasting outcomes, the average economist would be hard pressed to discover the immediate dangers of allowing an economy and inflation to run hot near-term. For this reason, most offer a longer-term outlook/forecast that is filled with dangers and unintended consequences that exacerbate wealth inequality. While the wealth inequality gap is a historic norm of the U.S. society and economy, such considerations of economists prove nothing more than talking points historically as the wealth inequality gap has been found for no solutions in the post-WWII era, and with the gap only widening since. When viewed against this truism of society and the economy, what are we truly concerned about should the inflation rate run hot for the next couple of quarters and before the supply/demand equation balances out, which is ultimately dictated by consumer spending. The aforementioned is not to dismiss the potential adverse affects from protracted periods of above average inflation, but rather to suggest the consumer will ultimately weigh in on the price impacts with their respective activities.
Research Report Excerpt #8
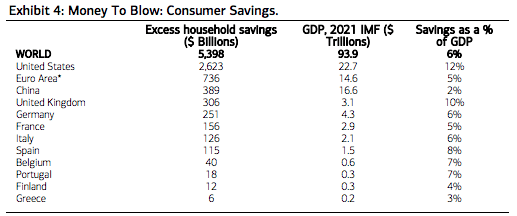
The consumption boom, according to Merrill Lynch, while U.S.-led, is about to go global, positioning likely future earnings upside for such sectors as Consumer Discretionary, Technology and various cyclical plays. The 3 largest consumer markets in the world, the U.S., China and the Euro Area, experienced a varied (ranging from 11% to 26%) drop in consumption and a rise in consumer savings (ranging from 4 to 20 percentage points) during the pandemic. For this reason, the outlook for the global economy has never been more closely tied to the consumer. In part thanks to government stimulus measures, disposable incomes remained elevated during the pandemic, and excess savings lined consumers’ pockets. At the global level, Moody’s Analytics estimates households had accrued $5.4 trillion in pandemic-related savings by the end of the first quarter of this year, as shown in Exhibit 4.
Research Report Excerpt #9
Chip suppliers fuel the power behind great products

“Everything noted above is a fundamental fact! SMH or SOXX are not too far from their all-time high ETF prices. When this highly touted and fundamentally strong sector of technology find improving technicals on an absolute or relative basis is not my concern as we would welcome weakness. I’m not putting myself in a position to fret over the technicals, given the overwhelming fundamentals. Investors would be wise to consider allocating to semiconductors on weakness and within keeping of one’s risk tolerance, IN MY OPINION.”
Just 2 weeks ago there became an opportunity to add a semiconductor stock or ETF (SMH/SOX) to one’s portfolio. I added SMH to the Golden Capital Portfolio and have traded the ETF since $228 a share, effectively growing the position through swing/scalp trades. Since May 12th, SMH trough at $223 and closed this week at $246. Bear in mind that if I’m outlining an investment opportunity to Finom Group members, I’m likely taking that opportunity on behalf of Golden Capital Portfolio investors and discussing it with Finom Group Premium and MasterMind Option members inside the Trading Room daily/weekly.


