
On Monday, and with the mega-tech FAANMG stocks coming under significant pressure, the equity markets performed a major reversal intraday. The S&P 500 achieved a new, post-bear market and new bull market high of 3,235 Monday. This was the first new high for the benchmark index since June 8th and a prior to a 5-week consolidation period. Upon achieving this rather bullish feat of strength Monday, however, the S&P 500 succumb to profit taking, ahead of the big money center banks’ earnings season. Monday the S&P 500 finished down 29 points, filling the gap it had created at the onset of trading. In and of itself, that’s not such a bad thing. Almost all gaps get filled, it’s just a matter of when they get filled. The S&P 500 still has one open gap to the upside at 3,328.
According to Bespoke Investment Group, Monday’s reversal for the S&P 500 was the first time since March 20th that the index was up over 1.5% intraday but then finished the day down over 0.75% versus the prior day’s close. The chart below shows every similar occurrence going back to the late 1990s. The bulk of these prior occurrences all occurred during the late stages of the Financial crisis, but outside of that period, there were also a handful of occurrences leading up and after the dot-com peak.
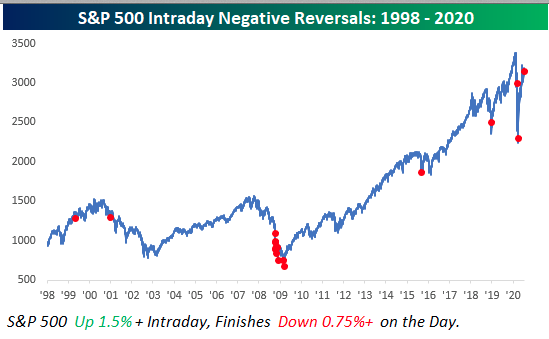
More recently, occurrences in the last ten years have been more likely to occur in the later stages of a sell-off (August 2015 and December 2018) than near a peak. Overall, of the 17 prior occurrences since 1998, the S&P 500’s average next-day return was a gain of 1.24% (median: -1.13%) with positive returns just eight times. From a short-term perspective, the only takeaway is that volatility remains in place. On the day after all 17 prior occurrences, the S&P was up or down at least 1% each time. That trend continued with a rally on Tuesday, but not before some more declines.
The selling pressure from Monday’s trading session proved short-lived. The major averages came under pressure once again on Tuesday, but the sellers were overcome, possibly, by the Federal Reserves POMO. What is POMO, you might be asking? POMO is Permanent open market operations, one of the tools used by the Federal Reserve to implement monetary policy and influence the American economy. POMOs are the outright purchases or sales of securities for the system open market account (SOMA), which is the Federal Reserve’s portfolio. The schedule of POMO was released on Monday. The following table is that schedule, which also identified Tuesday as the largest POMO day of the month.
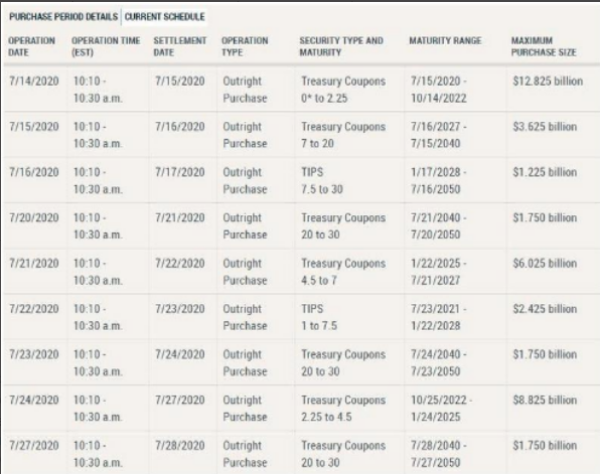
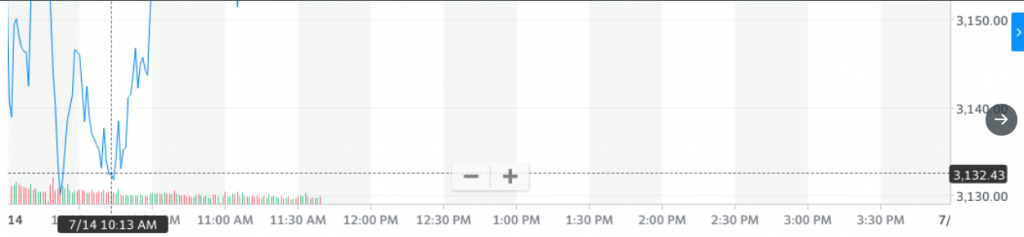
POMO operations take place between 10:10 and 10:30 a.m. EST for each POMO day. The flood of liquidity into the equity market obviously served to pressure bond yields on the trading session, which according to many market participants positively reflects the equity risk premium and serves to inflate equity/ETF appetite. What we can’t deny is that the lows of the trading day did, indeed, coincide with the conclusion of POMO on Tuesday. (See chart below)
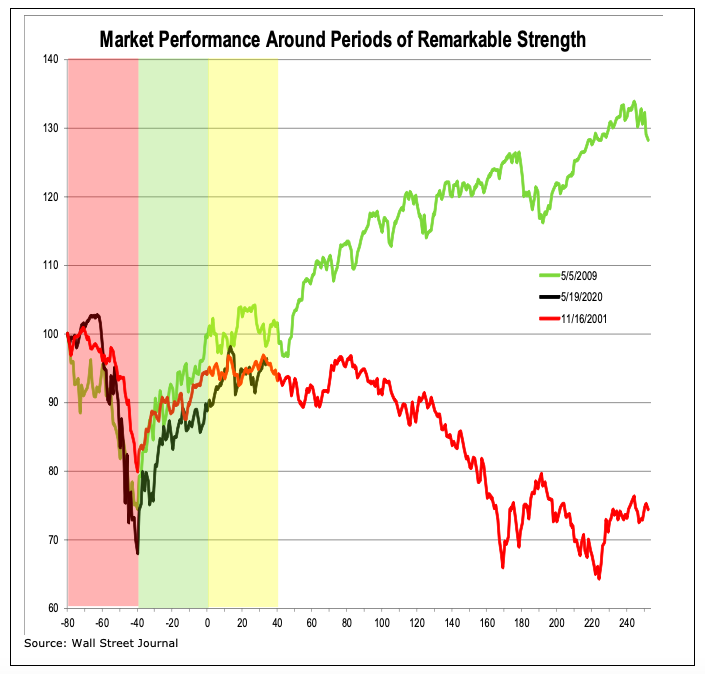
If you’ve been short the market over the course of the last few months and during one of the largest and fastest bear-to-new bull markets in history, it has proven an unkind trade. With the largest monetary and fiscal policy implementations in history and deficit disciplines seemingly thrown out the window, investors have aligned their algorithms to model the 2009 bear-to-new bull market. That analogue for 2020’s market had recently come into question by Willy Delwiche of R.W. Baird. Here is what Delwiche recently offered to clients when discussing the new bull market and analogous trend since the March bottom.
“For the first time ever the S&P 500 was up 20% in a quarter, but still negative on a two-quarter basis (of the 17 previous times that the index had gained 15% or more in a single quarter, only two cases left it in negative territory on a two-quarter basis). Never before have we seen so much strength with so little to show for it. As strong as the 40- day rally off of the March lows was, it failed to overcome the weakness of the preceding 40 days. In this way, 2020 has more in common with the experience of 2001 than it does with 2009 (or many of the other top 40-day rallies in history). In 2009, strength overwhelmed weakness and following consolidation, additional strength was seen. In 2001, strength failed to overwhelm weakness and following consolidation, further weakness emerged. As can be seen in the chart below, we remain in a period of consolidation. But soon these paths diverge and which one the market takes will make all the difference.
In our weekly Research Report for Finom Group subscribers we discussed the concerns noted by Delwiche in his reporting. Our chief concern has been whether or not the S&P 500 would continue along the 2009 path or the falter, and follow the 2001 path lower over time. Given the concerns we decided to do a little digging to discover if the S&P 500 ever truly bottomed in 2001. In order to define a market bottom we looked back at the Williams %R and Average Trading Range (ATR) indicators for 2001.
Williams %R, or just %R, is a technical analysis oscillator showing the current closing price in relation to the high and low of the past N days (for a given N). Its purpose is to tell whether a stock or commodity market is trading near the high or the low, or somewhere in between, of its recent trading range.{\displaystyle \%R={high_{Ndays}-close_{today} \over high_{Ndays}-low_{Ndays}}\times -100}

In Williams’ most recent notes, the technician denotes that the major averages have exacted a 50% retracement from the March 23rd lows. As Williams pointed out, “The history of the last nine bear markets going back to 1972 shows that once we have had a 50% rally, back where we are now in the S&P 500, lows are not re-tested. And a rally less than 50% may give way to a re-test. Anything greater than 50%, we just don’t retest.”
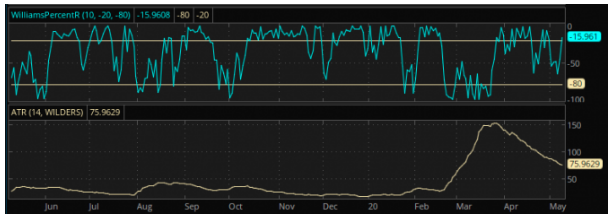
As discussed above, the history of the last 9 bear markets suggests that the 2020 bear market likely bottomed back in March, since we have retraced more than 50% of the decline. In fact, the S&P 500 is almost unchanged on the year. When we look at the 2001 bear market, what we also want to see is the Williams %R and the ATR falling below 80 (W%R) and above 80 (ATR) respectively and around the same time. Such an occurrence took place in 2009 and has taken place in 2020. (Chart from 2020, W%R and ATR)
Moreover, in 2001 we did not see the requisite bottom signal, as identified in the chart analysis below. In 2001, the Williams %R (middle panel, first center circle) dropped below 80, but it did not coincide with the ATR (bottom panel, no circles in 2001) rising above .80.
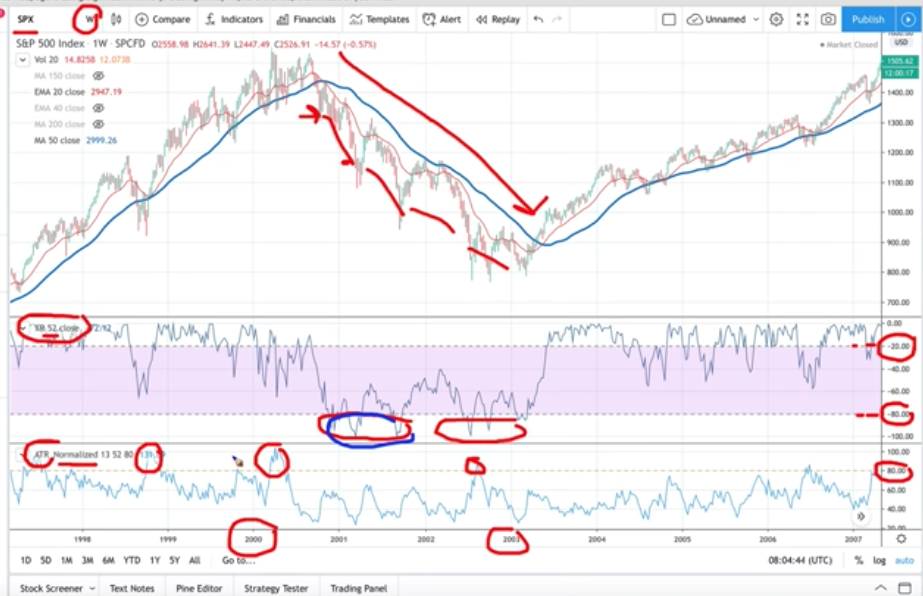
The two indicators did not actually reach the necessary levels simultaneously to indicate a bottom (washout of leverage) until late 2002. The key to this bottom-signal is that is defines a washout of investor positioning or leverage. Generally, without such a washout, there is less cash to put to work as leverage and/or positioning remains in need of a determinant outcome.
When we look at leverage in 2020, we can certainly see that it has also found a washout level, which validates the aforementioned bottom-signal.
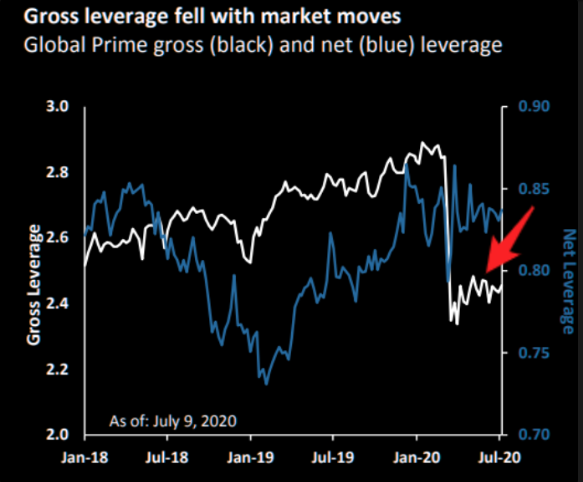
A rebound in leverage has materialized since the March 2020 lows, but investors are still grossly under leveraged what the robust rally might have many assume. And yes, there remains ample cash on the sidelines to put to work should investors develop greater certainty about future earnings and the economy.
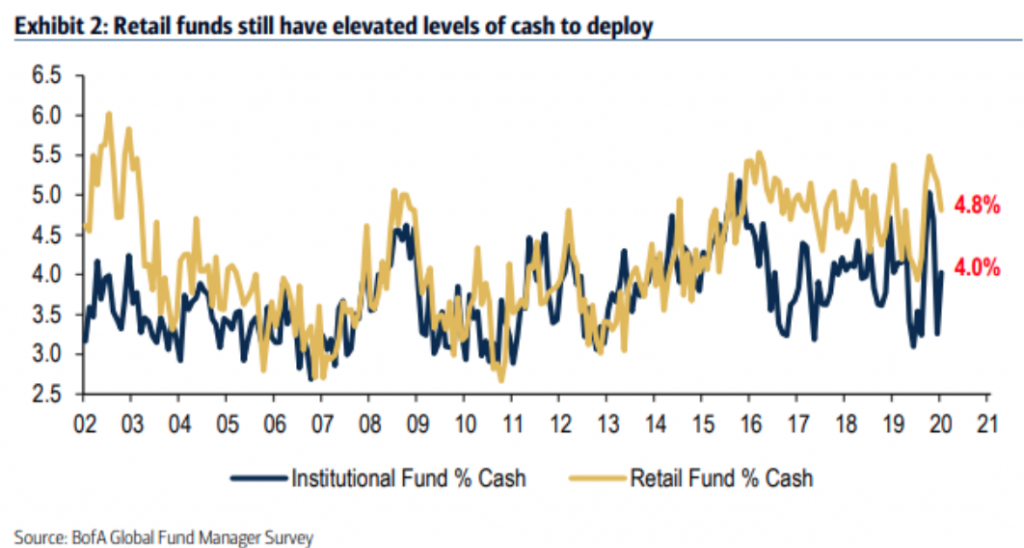
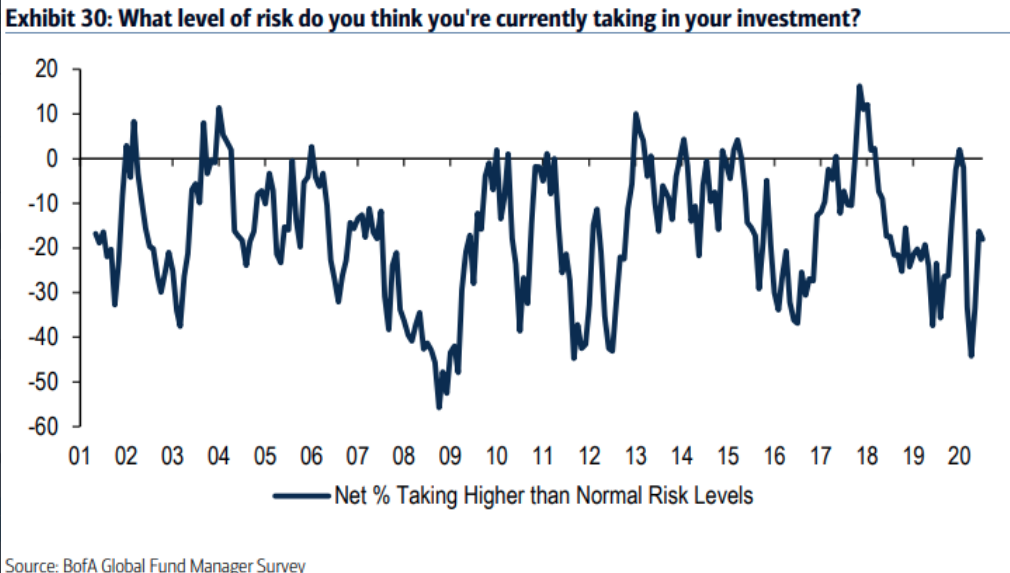
When it comes to looking at investor cash levels and risk appetite or what is influencing risk appetite, the monthly BofA Fund Manager Survey (FMS) helps to identify such metrics. According to the latest FMS “cash levels at institutional funds [rose from] 3.3% to 4%” and cash levels at retail funds is at 4.8 percent.
Moreover, in terms of risk the BofA FMS found that fund managers have lower than average risk exposure on right now. Maybe the overnight Moderna headline will alleviate some fund manager concerns.
Finom Group remains of the opinion that fund managers are eager to put capital to work. They are aware of the absolute finiteness imbedded in the current economic crisis by the pandemic. They are also aware that medical science will produce a remedy near-term. As such, for each dip we find in the market, it has proved short-lived.
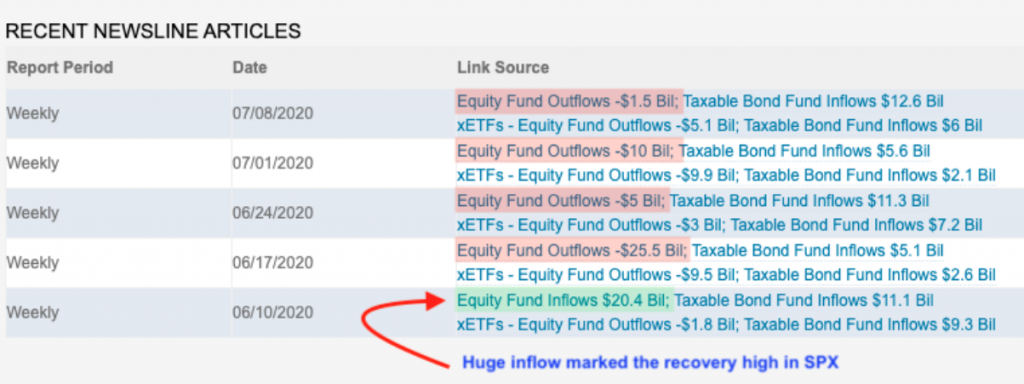
It was just 5 weeks ago that marked the exact recovery high in the S&P 500 and before the higher high produced on Tuesday. To achieve that former high, there was a massive inflow of funds. Every week since then there have been outflows, but they are lessening (from Lipper)
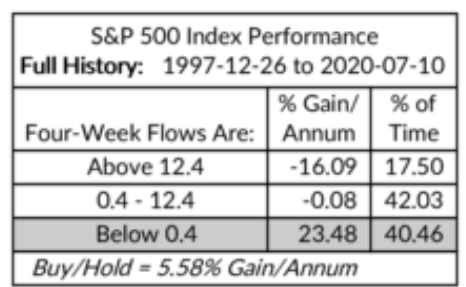
Equity fund (MF+ETF) outflows reached $42 billion over the past 4 weeks. A recent study from Ned Davis Research shows that over the past 20+ years, the S&P 500 has recorded all of its net gains when equity funds have seen outflows (which has been just over 40% of the time). Kind of the canary in the coal mine to follow folks. Outflows have never proven a bearish signal for markets over time.
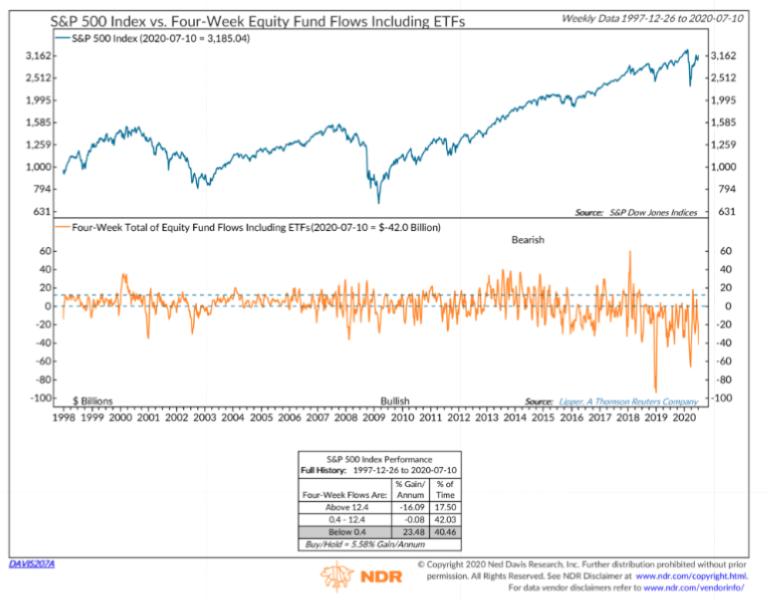
We’ve pulled out the bottom table from the Ned Davis Research study to highlight the historic data for the S&P 500’s performance post Four-Week Flows are this negative.
As we look toward Wednesday’s trading session, the rally of greater than 1% for the major averages on Tuesday is proving to carry forward into Wednesday’s equity futures. The bullish sentiment is a favorable response to the Tuesday headlines concerning Moderna’s COVID-19 vaccine development/trials. The biotech potential vaccine to prevent Covid-19 produced a “robust” immune response, or neutralizing antibodies, in all 45 patients in its early stage human trial, according to newly released data published Tuesday evening in the peer-reviewed New England Journal of Medicine.
“This should further increase confidence that we are getting a robust immune response, in that there should be greater confidence that this will be protective to a degree in transmission of Covid,” Michael Yee, a managing director at Jefferies, said on CNBC’s “Fast Money.” “This is all along our positive thesis and our view that both Moderna and Pfizer-BioNTech are definitely on a good track to get a vaccine by the end of the year.”
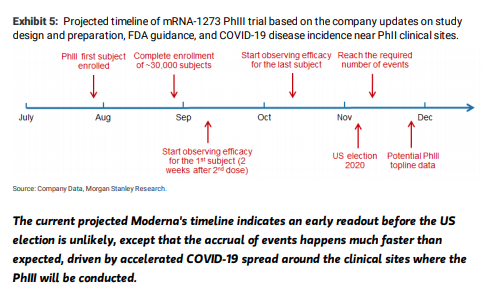
The update from Moderna on its COVID-19 vaccine is in keeping with the timelines and overall analysis produced by Morgan Stanley’s biotechnology analyst Matthew Harrison. Below were his latest analytics on Moderna, pertaining to an expected vaccine delivery:
Projected timelines for the PhIII topline data readout
Moderna
Management has confirmed the initiation of PhIII will be in July. We assume the first patient enrollment happens at the end of the month. We believe the enrollment will be very fast, i.e., it takes ~1 month to screen and enroll all 30,000 subjects, because: (1) there are likely to be many clinical sites – potentially hundreds around the US and Brazil; (2) the targeted subjects will be healthy volunteers,and the inclusion/exclusion criteria should be flexible enough to include most volunteers – just to preclude some age groups, certain health conditions’ predisposition to severe COVID-19 outcomes,and pre-existing infections; (3) the dosing and follow-up are relatively simple and straightforward. We project the start of the efficacy observation period for the first subject in early September (~6 weeks after initial dosing) and start of efficacy observation period for the last subject in early October. The required number of events may be reached with an average efficacy observation window of 1-1.5 months, which is around early November. We thus project the topline data readout to be in mid/late November. This is consistent with Moderna’s CEO statement of possible PhIII results by Thanksgiving.
Beyond the Moderna sentiment boost to equity futures on Wednesday, Mad Money host Jim Cramer went “off the charts” to help define the near-term path of the S&P 500. Cramer also referred to Larry Williams in his latest technical analysis.
“The charts, as interpreted by the legendary Larry Williams, suggest the S&P could climb another 4% or 5% over the next two weeks, but come July 28, he expects the market to start rolling over. Given that the expanded unemployment insurance benefits from Washington expire at the end of the month, well, I wouldn’t be surprised” if he’s right.”
Based on history, Williams concludes that whenever the red line changes direction the market is likely to follow suit.

Williams expects the market could peak near its old highs around July 27 but presumes those levels will be fleeting. Why? More recently Finom Group reported on the S&P 500 A/D line achieving a new cycle high, as indicated in the chart below (top panel).
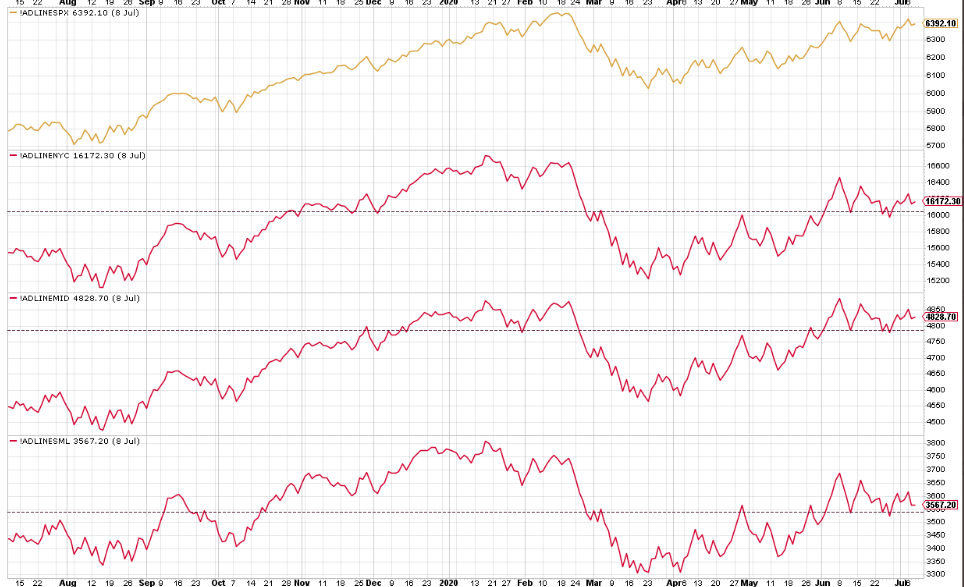
Unfortunately, the same can’t be said for the NYSE A/D line nor the mid and small-cap S&P 500 tier A/D lines. Using the S&P 500 A/D as a measure of market breadth, here is what Larry Williams and Cramer recently discussed:
The advance/decline line is a leading indicator that often peaks weeks before a market sell-off. The line last reached another high recently, meaning the broad index of 500 stocks could be due for a pullback in the near future, said Jim Cramer.
“Williams points out that the advance/decline line tends to peak BEFORE the market sells off. And when the advance/decline line … breaks out, the market tends to follow.”
If history is any guide, Williams, therefore, expects the S&P 500 to make a new high about a month and a half later.”
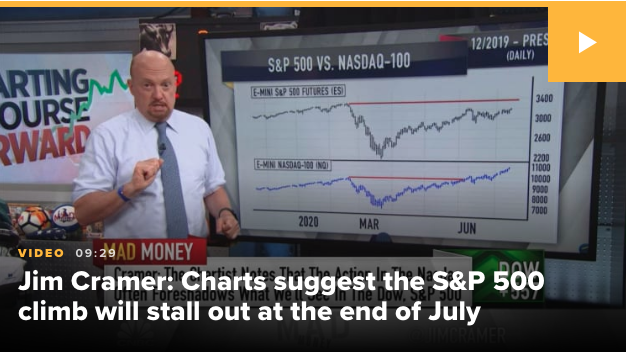
It’s kind of a mixed bag of analysis and commentary between Williams and Cramer. In the near-term, the market is expected to travel higher, up until the final days of July and before pulling back. But the magnitude of a pullback is unknown.
“How hard will stocks get hit if Williams is right that the market will peak in a couple weeks? He says it’s probably too soon to tell,” the host said, “but he does suspect the rollover will hurt, because too many people” are too long on equities.
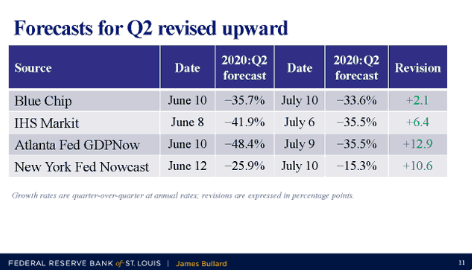
Beyond the charts, the economic data has continued to identify a recovery in the economy, which has been benefiting from outsized fiscal policy. It remains to be seen when the next tranche of relief will be voted by the legislative bodies, but undoubtedly, more will need to be done in order to overcome the pandemic’s recessionary conditions. St. Louis Fed President James Bullard identified the impact on the economy from the pandemic and the recovery process in a webinar on Tuesday.
During his presentation, Bullard noted that macroeconomic news has been stronger than expected in May and June. He also noted that progress in managing the health crisis has been substantial, but COVID-19 has proven to be more persistent than many expected. However, the experience during the second quarter of 2020 suggests that simple risk mitigation measures, including ubiquitous masks, may be used to manage the disease effectively, he added.
“This suggests a base case in which the macroeconomy will continue to build on its momentum from May and June in the second half of 2020,” Bullard said. “The downside risk is nevertheless substantial, and better execution of a granular, risk-based health policy will be critical to keep the economy out of depression.”
“A back-of-the-envelope calculation suggests that there is room for a substantial decline in the official unemployment rate in the months ahead,” Bullard said.
In particular, he noted that if all of the unemployed who have identified as “on temporary layoff” are simply recalled in the next six months and nothing else changes, the official unemployment rate would decline to 4.5%. If this category instead returns to a normal value of 1 million workers and nothing else changes, the official unemployment rate would still decline to 5.1%, he added. “If this type of dynamic occurs in the months ahead, it is likely to be uneven,” he said.
Regarding GDP growth, Bullard pointed out that estimates for the second quarter have been revised upward. “While second-quarter growth is projected to show substantial contraction, forecasts have become less negative in recent weeks,” he said.
The economic data calendar has been light up to this point in the week and market participants are now looking forward to reviewing the latest regional PMI data from the Empire State manufacturing index on Wednesday and the Philly Fed manufacturing index on Thursday. Both have recently demonstrated a V-shape bottom in their respective indexes, but can the trend continue or will it flatten?
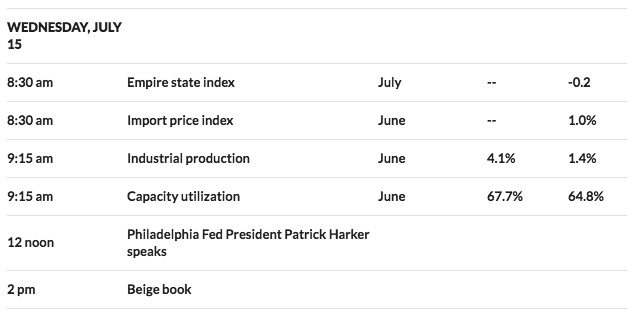
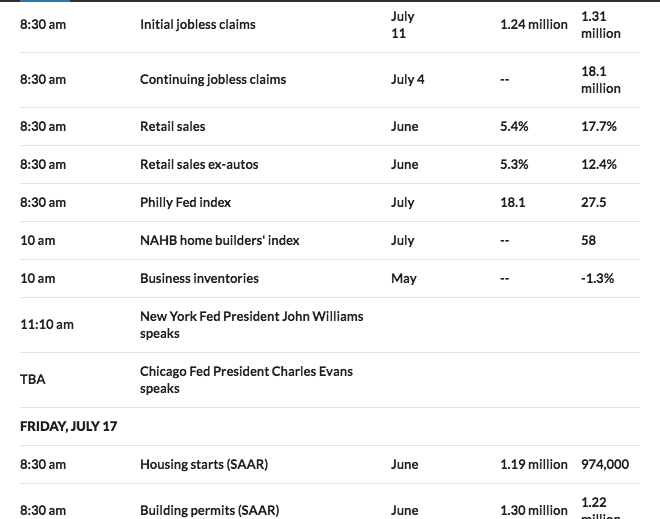
As earnings season carries forward with Goldman Sachs (GS) reported results ahead of the opening bell on Wednesday, investors are also awaiting the latest results from a big tech-titan name in Netflix (NFLX) Thursday afternoon. The back-n-forth action already through the early reporting season, in the S&P 500, has confused a great many investors/traders. Through our weekly Research Report for subscribers, we aim to deliver greater clarity and certainty for investors/traders. Here is what we reported in this past Sunday’s Research Report:
It would appear as though we have found a new, new bull market high folks! Subscribe to our weekly Research Report and State of the Market video and find clarity based on fact-based research.


