
The S&P 500 (SPX) is only about 1.5% away from its all-time high, so everyone must be a winner right? Not exactly! If we look at the historic performance record and positioning in the market, cash levels remain extremely high and equity market leverage. Here is what the quant team at J.P. Morgan had to say recently about equity positioning and the probabilities for the market going forward, given the recent trade de-escalation:
Equity positioning remains light overall, presenting upside risk for the market if trade headlines today are positive, but positioning was volatile recently as the market bounced around important technical levels. The S&P 500 crossed the 50d and 100d moving averages four times (two round-trips) over the past 2 weeks, causing CTAs to whipsaw positions. Although some of the initial drivers of the market moves were fundamental in nature (e.g., in response to weak macro data, such as last week’s ISM figures), the shift in CTA positions and impact of dealers hedging short gamma exposure resulted in exaggerated price moves as the market crossed through these technical levels. This likely explains why these overshoots subsequently and relatively quickly mean-reverted. Below we review where recent moves have left us in terms of systematic and discretionary investor positioning.
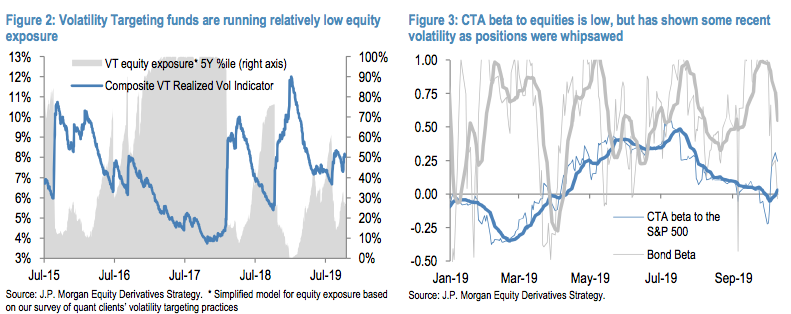
Volatility Targeting portfolios likely de-levered modestly in the past couple of weeks (from already relatively low exposure levels) as volatility picked up, with their equity exposure now estimated to be in the ~25th percentile relative to the past 5 years. Figure 2 shows a composite indicator for the measure of realized volatility tracked by US equity volatility targeting portfolios and our estimated percentile of equity exposure for VT funds, based on our survey of quant clients’ volatility targeting practices1.
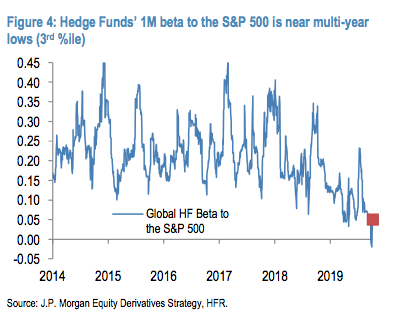
CTAs’ equity exposure appears low based on their trailing short-term beta, but as discussed above positions have likely been whipsawed in the S&P 500 recently as the index crossed through various momentum signals. Early last week nearly all S&P 500 momentum signals turned negative (from all positive), only for this to reverse again by the end of the week. At the moment, short-term signals (1M and 3M momentum) are negative and would flip positive (spurring CTA buying) if the market rallied to ~3000, while longer-term signals (6M & 12M momentum) are positive, but could spur CTA selling if the market fell to ~2875-2900, and another wave below ~2775-2800. Meanwhile, signals on the Russell 2000, EM and crude oil are negative and could present upside risks in case of an improvement in momentum for these markets.
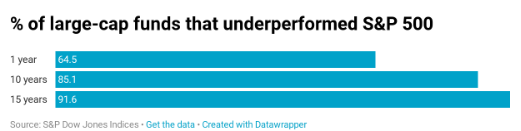
Hedge Funds’ market beta remains near multi-year lows and in its 3rd %ile relative to the past 5Y of history based on the HFRX global index, and recently turned slightly negative for the first time ever (Figure 4). Long-short Hedge Funds’ net beta is similarly low, in its 5th %ile.
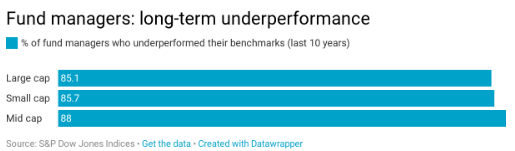
It seems as though these groupings of market participants (institutional players) aren’t necessarily believers in the market’s YTD rally. So what do hedge funds know that maybe the everyday investor/trader managing their own portfolio don’t know? Turns out, very little if anything, given that these hedge fund managers almost always underperform the market. It’s been yet another year of fund manager underperformance. Last week, S&P Dow Jones Indices released its annual report on how actively managed funds performed against their benchmarks. The conclusion is that active managers continue to show dismal performance against their passive benchmarks. For the ninth consecutive year, the majority (64.49%) of large-cap funds lagged the S&P 500 last year.
This is not a one-year phenomenon. S&P has been doing this study for 16 years, and the long-term results only strengthen the claims for index investing. Indeed, while a fund manager may outperform for a year or two, the outperformance does not persist. After 10 years, 85% of large cap funds underperformed the S&P 500, and after 15 years, nearly 92% are trailing the index.
How these institutional players perform going forward remains to be seen, especially with so much uncertainty surrounding both the markets and the economy. With this in mind, we repeat, the S&P 500 is closing in on it’s all-time highs yet again. Chris Verrone of Strategas Research Partners discussed 3 key stocks that he believes will drive the market higher near-term and through earnings season on CNBC’s Fast Money.
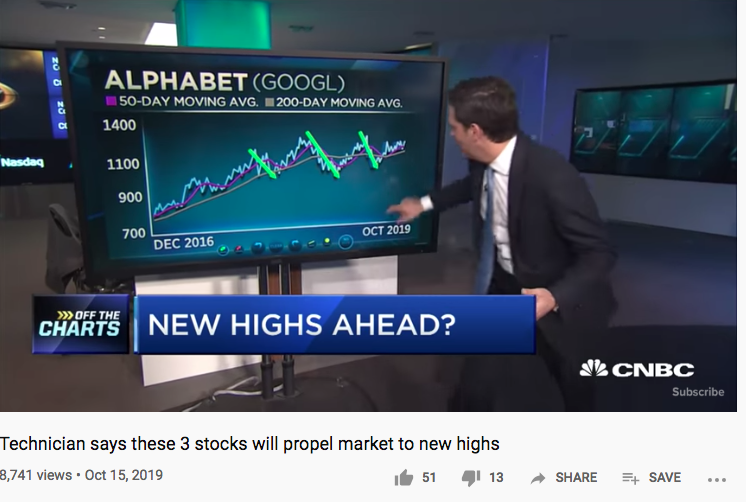
Verone looks at the charts of J.P. Morgan (JPM), Alphabet (GOOGL) and Deere (DE) to prop up his S&P 500-new highs thesis. With each stock evaluation, Verone denotes their technical moving averages are upward sloping and indicative of consolidation periods before a near-term breakout. The impetus for the breakout, he implies could be earnings results. So nothing geopolitical to see here folks, just technicals and fundamentals. But speaking of the S&P 500 and technicals…
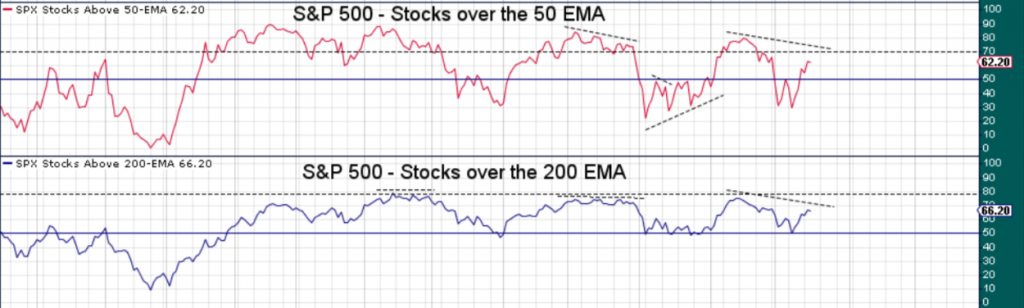
When looking at the number of stocks trading above both their 200 and 50-EMA, it looks like their may indeed be more room to trek higher in the benchmark index. During the current S&P 500 rally, the VIX has also come under severe pressure. The moves in both indexes of late have opened up gaps in their respective charts. As the saying goes, “all gaps get filled”. This isn’t a 100% truism of the market, but it’s closer to 100% than it is 50% and as such, most gaps in the indexes do indeed get filled at some point.
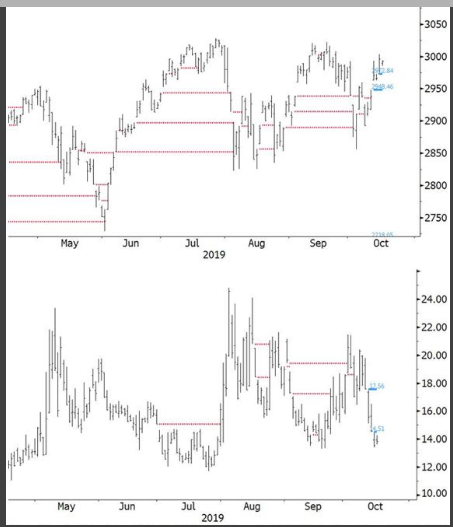
It’s with this in mind that Carter Worth offers he’s go-forward analysis on the indexes noted. The Cornerstone Macro technician frequently featured on CNBC’s Fast Money show thinks the two daily gaps in the SPX and two daily gaps in the VIX are likely to be filled soon. Naturally, the filling of these gaps would result in the S&P 500 moving lower and the VIX moving higher. Unfortunately for Carter Worth’s YTD and openly bearish analysis, it has been defied by the market on all accounts.
While the technicals point toward further gains ahead, earnings will likely prove the driving force for the market during this typically strong seasonal period. And speaking of earnings, they continue to come in better than expected.
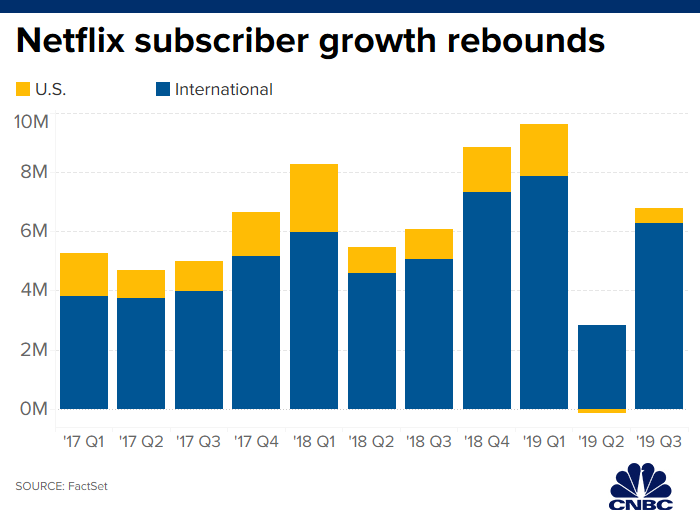
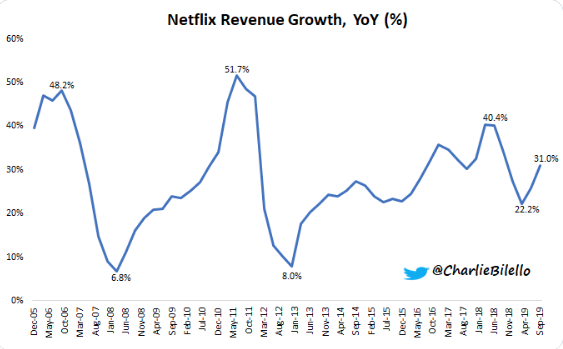
Netflix Inc. (NFLX) shares are poised to open sharply higher Wednesday, on it’s better than anticipated earnings growth, issued in the previous night. The company reported mixed results, with an earnings beat and a miss on domestic subscriber adds, while revenue slightly missed analysts’ expectations.
Here are the results vs. expectations:
- Earnings per share: $1.47 vs. $1.04 expected, per Refinitiv estimates
- Revenue: $5.24 billion vs. $5.25 billion expected, per Refintiv
- Domestic paid subscriber additions: 517,000 vs. 802,000 expected, per FactSet estimates
- International paid subscriber additions: 6.26 million vs.6.05 million expected, per FactSet
For the fourth quarter, Netflix expects to report earnings of 51 cents per share on revenue of $5.4 billion. The company is projecting 7.6 million global net adds for the fourth quarter, compared to 8.8 million in the same quarter one year earlier.
Netflix previously forecast paid net adds would increase year over year, but it’s now adjusting estimates to reflect an increased difficulty to project its future content slate, “minor elevated churn” due to pricing changes and increasing competition.
In its letter to shareholders, Netflix addressed the onslaught of new streaming services that are set to arrive later this year, including Disney’s Disney+ and Apple’s Apple TV+, as well as NBCUniversal’s Peacock and WarnerMedia’s HBO Max. The company warned the launch of these new services will be “noisy” and it could generate “modest headwinds” in the near term.
“Many are focused on the ‘streaming wars,’ but we’ve been competing with streamers (Amazon, YouTube, Hulu) as well as linear TV for over a decade,” the company said. “The upcoming arrival of services like Disney+, Apple TV+, HBO Max, and Peacock is increased competition, but we are all small compared to linear TV. While the new competitors have some great titles (especially catalog titles), none have the variety, diversity and quality of new original programming that we are producing around the world.”
While it may prove easy to downplay the strong earnings beat from Netflix in the Q3 period, due to the slight revenue miss, revenues still grew substantially on a YoY basis (31%).
For the remainder of the week, investors will look forward to quarterly reports from the following:
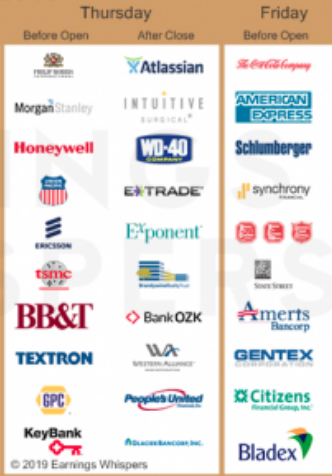
While more big money center and regional banks will report Thursday, investors will find the likes of American Express (AXP) and Coca-Cola (KO) rounding out a jam-packed earnings week. Next week, earnings season heats up with the tech sector reporting season coming into focus.
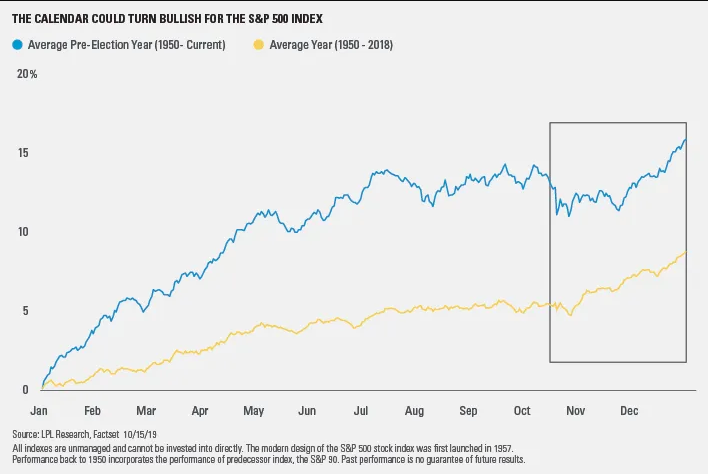
Finom Group has mentioned the seasonal factors currently at play in the market. We are entering the best 6 months to own equities AND, AND the S&P 500 Index has been lower in October during a pre-election year only once since 1987. Additionally, over the past 20 years, October has been the third-best month on average for the S&P 500.
“The calendar could be about to turn into a bull’s best friend, as late October has been when stocks historically started their end-of-year rally,” explained LPL Financial Senior Market Strategist Ryan Detrick. “No two years are ever the same, and we all remember last year’s sell-off. However, a better than expected earnings season, coupled with positive steps on trade and one more Federal Reserve rate cut this year could allow bulls to smile the rest of 2019.”
Another fun fact: The S&P 500’s dividend yield is above the 10 year Treasury yield right now. The 40 other months this happened from 1970-present, the S&P 500 was up 95% of the time 1 year later. Despite seasonality and the equity risk premium proving extremely high with the 10-year yield at very low levels, investor cash levels remain extremely high.
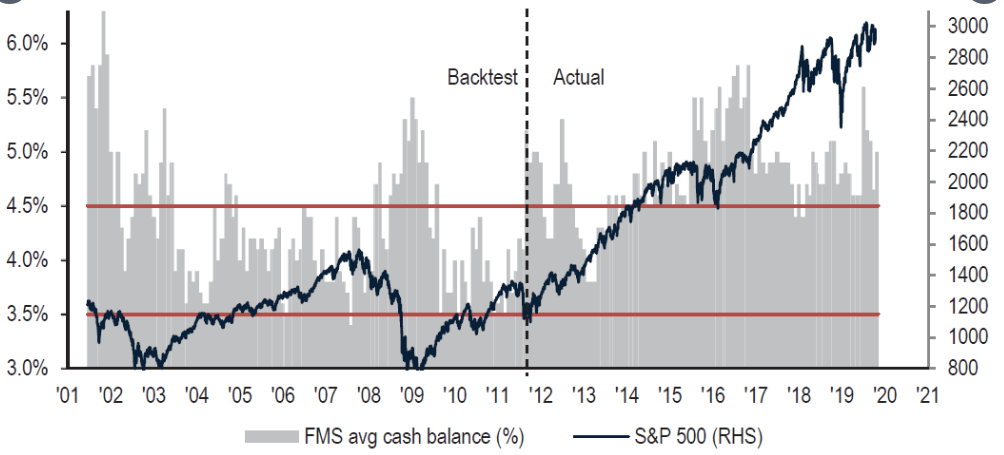
Maybe investors continue to be swayed toward a heavy cash position due to the protracted U.S./China trade war? Of course this is sarcasm as we’ve seen how heavily the trade issues weigh on investors and investor sentiment. But it’s not just investors that have expressed trade war concerns. The International Monetary Fund has recently lowered its global growth forecast, mainly on concerns over the trade war.
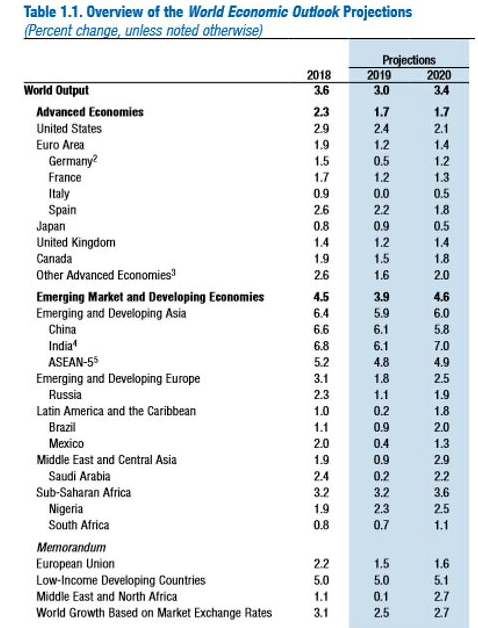
The U.S.-China trade war will cut 2019 global growth to its slowest pace since the 2008-2009 financial crisis, the International Monetary Fund warned, adding that the outlook could darken considerably if trade tensions remain unresolved.
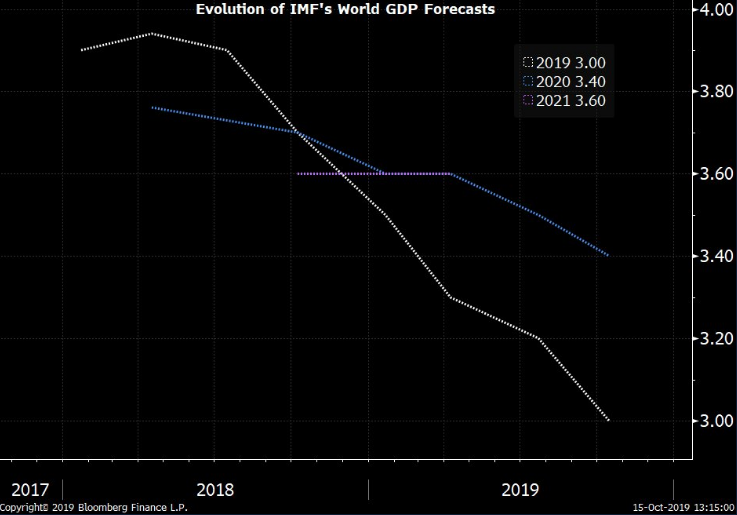
The IMF said its latest World Economic Outlook projections show 2019 GDP growth at 3.0%, down from 3.2% in a July forecast, largely due to increasing fallout from global trade friction. The IMF said that by 2020, announced tariffs would reduce global economic output by 0.8%. Georgieva said last week that this translates to a loss of $700 billion, or the equivalent of making Switzerland’s economy disappear.
“The weakness in growth is driven by a sharp deterioration in manufacturing activity and global trade, with higher tariffs and prolonged trade policy uncertainty damaging investment and demand for capital goods,” IMF Chief Economist Gita Gopinath said in a statement.
New IMF projections show China’s GDP output falling 2% in the near term under the current tariff scenario and 1% in the long term, while U.S. output would decline 0.6% over both time spans.
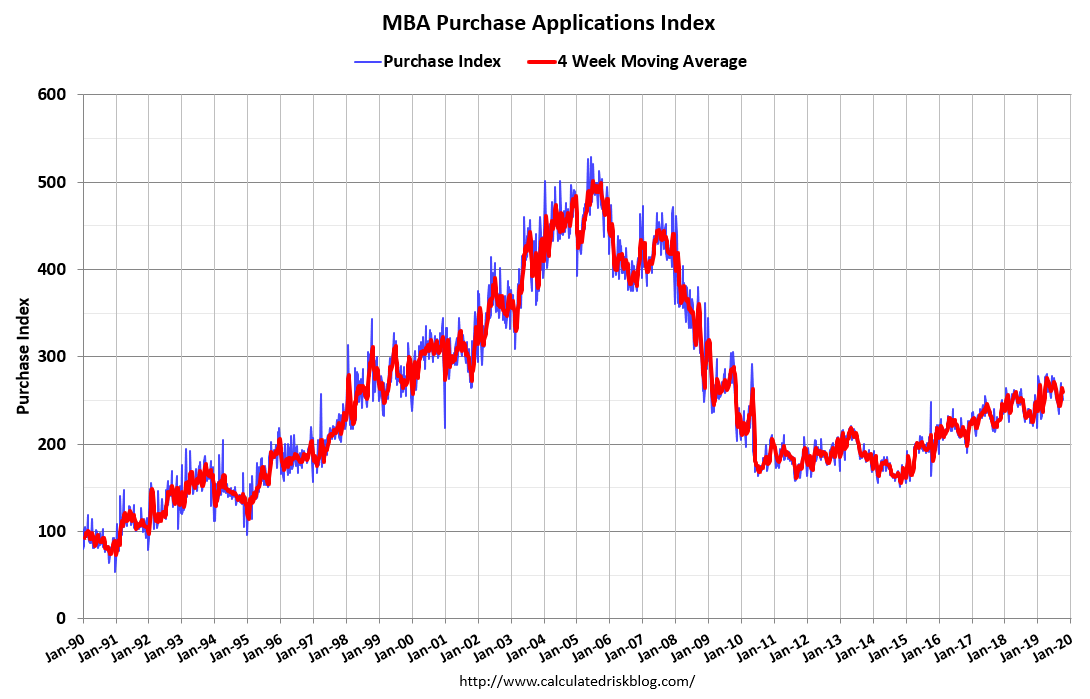
Given the weakening outlook for global and domestic growth, it’s probably a good idea for investors to maintain a watchful eye on the economic data delivered throughout the trading week. With that in mind, the latest economic data from the U.S. proved a mixed bag on Wednesday. Mortgage application data continues to prove robust.
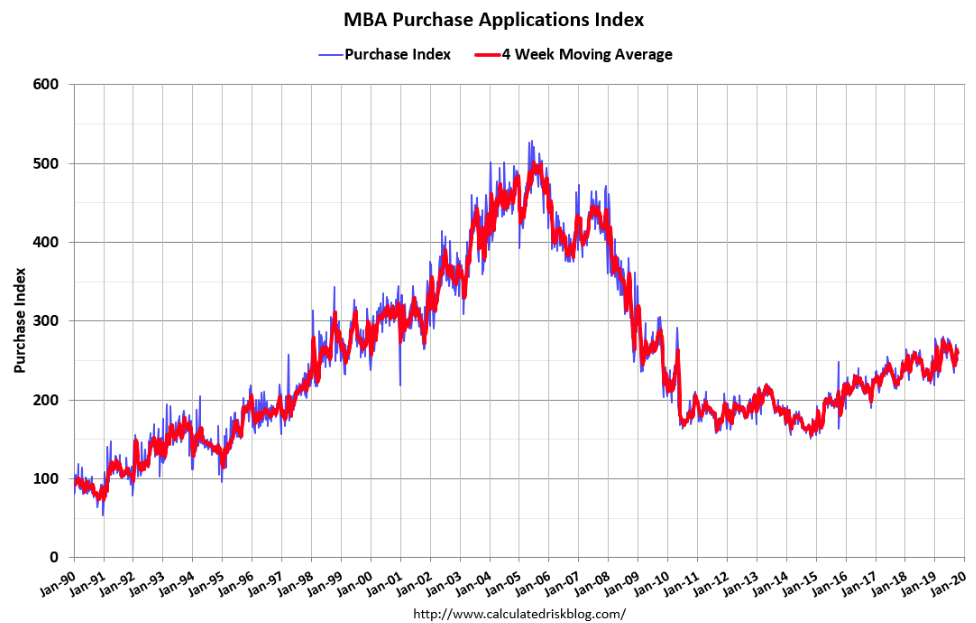
Mortgage applications increased 0.5% from one week earlier, according to data from the Mortgage Bankers Association’s (MBA) Weekly Mortgage Applications Survey for the week ending October 11, 2019.
The Refinance Index increased 4% from the previous week and was 199% higher than the same week one year ago. The seasonally adjusted Purchase Index decreased 4% from one week earlier. The unadjusted Purchase Index decreased 4% compared with the previous week and was 12% higher than the same week one year ago.
The continued strength in the mortgage market was confirmed in the latest National Association of Home Builders survey.
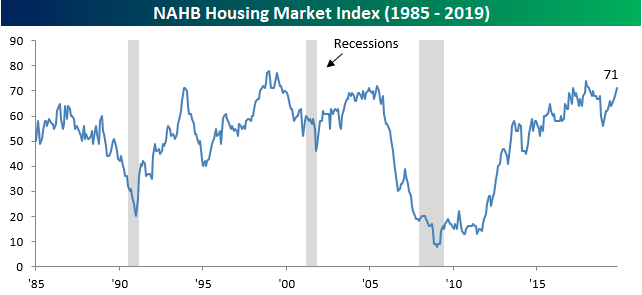
If you’ve heard the slogan from UPS, “What can brown do for you”… It’s clear from the trend in mortgage applications that lower fixed rate mortgage can turn the tide in the housing sector. Homebuilder sentiment came in significantly better than expected in October rising from 68 up to 71 compared to expectations for the index to remain unchanged at 68. With October’s gain, overall sentiment is currently at its best level since February 2018. Also notable is the fact that over the last ten months, the NAHB Homebuilder Sentiment iNdex is up 15 points. That’s the strongest ten-month rate of change in more than six years. With homebuilder sentiment so strong, it’s hard to imagine that the economy is on the cusp of a downturn.
There remains more housing sector data on the docket this week with Building Starts and Permits due to be released on Thursday. But before the latest Starts and Permits data comes out, we can’t help but to revisit Wednesday’s release of the September retail sales.
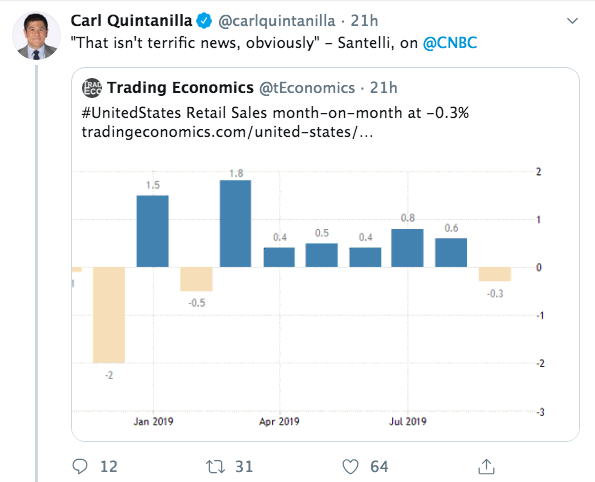
As the tweet from Carl Quintanilla suggests, September monthly retail sales fell unexpectedly, or we should rather say they fell against economists expectations for rising roughly .2 percent. Finom Group’s expectations were far more subdued than the economists’ expectations as we mentioned previously:
“In terms of seasonality, Finom Group wouldn’t be surprised to see the upcoming release of monthly retail sales indicate some cooling. September is typically a throw-away month as it represents a seasonal gap between the former back-to-school shopping season and the Halloween-Black Friday shopping season. Consumers are typically in saving mode during September and ahead of the holiday shopping season, whereby seasonal product doesn’t typically hit shelves until the tail end of the month.
As mentioned previously, Finom Group is not expecting a significant boost in MoM retail sales for September. A lot of retail sales strength from the spring and through the summer might demand of some slowing in the September period and as consumers pay down some degree of debt. Additionally, ahead of the holiday season we would not be surprised to see greater savings during the September period. Having said that, we do expect YoY retail sales growth to maintain above 3 percent, a slow down from the previous annualized run rate but healthy nonetheless.”
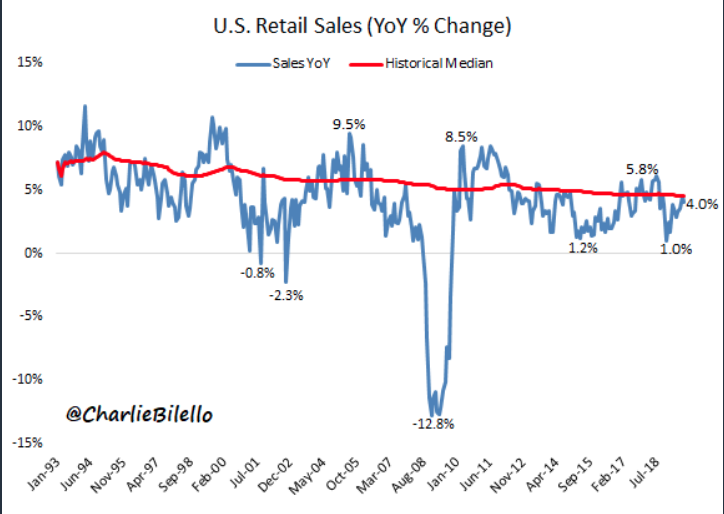
As noted just above and in our previous reporting, Finom Group had subdued expectations for the latest round of MoM retail sales, but we did expect YoY retail sales growth to remain strong. That is exactly what the Census Bureau reported, a decline of -.3% for MoM retail sales while YoY sales continued to grow 4.1%, matching the prior monthly report.
In addition to the latest September reporting, August retail sales were revised higher by .2% from +.4% to +.6 percent. Finom Group is of the opinion the data capture can skew from month-to-month, and resulted in some of the September weakness, but the reality is that September typically sees a drop off.
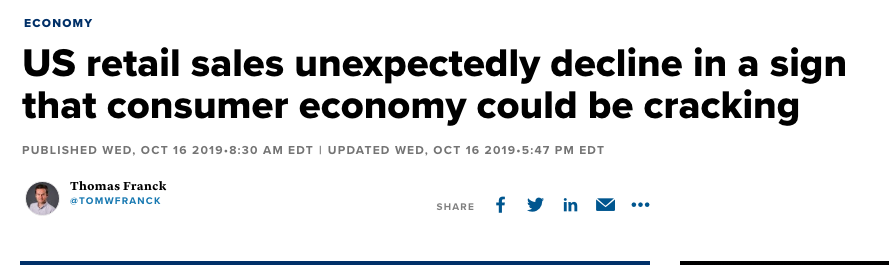
While the media lay claims to a weak retail sales report that may be screaming for even weaker economic growth, Finom Group believes the report was rather strong in the face of many macro-headwinds. The consumer, simply put, has remained the pillar of strength it has been throughout the year.
With regards to September retail sales proving the worst in some 6 months, rather than this suggesting to be ominous, it shows the YTD strength in retail sales. In fact, back in August 2018 we had the worst print in over a year. The same can be said for May 2017 and Jan 2016. Being the “worst-print-in-six months” is not an especially useful benchmark on a series like monthly retail sales. And recall our statement on the “typical drop off in September” retail sales…
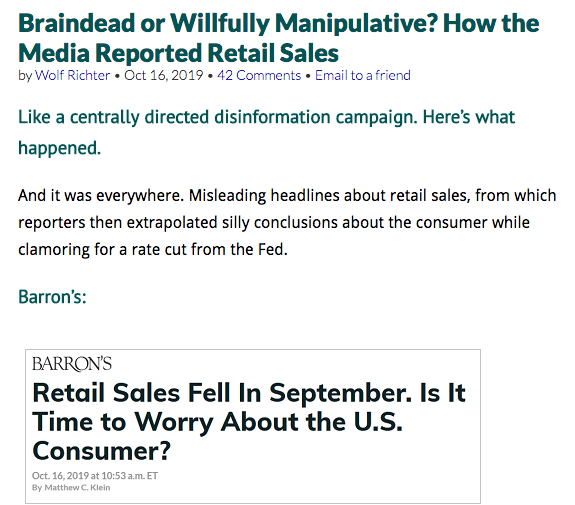
It’s rather amazing how the media portrays certain economic data isn’t it? But don’t let the MoM results fool you folks, retail sales grew more than 4%, again, in the month of September. Moreover, take a look at past Septembers. Remember firstly, retail sales are very seasonal. And September sales, which always follow the back-to-school burst in August as well as July’s Prime Day events, always drop sharply from August, every year. So, here are the not-seasonally adjusted retail sales in billions of dollars. Marked are the last six Septembers with red dots from Wolfstreet.com:
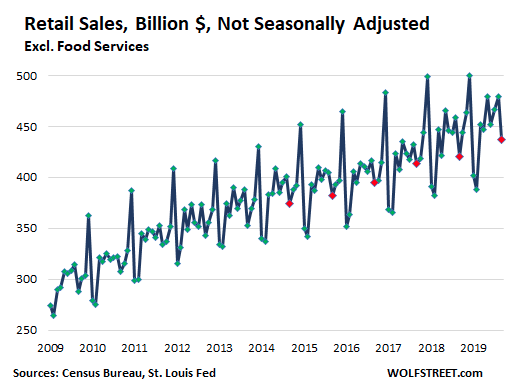
Not seasonally adjusted, retail sales in September fell 8.9% from August. Last year at this time, they fell 8.3%. In 2017, they fell 4.5%, in 2016, 5.4%. But in 2013, they fell 9.2%. And what else happened this past September to roil retail sales?
Besides gasoline prices being down roughly $.10 a gallon at the pump in September from August, the calendar had a big effect on Septembers total retail sales. This year, Labor Day fell on September 2, and August 31 was a Saturday, which for accounting purposes in many industries pulled Labor Day sales into August. This includes auto dealers which closed their books on the first working day after the weekend, which was Tuesday, September 3. Those sales showed up in August and not in September. This is not unusual. It happened in 2013, as well, when Labor Day Monday fell on September 2, and August books were closed on September 3, pulling all those sales into August. Hence the 9.2% drop from August to September 2013. In quarterly reporting, this noise disappears.
Again folks, don’t let the media headlines fool you, September retail sales were indeed strong and found with an upward revision to the August retail sales print. And with much of the economic data out of the way…
We seem to have a positive Brexit headline moving markets higher before the opening bell on Wall Street.

We’ll have to wait and see if this new Brexit deal has actual legs and results in signed treaties/documents, but for now, the sentiment is showing up in global equities and equity futures. Additionally, the British Pound is on the rise while the U.S. Dollar index comes under pressure, falling below $98. A weaker USD will be a welcome sight for S&P 500 multinational companies. Some 50% of S&P 500 revenues are derived overseas and are found negatively impacted by the foreign currency exchange rates.


