
After a 253-point jump on the Dow Jones Industrial Average in yesterday’s trade, Dow Futures are pointing to another 250-point jump at the open. The major averages have and continue to build on the momentum from last week’s rebound even as some of the latest economic data has come in worse than expected. Retail sales for December 2017 were revised to unchanged while the January figure found retail sales falling .3 percent. Inflation showed a higher tick through the CPI data released yesterday as well and resulted in the 10-year Treasury yield climbing above 2.93% where it presently rests.
We have a host of economic data out today. At 8:30 a.m. ET, jobless claims, price producer index (PPI) data, the Empire State manufacturing survey and Philadelphia Fed Manufacturing Business Outlook Survey are all scheduled to be released. After that, industrial production is due out at 9:15 a.m. ET, followed by the NAHB/Wells Fargo Housing Market Index at 10 a.m. ET.
We’re starting to get some of the investment insights made by the largest hedge funds through their required quarterly filings with the U.S. Securities and Exchange Commission. David Tepper’s Appaloosa Management took stakes in T-Mobile, while cutting back on its investment in Southwest Airlines. Appaloosa also increased its stake in Apple by 3.2 million shares to nearly 4.6 million shares and raised its holdings in Bank of America by 10.8 million shares to 17.15 million shares. The hedge fund bought about 10.45 million shares of semiconductor manufacturer Micron Technology to bring the total stake to 27.5 million shares.
Dan Loeb’s Third Point took a 2 million share stake in Netflix in the fourth quarter of last year, according to a filing released Wednesday. Loeb’s fund returned 18.1% last year.
Warren Buffett’s has increased its stake in Apple and disposed of almost its entire IBM stake. George Soros’ investment fund bought stock in Overstock.com. Soros’ fund sold all holdings in Amazon that it owned. It dumped 109,451 shares of Facebook, which were worth $19.3 million at the end of the December quarter. In the 3rd quarter of 2017, Soros’ fund sold 367,262 Facebook shares. Soros’ fund bought 1,600 shares of Google parent Alphabet in the three months to December. The fund’s total holding is a small 4,600 shares. Other notable moves from Soros in the December quarter included buying 141,800 shares of Snap, 71,500 shares of Netflix and 15,700 shares of Twitter.
With stocks rallying the market has once again found a state of homeostasis whereby the VIX is once again below 20 and below its historic mean average. How long that will last remains to be seen, but in yesterday’s trading session the VIX gave up some 20% to dip below 20. The plunge in the VIX has continued thus far today with the fear gauge giving up another 3.3% to 18.62 presently.
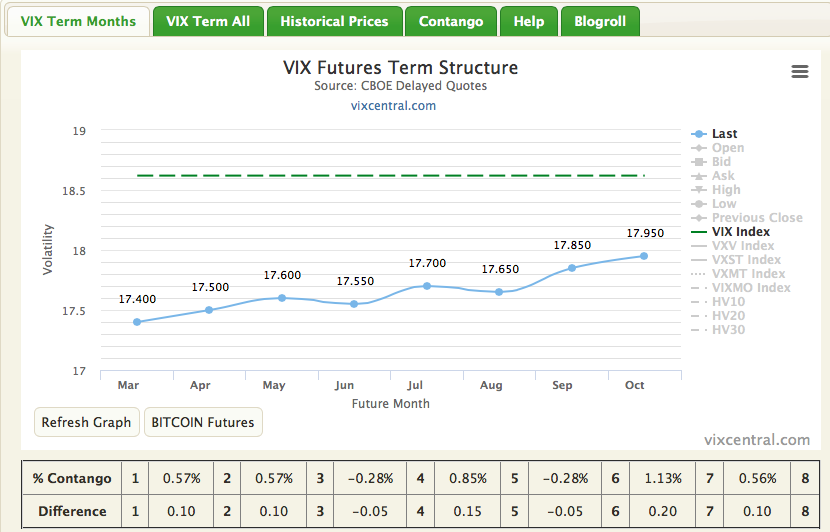
As depicted in the chart above, much of the VIX futures contracts gave up their backwardation status in favor of minimal contango. This occurring as m1 VIX futures expired in yesterday’s trade.
“I think under 20 is a better scenario for the market. It’s options expiration week this week, so there’s a lot of noise with this drop in the VIX, which is spilling over into this rise in the equity market today,” said Peter Boockvar, chief investment strategist at Bleakley Financial Group. “The market’s celebrating like there’s something good about higher inflation and interest rates. I think a lot of the trading is on the expirations.”
Boockvar said he doesn’t expect the VIX to stay below 20. “I think with this rise in rates I don’t really expect it to.
“Whilst the market is showing signs of carving out a bottom, and the volatility index VIX, -3.27%or fear gauge has dropped back below 20, after peaking at over 50 just last week, it is unlikely that this is the last we have seen of the volatility,” said Jasper Lawler, head of research at London Capital Group, in a note on Thursday.
I’m not of the opinion that the recent market rally and subsequent plunge in the VIX are sustainable as daily market swings of 1-2% are symptomatic of fear. It’s either fear of missing out or fear of inflationary risks that has been driving the market swings and until these aspects of market consideration find resolution, investors should tread carefully. Additionally, in a somewhat algorithmic or technically driven market, a sharp shift in the opposite direction could be just around the corner.
Edward Cordoba of Finom Group recently identified the technical bottom in the following chart and analysis last week:
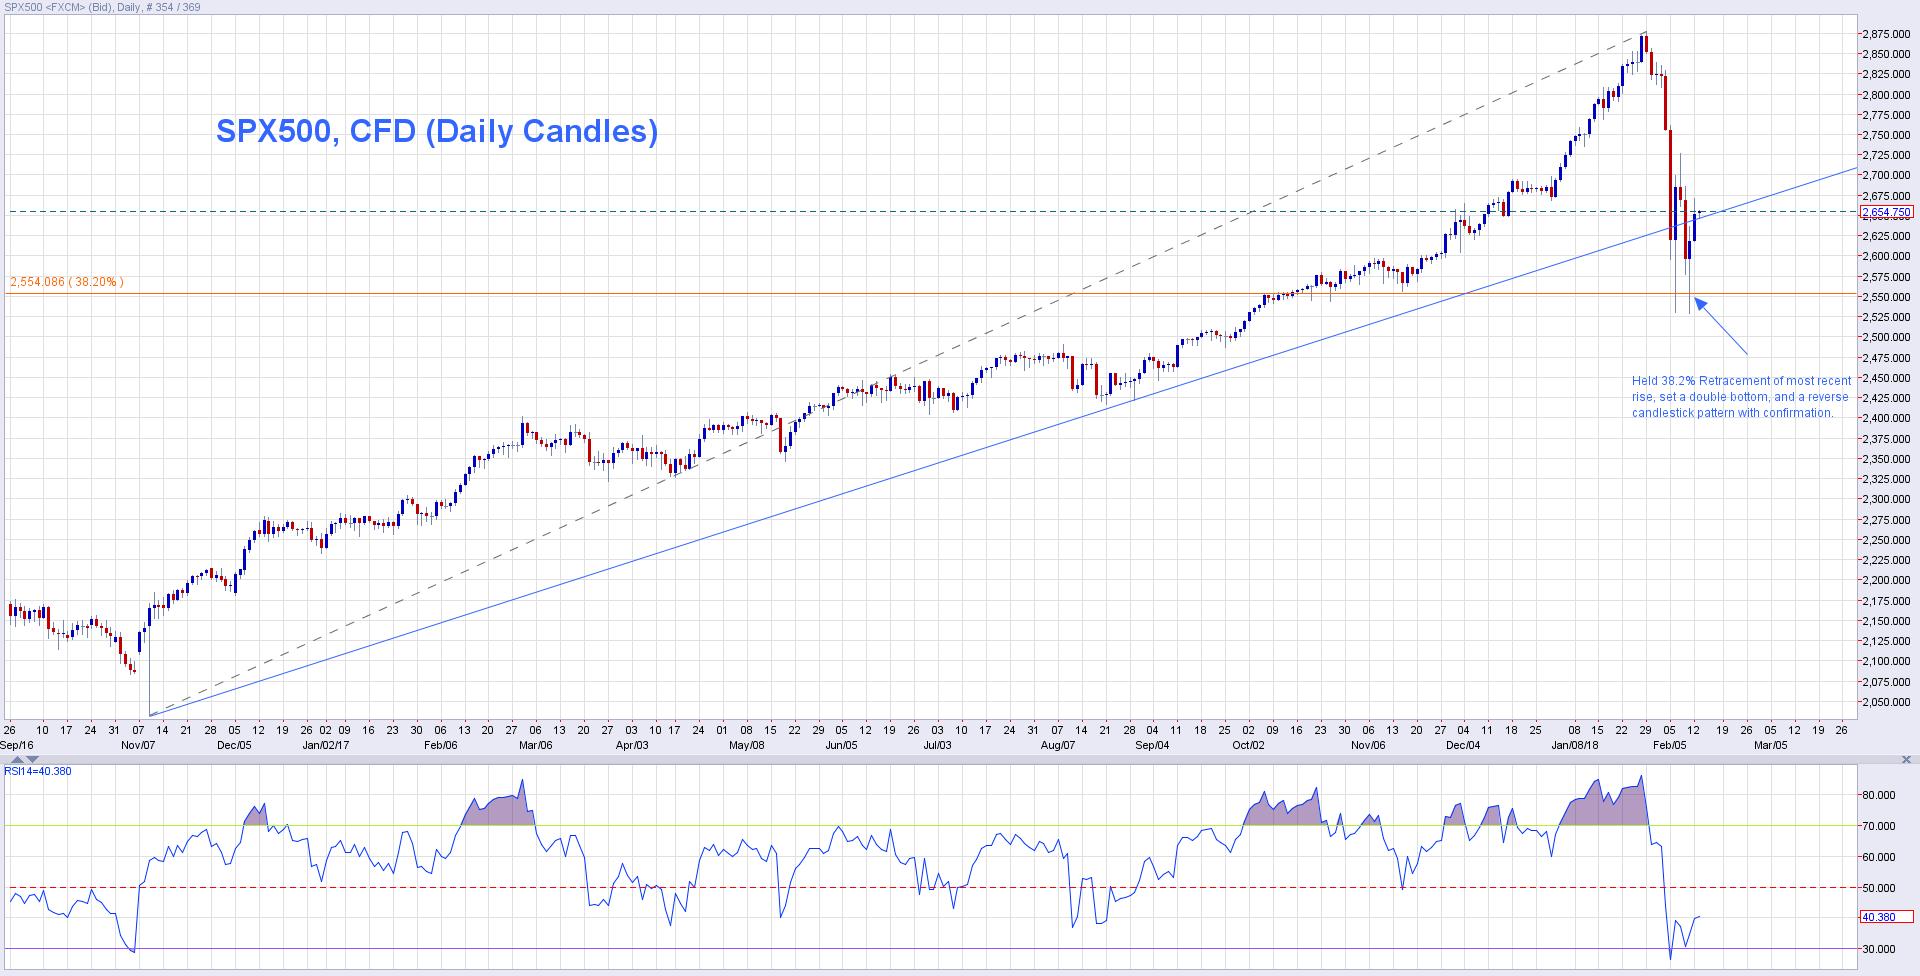
“As we enter the corrective phase of the market moves, we seek the guidance of technical analysis to provide us with some insight on possible market moves for the upcoming sessions. Above you will find a Daily Candle chart of the S&P 500 Contracts for Difference, which tracks the SPX. One important thing to note is the break of the trendline originating from the Nov 2016 & Aug 2017 lows. Today’s daily close well below the rising trendline lends to further downside in the coming sessions. In previous sessions price managed to come to test a key support zone, the 38.2% retracement levels of the rally that started in 2016 at around 2500-2600. The support level held with prices coming back above the trendline, but today the strong affirmative close indicates that a retest of those levels are very likely. The next strong support level is the 2450-60 range, which falls in line with the rally from the Feb 2016 lows and the previous price trading range that occurred between July and August of 2017.”
Cordoba followed up with this analysis that did indeed find the SPX bottoming around 2,537 last week before rallying sharply, and up through yesterday.
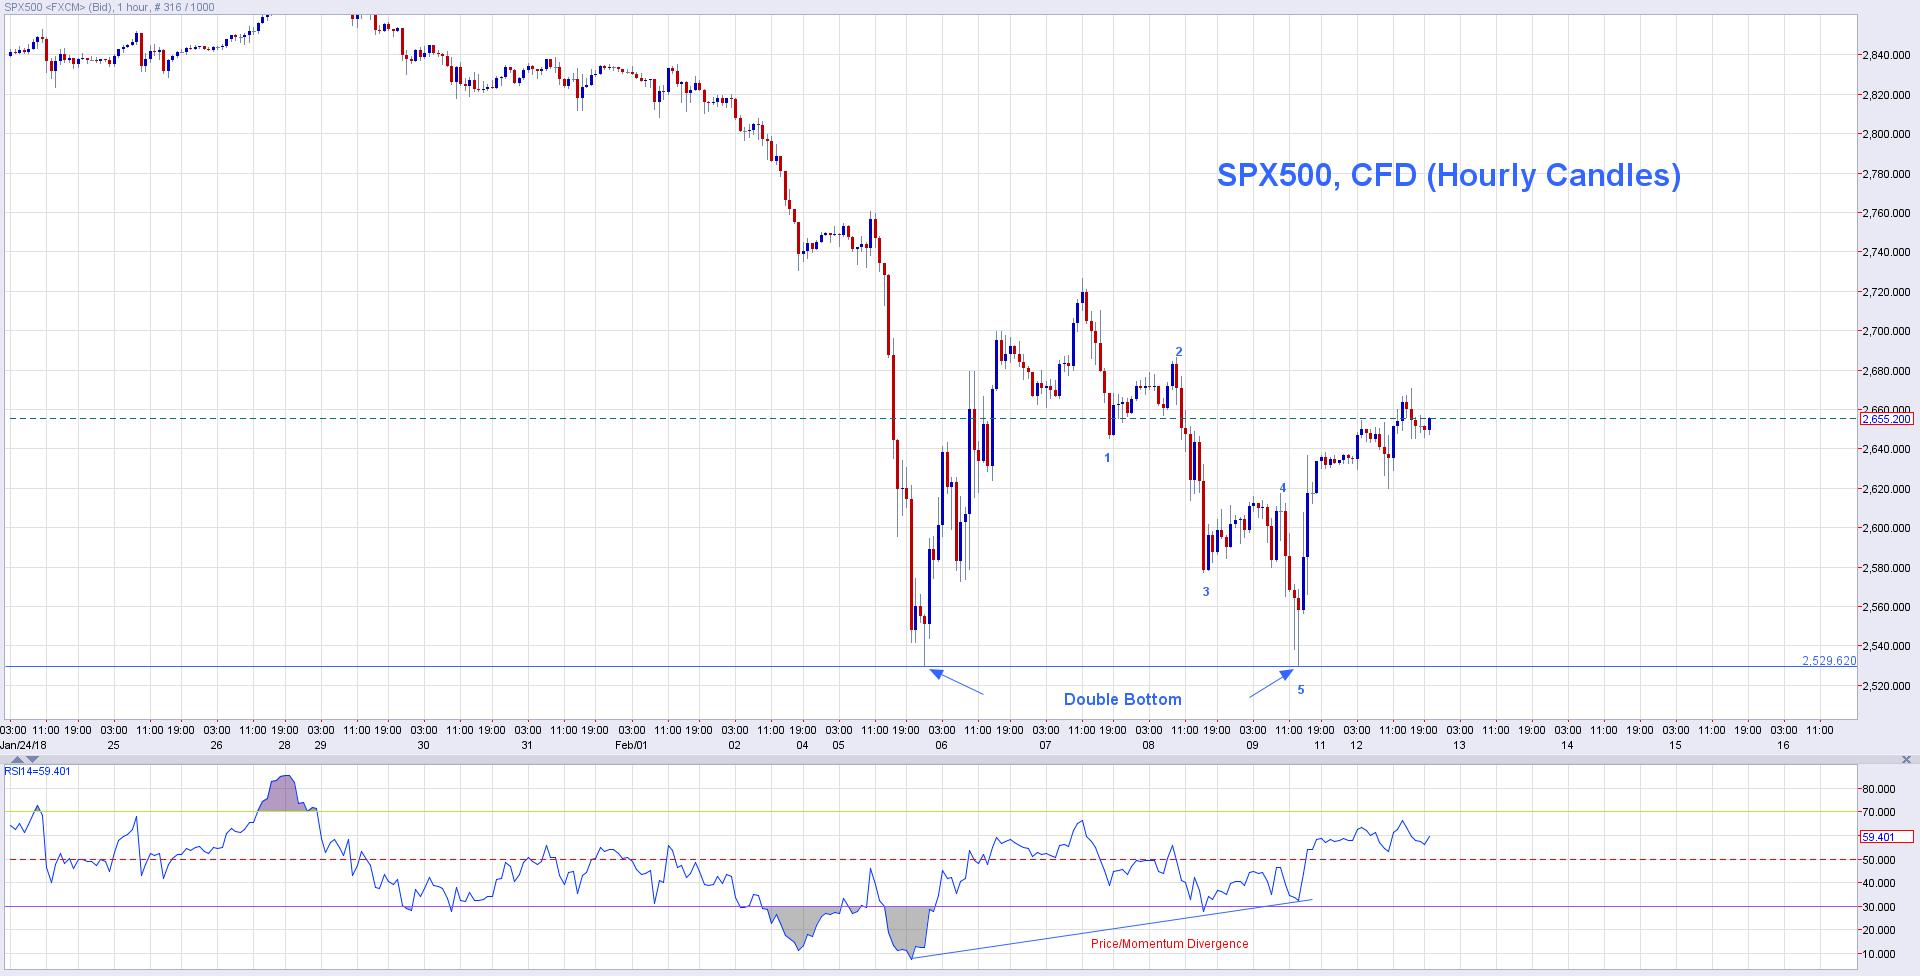
“A Double Bottom pattern occurs when price sets a low, trails higher, comes back to test that low and bounce right back up. In the SPX, we saw price come to retest the 2529 level and bounce right up! There is just one more thing needed, and that is for price to move back above the ~2720.00 level, which marks the neckline of the pattern.”
It would appear, based on Cordoba’s technical analysis that there remains one aspect of the technical analysis to validate before confirming the market trend. Until the neckline in the chart is achieved, the major averages may simply be range bound, but still offering strong trading opportunities. Exercise caution in these rapidly moving markets folks!


