

Research Report Insight #1
Prior to this past week, the S&P 500 had consolidated 4.5% from its peak in January. In February, the S&P 500 began another 4%+ correction and it may have culminated with a 5.8% correction this past week. Now let’s look at a the 1-year chart of the S&P 500 to get a better idea of the present conditions and where we’ve been.
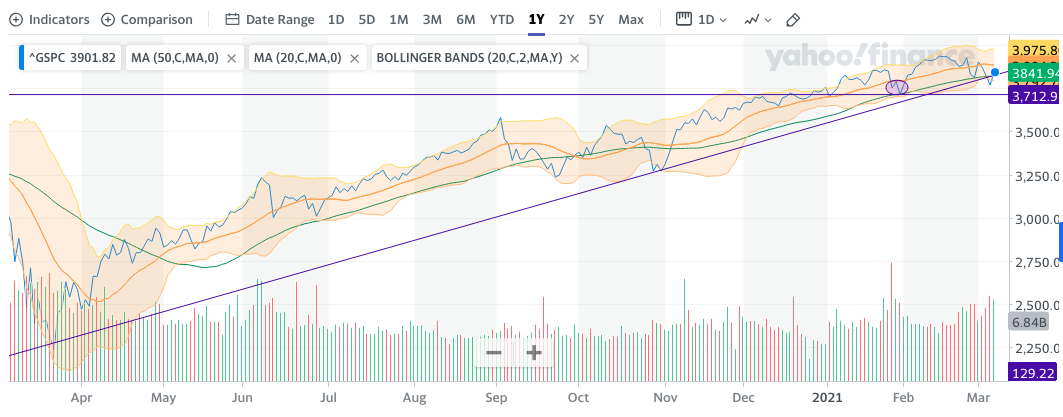
What we can see in the chart above is that the S&P 500 held a close, on Thursday, below the 50-DMA and below the lower Bollinger Band. This is usually a sign of oversold conditions, which were also indicated in the final week of October, if you walk backwards in the chart.
- The 50-DMA resides at 3,819
- Above that, the 20-DMA resides at 3,885
- While the S&P 500 did break below the long-term trend line support (purple line) briefly, it managed to close above this trend line and the 50-DMA for the week.
What I believe to be good news for the bulls, regarding the recent 5.8% consolidation in the S&P 500, is that price did not get back to the January “swing low” (3,694 and 3,714 on a closing basis). This essentially means that we have not made lower lows after making higher highs. This is still just a normal consolidation pattern within a cyclical uptrend. Could the market still consolidate down to the former swing low? Certainly that is one probability, but market breadth continues to prove resilient and points to the need for a greater downside catalyst. Something possibly other than normal and to-be-expected rising yields.
Research Report Insight #2
The Nasdaq is not out the dangers of correcting further, either for price or time and simply due to the sharp rally off of oversold conditions.
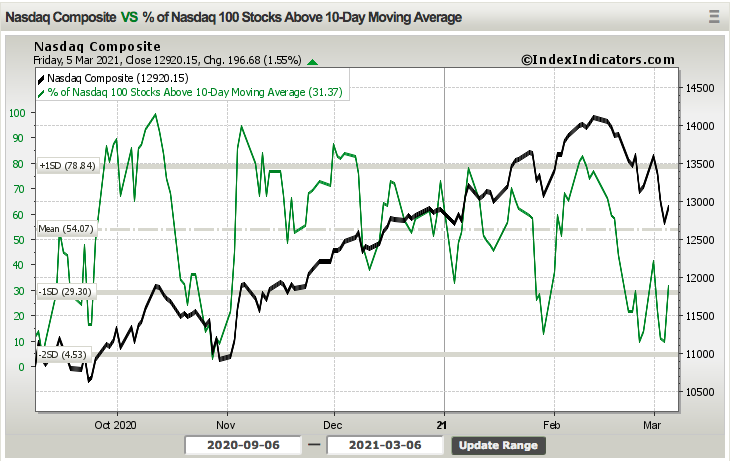
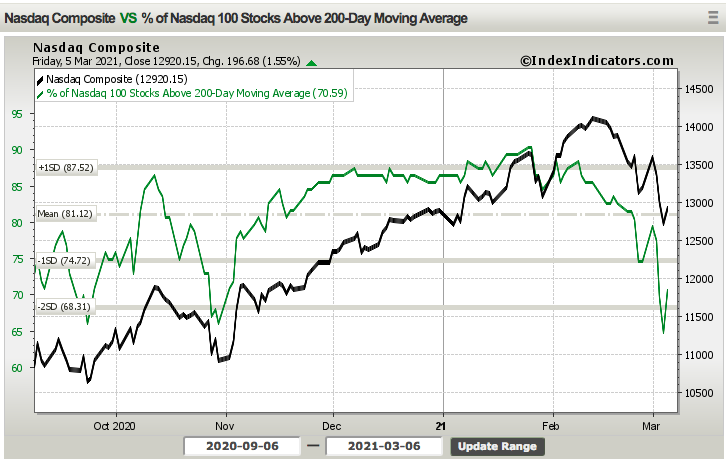
As we can see from the percentage of Nasdaq stocks trading above their 10-DMA, the oversold conditions resolved higher, but still in consolidation territory. The percentage of Nasdaq stocks trading above their 50-DMA, with the index still below its 50DMA, is also in the 30%ile range. Having said that, there remains strong reason to believe that this is also a normal and to-be-expected correction as the number of Nasdaq stocks above their 200-DMA, the longer-term moving average, remains healthy at 70 percent.
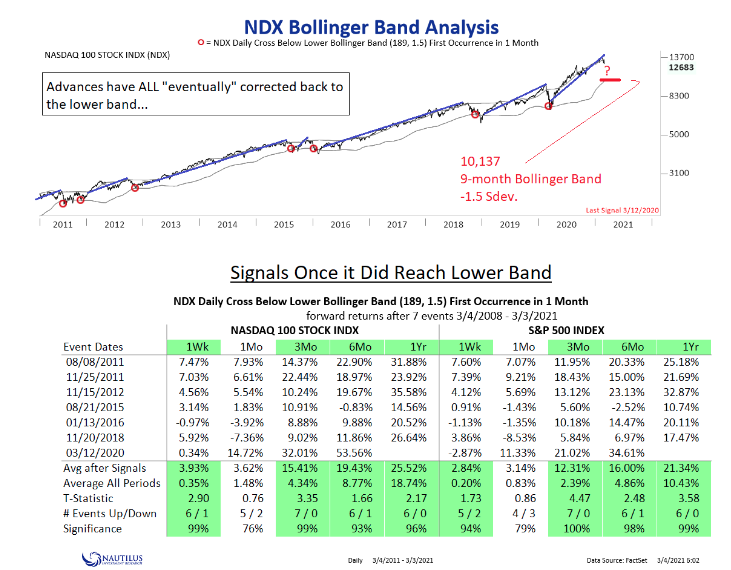
I’m of the opinion that the Nasdaq, after a 12.5% correction to-date and at one point this past week 2 standard deviations below its 50-DMA, the most oversold it has been since the March 23, 2020 COVID Crash low, is in a bottoming process. One of the issues suggesting investors need to keep an open mind when it comes to the Nasdaq is that corrections “eventually” fall back to the lower 9-month -1.5 stdev. Bollinger Band. That level wouldn’t be achieved until the Nasdaq hits 10,137. The data set only goes back to 2011, so there’s that!
Research Report Insight #3
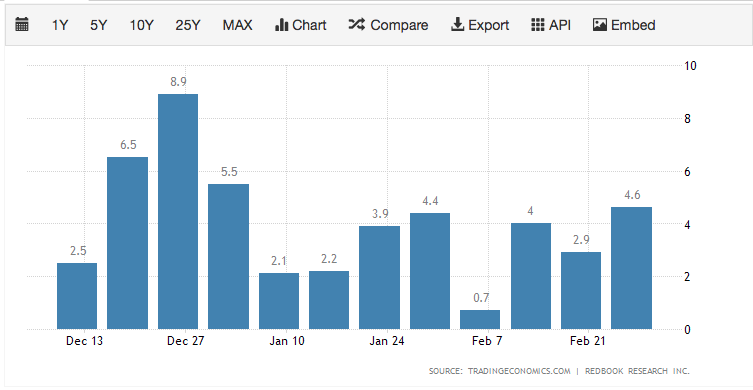
According to the latest tally of retail sales by Redbook, chain store sales surged to a 4.6% YoY clip in the week ended February 27, 2020, up from the prior 2.9% YoY rate. That’s the strongest since the January 2nd 5.5% YoY climb. The pop helped boost February month-to-date sales to a 3.1% Yo rate versus 2.6% previously. (See chart below)
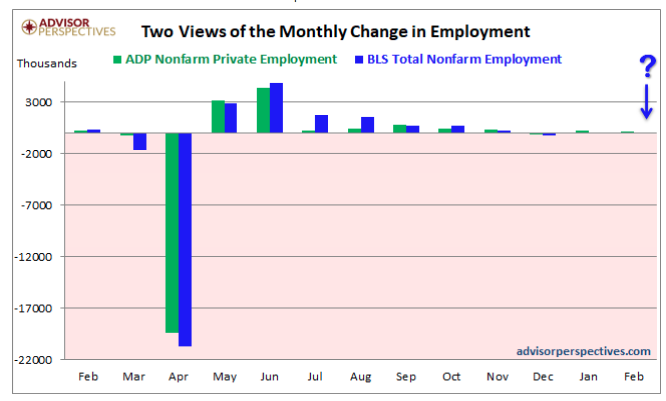
This past week was also jobs week, which was kickstarted by the ADP private sector payroll report. In the report released on Wednesday, the February estimate came in at 117K Nonfarm private employment jobs gained, a decrease over the ADP revised January figure of 195K. The 117K estimate came in below the Investing.com consensus of 177K for the ADP number.
“The labor market continues to post a sluggish recovery across the board,” said Nela Richardson, chief economist, ADP. “We’re seeing large-sized companies increasingly feeling the effects of COVID-19, while job growth in the goods producing sector pauses. With the pandemic still in the driver’s seat, the service sector remains well below its pre-pandemic levels; however, this sector is one that will likely benefit the most over time with reopenings and increased consumer confidence.”
The Labor Department on Thursday reported that first-time filings for unemployment insurance in the week ended Feb. 27 totaled a seasonally adjusted 745,000, a touch below the Dow Jones estimate of 750,000. The total was a slight uptick from the previous week’s upwardly revised 736,000.

“We expected a substantially bigger rebound after the huge winter storm pushed claims down, so this reading suggests that the underlying trend in layoffs is falling, thanks to the reopening now underway across many states,” said Ian Shepherdson, chief economist for Pantheon Macroeconomics.
Research Report Insight #4
The 10-Year Treasury yields have tracked inflation lower over time and for a long time. Rising rates are not a foregone conclusion. History tells us that every recession is followed by a trough in interest rates several quarters later.
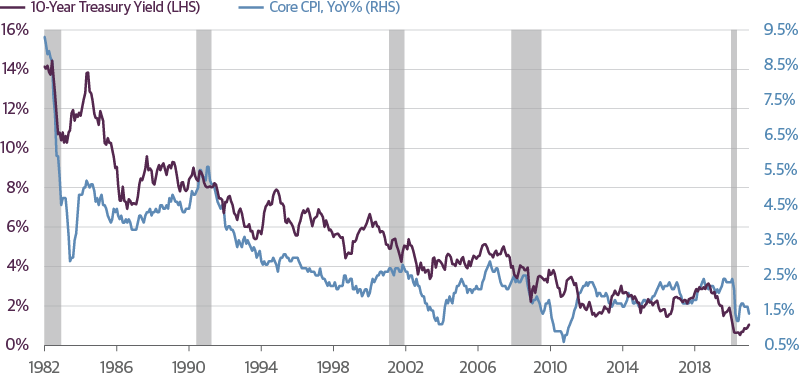
The same pattern occurred in the wake of the next two recessions. In 2008 the ten-year Treasury note touched a low of 2 percent. By 2010, as the economy began to rebound, bonds touched 4 percent only to subsequently fall to new lows of 1.4 percent in 2012.
Now, similar fears grip markets that reflationary pressures are paving the way to higher rates. No doubt, prices will rebound from post pandemic lows but given the surplus capacity throughout most of the economy and high levels of unemployment, any increase in the rate of inflation is likely transient.”
Research Report Insight #5
FY2020 and FY2021 consensus analysts’ estimates continue to rise with each passing week.
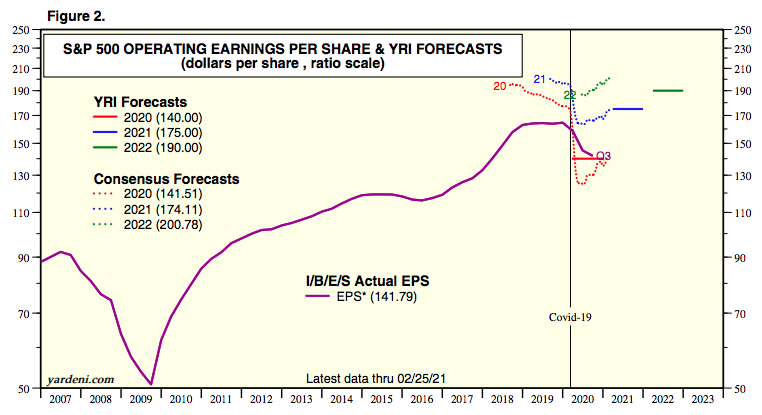
- A week ago, FY2020 was estimated at $140.08, now at $141.51 a share.
- A week ago, FY2021 was estimated at $173.63, now at $174.11 a share.
- For Q1 2021, analysts are projecting earnings growth of 21.8% and revenue growth of 6.1%.
- For Q2 2021, analysts are projecting earnings growth of 50.0% and revenue growth of 16.2%.
- For Q3 2021, analysts are projecting earnings growth of 17.3% and revenue growth of 9.8%.
- For Q4 2021, analysts are projecting earnings growth of 13.3% and revenue growth of 7.1%.
- For CY 2021, analysts are projecting earnings growth of 24.2% and revenue growth of 9.2%.
- Valuation: Forward P/E Ratio is 21.1, Above the 10-Year Average (15.8)
Research Report Insight #6
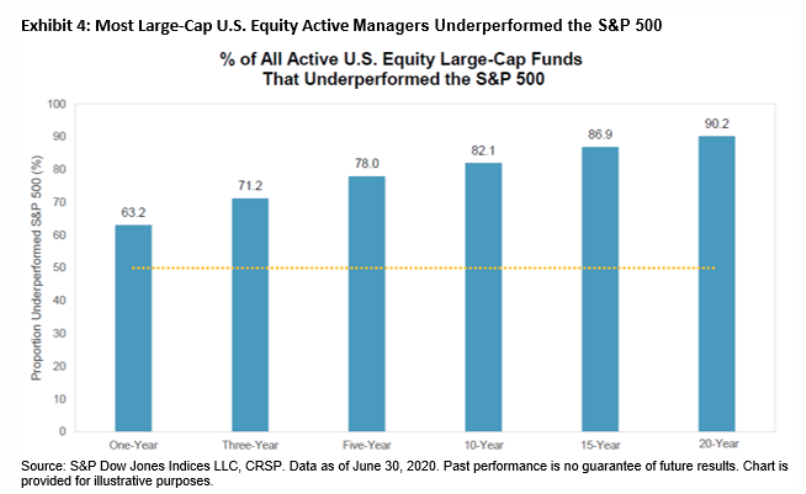
Over its history, it’s proven to be very difficult for active managers to beat the S&P 500. The U.S. SPIVA Scorecards show that most U.S. large-cap active managers underperformed the S&P 500 in 16 of 19 calendar years between 2001 and 2019. And as of the end of June 2020, the majority of all large-cap U.S. equity managers underperformed the S&P 500 across all time horizons shown.
Research Report Insight #7
Could there be more downside for the markets, as the bond:equity portfolio calculus has shifted more rapidly over the last 30 days? Insert whatever excuse or rationale for more downside as you see fit, it doesn’t matter the reason. What matters is being able to identify “buy the dip opportunities” and understanding there is always more potential downside. During a correction these are the most essential buy the dip mile markers!
- Are we in a recession? No!
- Are credit spreads blowing out, widening at a rapid pace? No!
- Is the yield curve inverted? No!
- Is the Fed raising rates? No!
- Are earnings declining? No!
- Then, have a game plan to buy the dip!
A successful long-term trader/investor is found with a psychology that appreciates both uptrends and corrections, as they both hold valuable opportunities.
Research Report Insight #8
Morgan Stanley’s chief equity strategist Mike Wilson believes there will be more downside come month-end:
“Three things tell me this correction has further to go before it’s over: 1) The nonlinear move in 10-year yields has awoken investors to a risk they thought was unlikely, if not impossible. So, while the Equity Risk Premium (ERP)held constant during this rate move as we expected, it may now move higher in anticipation of the next 50bp jump in rates. In other words, the equity market now knows the 10-year yield is a “fake” rate that either can’t or won’t be defended. To that end, the Fed did expand its balance sheet by US$180 billion in February, 50% greater than its target. Yet, rates surged higher. Markets lead theFed, not the other way around, and we are now at that moment of recognition. 2) March represents the anniversary of the market crash last year. This means there will be a big shift in the top and bottom quintiles of 12-month price momentum by the end of this month. Most of the stocks going into the top momentum quintile are value and cyclical stocks like banks,energy and materials – areas we like. Conversely, many of the stocks moving out of the top quintile are tech and other high-growth stocks – areas we don’t like at current prices. We started writing about this coming momentum composition change back in December as a potential risk and opportunity (Exhibit 1). Part of the rotation from growth to value has been due to better relative fundamentals,as the economy recovers,and cheaper valuations. However,as these value stocks move into the top quintile of price momentum and growth stocks move out, the rotation might accelerate even further. This could be quite disruptive to portfolios and lead to another round of deleveraging like in January. 3) Based on the technical damage to date, the Nasdaq 100 appears to have completed a head and shoulders top and should test its 200-day moving average (-8%, 11,618 in chart below).”
Research Report Insight #9
A final word on the whole yields rising equities freaking out conversation: Over the past 25 years, there have been nine cycles where 10-year U.S. Treasury yields increased by 100 basis points (bps) or more. In each and every instance the move higher in yields coincided with positive total returns for both the S&P 500 and Russell 2000, with averages of 17.6% and 26%, respectively. These figures are even more impressive considering that they took place during relatively short periods—an average of just 195 trading days per episode. There has been one instance of a +2% move in the 10-year Treasury since 1996, during which the S&P 500 produced a total return of 48.7 percent.
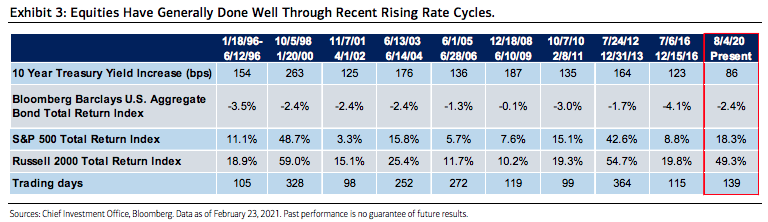
In fact, the last time that a rising rate cycle coincided with negative equity returns was in 1984-1985, when yields rose by 383 bps. Expanding our analysis even further into history does introduce more dramatic instances of yield spikes and a couple instances of negative equity returns, but the main tenets remain. The analysis suggests that focusing on the simple direction of yields may be fruitless, especially given the subjective nature on what levels are most relevant in signaling attractive alternatives to equities.


