
Services get pummelled in March; worse is to come
Global Economics Update
24 March 2020
WRITTEN BY SIMON MACADAM
- The March Flash PMIs for advanced economies were dreadful. The composite PMI for DMs plummeted to a level just shy of its all-time low. With the lockdowns only getting underway, worse will come in April.
- Today’s batch of PMIs all but confirm that advanced economies are tumbling into a deep recession. Almost all the headline and component indices have fallen to, or near, record lows across the developed world. And given that many survey responses came in before lockdowns were introduced or intensified, the PMIs will almost certainly be uglier in April. Downward revisions to flash estimates for March are likely too.
- In manufacturing, things are even worse than they first appear. This is owing to the perverse effect of the fall in the suppliers’ delivery times component (which reflects a rise in delivery times) boosting the headline index. Longer delivery times typically signal capacity shortages due to excess demand and are therefore seen as a positive development. But, in this case, they are due to supply chain disruption. Adjusting for this, the manufacturing PMI points to industrial production growth of -5% y/y, rather than -3%. (See Chart 1)
- We tend to think that goods-producing industries will suffer more than services in a downturn, but this time is different. This month’s underperformance of the services PMI is unprecedented. (See Chart 2) Although manufacturing will continue to fare badly in the coming months, services are likely to continue to take the brunt of the virus containment measures.
- It is highly likely that the PMIs are understating the weakness of activity. PMIs are based on qualitative surveys asking whether, for instance, output has risen or fallen compared to a month ago – but not by how much. In a “typical” recession, lots of firms will report moderate declines in output. The fact that many are now not producing anything at all will go unregistered in the headline numbers. We saw this play out to some extent in 2009, when output fell a lot further than the surveys suggested. (See Chart 3) So, the latest indication of a 4% annualised contraction of GDP towards the end of Q1 is almost certainly painting much too positive a picture. Indeed, for Q2, we are anticipating something closer to a 40% q/q annualised fall.
- Finally, the collapse in the employment balance bodes ill for the labour market. (See Chart 4) If governments fail to prevent jobs growth grinding to a halt and unemployment rises – as it looks to be doing rapidly in the US – this supply shock of a recession could well morph into a more protracted slump in demand.

Virus to reduce world trade by a fifth in 2020
Global Trade Monitor
25 March 2020
WRITTEN BY GABRIELLA DICKENS
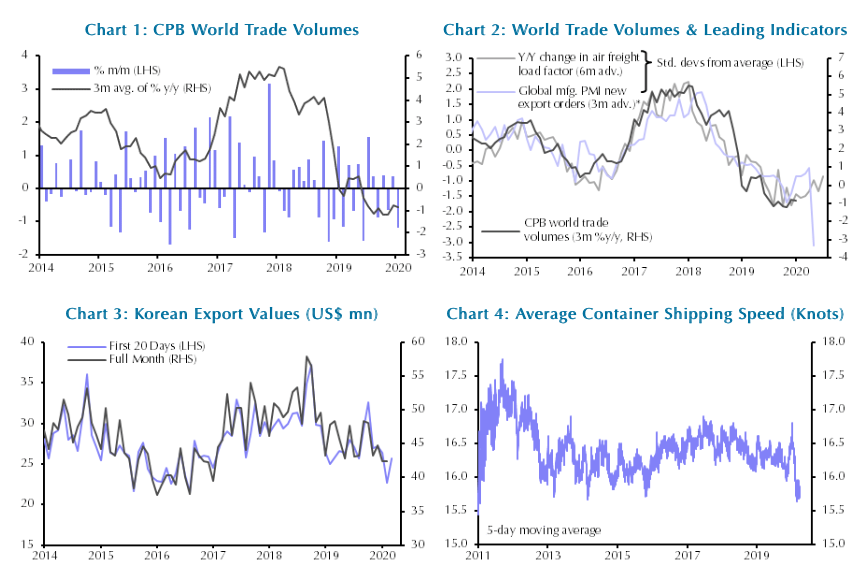
- The latest trade figures from the CPB revealed only a small fall in world trade volumes in January, but export orders from the PMI surveys have since slumped. With the coronavirus plunging the world economy into recession, global trade looks set to fall much further than it did during the financial crisis.
- Though old news, data published today by the CPB Netherlands Bureau showed that after an increase of 0.4% in December, world trade volumes contracted by 1.2% in January. (See Chart 1) In three-month year-on-year terms, trade volumes contracted by 0.8%.
- Leading indicators had pointed to a stabilisation in global trade at the turn of the year. (See Chart 2) But with the world economy now falling into recession, any potential for a recovery in global trade has been blown out of the water. Indeed, the country-level CPB data showed that the coronavirus was already having an impact on Chinese exports, which dropped by over 11% in January.
- Admittedly, Korean trade data showed that exports in the first 20 days of March rose by 0.4% m/m, implying that the shock to trade caused by shutdowns in China have already started to ease. (See Chart 3) But these data need to be taken with a pinch of salt. After all, the resilience of Korean exports in early March will almost certainly prove to be a one-off. During this period, restrictions in China had begun to be lifted, while lockdowns elsewhere either hadn’t been introduced or were just starting to take effect. What’s more, average shipping speeds have fallen sharply and remained low by past standards, indicating prolonged disruption in global container traffic. (See Chart 4)
- The coronavirus looks likely to deal a larger blow to world trade than the global financial crisis. The new export orders component of the global manufacturing PMI plunged in February to its lowest level since early 2009, consistent with world trade volumes contracting by around 1% y/y. And that was before the virus-related disruption outside China really got going. Indeed, the new export orders indices in the March flash PMI surveys fell to record lows in Japan and the euro-zone, while those in the US and the UK continued to drop sharply. In aggregate, the slump in advanced-economy export orders points to a much deeper contraction in export volumes. (See Chart 5)
- What’s more, the drop in the global suppliers’ delivery times index last month to its lowest level in nearly nine years provided further evidence of severe dislocation in global supply chains. And again, the flash PMIs for DMs point to those falls worsening in March. It’s worth remembering that a fall in the index reflects a lengthening of delivery times. In normal circumstances, that would be due to heightened demand but in this instance, the fall is the result of disruption to global trading links.
- The financial crisis offers a rough guide with which to gauge the scale of the fallout for world trade in 2020 as a whole. In 2009, world GDP contracted by 0.6% while trade volumes plummeted by nearly 13%. In 2020, we have a much larger contraction pencilled in for the global economy of just over 2.5%. On past form, that suggests that trade volumes will decline by close to 25% this year. (See Chart 6)
- However, there are at least two reasons why trade volumes may not perform quite so badly relative to the drop in GDP this time around. First, the hit to the manufacturing sector in previous downturns has tended to be larger than that to the services sector, which has disproportionately affected trade in goods. But, on this occasion, virus containment measures are weighing more heavily on the services sector. Second, unlike in 2009, world trade is less likely to be restricted by a pullback in the provision of trade finance, since the banking sector appears to be in better shape. So, rather than knocking a quarter off world trade this year, we expect the virus to cause world trade volumes to fall by around a fifth.

Easing funding strains are a sign of progress
Capital Daily
26 March 2020
WRITTEN BY JONAS GOLTERMANN
The renewed weakening of the U.S. dollar over recent days suggests that policymakers’ efforts to ease strains in short-term funding markets are having an effect.
Since the spread of the coronavirus sent equity markets into a tailspin about a month ago, the dollar has gone through two distinct phases. (See Chart 1) At first, the dollar depreciated against the major currencies captured in the DXY index as expected interest rates fell more sharply in the US than elsewhere. But as the market turmoil intensified, the dollar rose, both because expected interest rates in the US approached zero and didn’t fall further, and because the panic led to a scramble for dollars as short-term funding markets dried up.

One clear sign of the distress was the sharp widening of cross-currency basis between the dollar and other major currencies. (See Chart 2) (This is the additional cost of obtaining dollars when using a different currency as collateral.) As market participants who fund their dollar balance sheets in wholesale markets struggled to roll that funding, the basis widened, driving the greenback up (another option for a non-US borrower in need of dollars is to buy them in the spot market). That is similar to what happened during the Global Financial Crisis (GFC), when dollar funding became scarce. Then, the basis widened much further and the DXY index rose by almost 25%.

This time around, central banks have acted quickly to alleviate the strain on dollar funding markets, with the Fed reactivating crisis-era swap lines to the other major central banks, enabling them to provide dollars to their banking systems. But while the cross-currency basis has eased, and the dollar softened, other indicators of stress remain elevated. In general, though, they have eased a little this week, and remain well below their GFC peaks. (See Chart 3). We have published a new Financial Market Stress Monitor that takes stock of different signs of stress across the global financial system, which we intend to update periodically. (Jonas Goltermann & Franziska Palmas)


